Alma Mater Studiorum – Università di Bologna
DOTTORATO DI RICERCA IN
Chimica
Ciclo XXIX
Settore Concorsuale di afferenza: 03/C1 – CHIMICA ORGANICA Settore Scientifico disciplinare: CHIM/06 – CHIMICA ORGANICA
TITOLO TESI
NMR AND MASS SPECTROSCOPIC TECHNIQUES FOR SOURCE
APPORTIONMENT OF ATMOSPHERIC PARTICULATE MATTER
Presentata da: Dott. Nicola Zanca
Coordinatore Dottorato
Relatore
Prof. Aldo Roda
Prof. Emilio Tagliavini
Correlatore
Dott. Stefano Decesari
To my Family
We are the last generation that can fight climate change
Ban Ki-Moon, UN Secretary – 2015
Non chi comincia ma quel che persevera
1
TABLE ON CONTENTS
ABSTRACT………4
Papers on the international refereed literature originating from this thesis…………....6
1. INTRODUCTION……….………...…7
1.1 An introduction to atmospheric aerosols………..7
1.2 Aerosol physicochemical characteristics……….………...…9
1.3 Aerosol chemical composition………..…………...…....13
1.4 Organic aerosol………...14
1.5 Environmental impacts of atmospheric aerosols………..17
1.5.1 Aerosol and health – European Air Quality……….………17
1.5.2 Aerosol and climate: IPCC report………..19
1.6 Measurement techniques for organic aerosols………...22
1.6.1 Introduction………..22
1.6.2 Off-line techniques………25
1.6.2.1 Aerosol sampling………...…25
1.6.2.2 Sample preparation………..…25
1.6.2.3 Off-line molecular speciation methods………26
1.6.2.4 Off-line functional group analysis………...30
1.6.2.5 Nuclear magnetic resonance………31
1.6.3 On-line techniques………35
1.6.3.1 Aerosol mass spectrometry………..35
1.6.3.2 Aerosol chemical speciation monitor………...36
1.6.4 Organic aerosol source apportionment………...…38
1.6.4.1 Overview on source apportionment models of atmospheric aerosol………38
1.6.4.2 Factor analysis of OA chemical dataset………..40
1.6.4.3 NMR, AMS and ACSM PMF……….……..42
2
2.
EXPERIMENTAL, RESULTS AND DISCUSSION………452.1 PART I: CHARACTERIZATION AND SOURCE APPORTIONMENT OF WATER SOLUBLE ORGANIC CARBON IN FINE PARTICULATE MATTER SAMPLES DURING PEGASOS AND SUPERSITO CAMPAIGNS………...45
2.1.1 Overview………45
2.1.2 Experimental……….46
2.1.2.1 Sampling sites for organic aerosol analysis………..46
2.1.2.2 Aerosol sampling………..……...48
2.1.2.3 Sample extraction and workup………..49
2.1.2.4 Total Organic Carbon (TOC) analysis……….50
2.1.2.5 Ion Chromatography……….………….50
2.1.2.6 GC/MS analysis………...50
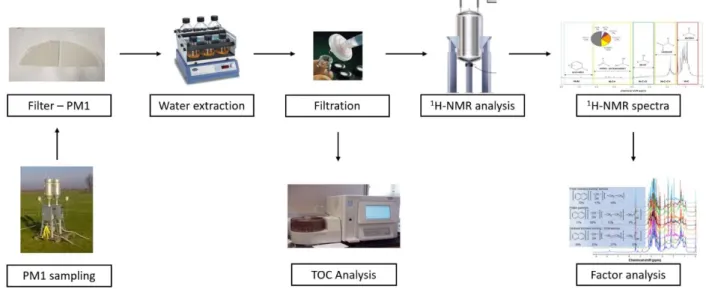
2.1.2.7 1H-NMR spectroscopy: protocol of analysis……….51
2.1.2.8 1H-NMR analysis: accuracy of individual compound analysis………...53
2.1.2.9 1H-NMR analysis: spectral deconvolution………....54
2.1.3 Results: determination of the chemical composition of the organic fraction of PM by Proton Nuclear Magnetic Resonance (1H-NMR) spectroscopy………...56
2.1.3.1 Analysis of molecular markers………..63
2.1.3.2 Functional groups analysis……….66
2.1.3.3 Source apportionment of WSOC by 1H-NMR factor analysis……...66
2.1.3.4 CASE 1. Winter campaign: February 2013 at the urban site………66
2.1.3.5 CASE 2: Autumn campaigns: field measurements at the urban and the rural station in October 2013……….………..68
2.1.3.6 CASE 3: June-July 2012 (PEGASOS)……….……….…76
2.2 PART II: CHARACTERIZING SOURCE FINGERPRINTS AND AGEING PROCESSES IN POTENTIAL AEROSOL MASS (PAM) SOA EXPERIMENTS USING 1H-NMR ANALYSIS AND HPLC HULIS DETERMINATION……...……83
2.2.1 Overview………...….83
2.3 PART III: ORGANIC AEROSOL MASS SPECTROMETRIC MEASUREMENTS IN THE MEDITERRANEAN REGION………85
2.3.1 Overview……….………...85
2.3.2 Experimental……….87
2.3.2.1 Sampling and measurements during Air-Sea Lab (April 2016)………..87
3
2.3.2.3 ACSM………...90
2.3.2.4 Back-trajectory calculation………90
2.3.2.5 Ion chromatography………...91
2.3.3 Results………...91
2.2.1.1 ACSM measurements at the harbor of Civitavecchia…………...91
2.3.3.2 Ship measurements with an ACSM onboard the Vespucci navy vessel – Dual Use Vespucci………...…….96
3. FINAL REMARKS….………102
Acknowledgements……….……….104
List of frequently used abbreviations………...106
References………...108
4
ABSTRACT
Aerosols are ubiquitous in the atmosphere, and play a key role in several environmental processes at local and global scale affecting visibility, air quality, and the climate system. Assessing aerosol impacts on human health, climate change and adopting mitigation and adaptation measurements is a global challenge and third millennium priority. For example, the Po Valley is one of the most critical area in Europe for the air quality, with PM2.5 concentrations normally exceeding regulatory thresholds especially in the cold season, whereas the Mediterranean basin, with its vulnerability toward aridification, is considered a hot spot for climate change.
Efficient policies aiming to contain the health and climate impacts of atmospheric aerosols rely on the reconstructed budget of PM apportioned into its various natural and anthropogenic fractions, which in turn must be constrained by adequate field observations of aerosol chemical composition. In particular, the investigation of the sources of organic aerosol (OA) has reached a high degree of sophistication to cope with the very high complexity of its molecular composition.
In the present study, proton nuclear magnetic resonance (H-NMR) spectroscopy and aerosol mass spectrometry implemented by an “aerosol chemical speciation monitor” (ACMS) were employed to investigate the chemical composition of submicrometric aerosol collected during a series of intensive field campaigns and to resolve its composition into source-specific fractions including distinct types of primary and secondary organic aerosols (POA and SOA).
During the first study, aerosol samples were collected in the Po Valley, in Bologna (urban background site) and San Pietro Capofiume (rural site, 35 km NE from Bologna), during the summer 2012 (PEGASOS project) and fall, winter seasons 2013 (SUPERSITO campaigns). The H-NMR data were elaborated to provide concentrations of organic markers and functional group distributions. They were processed afterwards by factor analysis for spectral deconvolution into source-specific spectral profiles and contributions (“factors”). The attribution of H-NMR factors to specific sources was based on available spectral libraries and sometimes integrated with information from ancillary techniques (including organic markers from GC/MS and LC/MS analysis). The results show that biomass burning POA and SOA dominate the composition of oxygenated organic aerosols in the Po Valley in the cold season, whereas humic-like substances (HULIS), related to chemically-aged SOA types (contributed by biogenic sources), are prevalent in the summertime.
In the second part of this thesis work, SOA samples were produced in laboratory using a flow tube reactor designed to simulate prolonged photochemical ageing. The samples were analyzed by H-NMR and high-liquid performance chromatography (HPLC) for the characterization of isoprene, α-pinene and naphthalene SOA products. The composition of aged biogenic and anthropogenic SOA
5
was compared to the spectral datasets from the Po Valley experiments and highlighted a good match between the H-NMR spectral profile of laboratory aged biogenic (monoterpene) SOA with that of ambient OA in the Po Valley in summertime, confirming that atmospheric HULIS can share a biogenic origin and be produced photochemically.
The third part of this work was dedicated to two field campaigns at coastal and marine sites in the central Mediterranean region: the first one in Civitavecchia – the port of Rome, for the AIR-SEA Lab project -, and another one onboard the Amerigo Vespucci vessel during the project Dual Use Vespucci. On-line aerosol measurements were performed using a mass spectrometer (ACSM) during the spring and summer 2016 with the aim of source apportionment of PM into source contributions from local pollution (in harbors) and background components. Results showed that PM1 total concentration resulted only 22% lower over the open sea with respect to ports, but the fossil fuel component of OA (the hydrocarbon fraction) was much more enriched in harbors than in off-shore areas.
The overall results suggest that H-NMR spectroscopy and ACSM can be profitable used for source apportionment of submicrometric organic aerosols, especially when supported by combination with chromatographic speciation of organic markers, and by techniques of factor analysis for spectral deconvolution.
6
Papers on the international refereed literature originating from this thesis
Sandrini, S.; Pinxteren, D. van; Giulianelli, L.; Herrmann, H.; Poulain, L.; Facchini, M.C.; Gilardoni, S.; Rinaldi, M; Paglione, M.; Turpin, B.J.; Pollini,F.; Bucci, S.; Zanca, N.; Decesari, S.: Size-resolved aerosol composition at an urban and a rural site in the Po Valley in summertime: implications for secondary aerosol formation. Atmospheric Chemistry and Physics, 16, 10879-10897, 2016.
Zanca, N.; Lambe, A.T.; Massoli, P.; Paglione, M.; Croasdale, D.R.; Parmar, Y.; Tagliavini, E.; Gilardoni, S.; Decesari, S.: Characterizing source fingerprints and ageing processes in laboratory-generated secondary organic aerosols using proton-nuclear magnetic resonance (1H-NMR) analysis and HPLC HULIS determination. Under revision on Atmospheric Chemistry and Physics.
Pietrogrande, M.C.; Barbaro, E.; Bove, M.C.; Clauser, G.; Colombi, C.; Corbella, L.; Cuccia, E.; Dalla Torre, S.; Decesari, S.; Fermo, P.; Gambaro, A.; Gianelle, V.; Lazzeri, P.; Lercher, R.; Massabò, D.; Melchionna, G.; Nardin, T.; Paglione, M.; Perrino, C.; Prati, P.; Visentin, M.; Zanca, N.; Zangrando, R.: Results of an Interlaboratory Comparison of Analytical Methods for quantification of anhydrosugars and biosugars in atmospheric aerosol. Submitted to Chemosphere.
Zanca, N.; Decesari, S.; Pietrogrande, M.C.; Visentin, M.; Gilardoni, S.; Paglione, M.: Comparison between NMR PMF factors and GC/MS polar organic tracer datasets for the source apportionment at the Po Valley in the cold season. In preparation.
7
1. INTRODUCTION
1.1 AN INTRODUCTION TO ATMOSPHERIC AEROSOLS
Atmospheric aerosol is generally defined as a suspension of liquid or solid particles in the air, with particle diameters in the range of 10-9–10-4 m, the particle sizes span over several orders of magnitude, ranging from almost macroscopic dimensions down to near molecular sizes (Hinds 1999; Seinfeld and Pandis, 2006; Ruiz-Jimenez J. et al., 2011). The term originated as the gas-phase analogue to hydrosols (meaning “water particle” in Greek) and refers to suspension of particles in a liquid (Kulkarni et al., 2011). Particles much greater than 100 μm do not stay airborne long enough to be measured and observed as aerosols. The lower limit is controlled by the size of a cluster of half a dozen or so molecules: this is the smallest entity of the condensed phase that can exist. The definition of aerosol is used to a wide range of clouds of particles found in nature airborne; particles from (re)-suspended soil, welding fumes, atmospheric cloud droplets, airborne particles from volcanic eruptions, smoke from power generation, cigarette smoke, sand storms or clouds formed from pollens, salt particles formed from ocean spray, particles from bacteria or viruses, are all examples of aerosols (Kulkarni et al., 2011; Seinfeld and Pandis 2006; Vicent, 1989).
Many commonly known phenomena such as dust, fume, fog, smog, mist, suspended particulate matter, or smog can be described as aerosols. The most evident examples of aerosols in the atmosphere are clouds, which consist primarily of condensed water with particle diameters on the order of approximately 100 μm. In this PhD thesis, we use aerosol and particulate matter (PM) as synonyms for convenience, since the research is focused on atmospheric solid and liquid (deliquesced) particles (with the exception of cloud and fog droplets) in the atmosphere. The term aerosol technically refers to both the condensed phase particles and the gaseous medium suspended in PM (Kulkarni et al., 2011; Colbeck et Lazaridis, 2010).
Atmospheric aerosol particles originate from a broad assortment of natural and anthropogenic sources. Primary particles are directly emitted from sources such as dust, sea salt, volcanic eruptions, biomass burning, incomplete combustion of fossil fuels, and mechanical processes resulting from the friction of wind over land and sea surfaces that lead to the suspension of mineral dust, and biological materials such as spores, plant fragments and microorganisms. In urban environments, traffic can promote the (re-)suspension of particles as well. Secondary particles instead are formed in the atmosphere by the transformation of reactive gases into particulate matter by chemical reactions, from
8
the condensation of low volatility gases such as sulfuric acid, ammonia and functionalised organic compounds or upon cooling of the air mass (gas-to-particle conversion).
Long-range transboundary air pollution transport is responsible for a significant fraction of the particulate pollution in European cities (European Monitoring and Evaluation Programme - EMEP 2016; Colbeck and Lazaridis, 2010). A major part of this contribution is secondary particulate matter in the form of sulfate, nitrate, ammonium, and organic aerosol particles formed by the oxidation of sulfur dioxide, nitrogen oxides, and organic gaseous species. A recent report on the hemispheric transport of air pollutants concluded that the impact of intercontinental transport of PM on air quality is primarily episodic and associated with major emission events such as fires or dust storms. Such transport can also have large impacts on total atmospheric column loading and, hence, implications for climate change (Keating and Zuber, 2007).
Airborne particles undergo various physicochemical transformations (atmospheric aging), comprehending changes of structure, shape, particle size, shape, and composition as illustrated in Figure 1.1. Cloud formation can also lead to fast aerosol ageing, as particles are scavenged (aerosol enter water droplets, Giulianelli et al., 2014) into cloud droplets, chemical reactions and gas absorption occur in the aqueous phase and in the end droplet can re-evaporate originating particles with different chemical composition with respect to the original aerosols (cloud processing). Aerosol particles can be scavenged in cloud systems either by impact with cloud droplets or by direct nucleation of water vapor to form new droplets. In the last case, aerosols act as cloud condensation nuclei (CCN) or ice nuclei (IN), depending on atmospheric temperature.
Figure 1.1: Atmospheric cycling of aerosols and examples of common aerosol shapes and compositions as observed by scanning electron microscopy, SEM (from Pöschl, 2005).
9
In precipitating clouds, the “wet deposition” is a process in which condensation nuclei and other aerosol particles are scavenged and removed from the atmosphere, on the way to the surface. Wet deposition is the main sink of submicrometric atmospheric PM. Dry deposition, conversely, leads PM to be removed by diffusion, convective transport and adhesion to the Earth’s surface without precipitation of hydrometeors. Dry deposition at the global scale is less efficient for fine aerosol fluxes, but cannot be ignored at the urban scale. The typical aerosol particles residence time in the atmosphere range between hours and weeks, depending on aerosol characteristics and meteorological conditions. The aerosol composition, concentration and size distribution are highly variable. In the troposphere (the lower atmosphere), the total particle number varies in the range of about 102–105 cm-3, whereas the mass concentration ranges between 1 to 100 μg m-3.
1.2 AEROSOL PHYSICOCHEMICAL CHARACTERISTICS
Particles in the atmosphere have a distribution of sizes, and lognormal distributions are often used for their description (Hinds, 1999). The aerosol size distribution is a crucial parameter that determines the dynamics of aerosols in the atmosphere, their transport, deposition, and residence time. Figure 1.2 presents typical atmospheric aerosol distributions by number, surface area, and volume. The shapes of size distributions, although containing the same modes, look very different according to whether the distribution is plotted for number concentrations or volume concentrations. The reason is that particle populations at the small end of the size distribution can be very abundant in number, but as volume is proportional to the cube of diameter, such particles may contribute only to a small fraction of total aerosol volume. Therefore, particle number size distributions give far more emphasis to small particles compared to particle volume size distributions. In addition, one can derive the mass distribution from the volume distribution data when the particle density is known. The volume distribution is usually bimodal with minimum at ∼1 μm (divide between coarse and fine particles). Coarse particles are generally formed by mechanical processes such as dust resuspension. They are typically rich in the naturally occurring crustal material (Ca, Fe, and Si) as well as sea salt. The fine particles can be rich in carbon, nitrates, sulfates, and ammonium ions. They are generally formed by combustion or gas-to-particle conversion. The particles in the two modes not only differ in origin but also have different atmospheric fates, as discussed below.
10
Figure 1.2. Aerosol size distribution with principal modes. Main mechanisms of formation and growth of particles acting in the various size ranges are also shown. (Araujo et al., 2009).
Particles can be categorized according to their size based on (1) their observed modal distribution (Hinds 1999), (2) the 50% cut-off diameter, or (3) from dosimetric variables which are related to human exposure. In the latter case, the most common division is PM2.5 and PM10 particles. PM10 is defined as PM which is sampled through a size-selective inlet with a 50% efficiency cut-off for particles of 10 μm aerodynamic diameter. Similarly, the cut-off for PM2.5 is 2.5 μm. The 2.5 µm threshold is related to the ability of PM2.5 particles to penetrate the lower tracts of the human respiratory system.
Further aerosol populations can be identified according the following terminology:
Nucleation mode: Particles with diameter <10 nm, which are formed through nucleation processes, i.e., by the formation of aerosols directly from gas-phase reactions. The lower limit
11
of this category is not very well defined but is dictated by instrument capability. An ion aerosol spectrometer can detect particles down to 1.5 nm, close to molecular cluster size, whereas the cut-off for a condensation particles counter is limited to 3 nm.
Aitken mode: Particles with diameter 10 nm<d<100 nm. They originate from combustion emissions or from condensational growth of nucleation-mode particles.
Accumulation mode: Particles with diameter 0.1 μm <d<1 μm. The upper limit coincides with the minimum of the total particle distribution. Particles in this mode are formed by coagulation and condensational growth of Aitken-mode particles. .
Ultrafine particles: Particles of diameter < 0.1 µm, equivalent to the size range encompassing the Aitken mode and the nucleation mode.
Fine particles: Includes the nucleation, Aitkin, and accumulation modes. Coarse particles: Particles with diameters between 1 and 10μm.
The distinction between fine and coarse particles is fundamental whenever dealing with the physics, chemistry, measurement, and the health effects of atmospheric aerosol, because very different formation, transformation and removal processes characterize the submicron and supermicron regimes (Seinfeld&Pandis, 2006) (Figure 1.3). Coarse particles are formed mainly by mechanical processes like dust suspension or re-suspension or sea spray. Coarse particles have sufficiently large sedimentation velocities to make them settle by dry deposition within a few hours of transport in the lower troposphere, although longer transport (> 1 day) are possible at high altitudes. Coarse particles never account for more than a few percent of the particles by number concentration, even if they can account for a large fraction in term of particulate mass.
12
Figure 1.3. Microphysical processes that affect size distribution and chemical composition of atmospheric aerosol. The diagram shows the wide size range of particles and as the aerosol participates in processes through atmospheric chemical reactions in homogeneous and heterogeneous phase or within clouds (Raes et al., Atm. Env. 2000).
Fine particles, on the contrary, are mainly generated by secondary processes (e.g. gas-to-particle mechanisms) and by primary sources (e.g. vehicular emissions, biomass burning, etc.). The rapid gas condensation conducts to new particles by nucleation (nucleation mode). This mechanism takes place during the rapid cooling of an exhaust immediately upon dilution in the air, but can occurs also by photochemical reactions at ambient temperature. The Aitken mode results from condensation of vapors onto nucleation mode particles and from their coagulation, as well as from primary combustion emissions. Finally, the accumulation mode, usually results from prolonged – several hours to day – condensation of vapours on Aitken particles and, in non-precipitating cloud droplets, from the formation of particles by chemical reactions (Kerminen et al., 2004). Removal processes (deposition, coagulation, diffusion to surfaces) are the slowest in this size range, and, as a consequence, these particles tend to accumulate in the atmosphere (hence the term “accumulation mode”). The most efficient sink for accumulation mode particles is by wet deposition (through precipitations). Accumulation-mode particles usually account for most of the aerosol surface area. They also provide an equivalent or greater contribution to total aerosol mass with respect to coarse particles.
13
Fine particles, given their small size, penetrate deeply into the human respiratory system, down to the alveola, causing potential systemic health effects. Moreover, because of their long residence time in the atmosphere, accumulation mode particles contribute to transboundary air pollution transport and to the modification of atmospheric transparency over vast geographical areas. For these reasons, my PhD focused on fine (submicron or PM1) particles.
1.3 AEROSOL CHEMICAL COMPOSITION
Aerosols are ubiquitous in the atmosphere. They comprise a complex mixture of low-volatility and semi-volatile organic and inorganic compounds (Colbeck and Lazaridis M, 2010). Compared to long-lived greenhouse gases, tropospheric aerosol exhibits a chemical composition characterized by a much greater spatial and temporal variability, reflecting the variety of sources, transformations and removal processes. Aerosol chemical constituents can be classified into broad categories: inorganic water-soluble salts such as sulfates, nitrates, ammonium salts and sea salt, soluble and insoluble carbonaceous material, and insoluble inorganic compounds from soil particles and combustion ash. Carbonaceous particles are found in the troposphere as elemental carbon (EC) (or “black carbon”, BC), organic carbon (OC) and carbonate carbon, the latter being negligible in the submicron size range. Produced solely by combustion processes, EC strongly absorbs light and it is responsible for degraded visibility (Bond and Bergstrom, 2006). Organic carbon is produced by both primary sources (e.g., combustion) and gas-to-particle conversion (Castro et al., 1999). Finally, coarse particles are generally associated with sea salt and crustal species emitted by mechanical processes at the Earth surface. Since aerosol surface generally reaches a maximum in the accumulation mode, gas-to-particle formation of organic and inorganic compounds (e.g., ammonium sulfate and nitrate) occur preferentially in fine particles. However, heterogeneous chemical reactions at particle surface may lead some compounds, like nitrate, to form by condensation in both fine and coarse modes. For instance, the condensation of nitric acid on coarse-mode sea salt particles with formation of sodium nitrate and displacement of HCl has been documented (Dasgupta et al., 2007). An overview of the average size-segregated chemical composition of tropospheric aerosols in Europe was first published by Putaud and co-workers (2004), followed by more detailed phenomenologies of the aerosol chemical composition obtained for several European sites (Putaud et al., 2010). In European emission inventories, combustion of fuels within the residential sector is covered by the so-called 'commercial, institutional and household' sector. The fuel combustion in this sector is the major source of primary PM2.5 and PM10. In the Figure 1.4 below and example of PM2.5 emissions in the EU‑28 by sector (EEA, 2016).
14
Figure 1.4. PM2.5 emissions in the EU‑28: share by sector group in 2014.
http://www.eea.europa.eu/publications/air-quality-in-europe-2016
1.4 ORGANIC AEROSOL
Organic aerosol (OA) includes a large fraction of the ambient aerosol mass and exert potential important impacts on human health, visibility and on the climate system (e.g. Kanakidou et al., 2005; Jimenez et al., 2009). OA is widespread in all environments and represent a large, sometimes dominant aerosol fraction in the lower troposphere, accounting for 20-90% of atmospheric fine particle mass (Kanakidou et al., 2005; Zhang et al., 2005; Jimenez, 2009; Turpin et al., 2000). OA accounts for complex mixtures of individual organic compounds which are often present at trace levels, with concentrations generally less than a few ng/m3 each (Shimmo et. al., 2004). A wide range of both anthropogenic and natural sources were blamed for OA production, including combustion of fossil fuels, lubricants, industrial emissions, biomass burning, spores and plant debris, and biogenic emission of volatiles (Jacobson et al., 2000). About 2000 Tg/yr of organic compounds are estimated to be emitted into the atmosphere as gases, another 300 Tg/yr as particulate matter (aerosols), and a smaller uncertain fraction is dissolved in fog droplets or cloud. While these quantities represent only
15
a few percent of the total carbon budget, dominated by CO2, they represent 104−105 individual compounds (Goldstein et al., 2007) which take part in many atmospheric chemical reactions.
Understanding the processes where organic compounds are involved in the atmosphere depends on how well these compounds are identified (Nozière et al., 2015). Moreover, the chemical fates of trace atmospheric species are often intertwined. The life cycles of the trace organic species are coupled through the complex array of chemical and physical processes in the atmosphere. For instance, the photochemical production of tropospheric ozone does not depend linearly on the concentrations of precursors (volatile organic compounds, VOCs) or catalysts (nitrogen oxides, NOx), but very much on their ratio (VOC/NOx), and consequently the production of ozone can be NOx-limited or alternatively VOC-limited depending on the environment (Seinfeld and Pandis, 2006).
Organic aerosols can be separated into primary (POA) and secondary (SOA) depending on their process of formation. POA consists of particles that are directly emitted into the atmosphere such as organic compounds formed by combustion processes (that contribute mostly to the fine fraction of OA) or plant particles from biogenic sources (more representative of the coarse fraction). Spray of organic-rich liquid surfaces may inject primary organic particles into the fine fraction. Such mechanism can contribute to the formation of submicron organic particles over high biologically productive oceanic waters (O’Dowd et al., 2004).
SOA in contrast is mainly formed by gas-to-particle conversion processes such as nucleation, condensation and heterogeneous and multiphase chemical reactions (Hallquist et al., 2009). Reactive volatile organic compounds (VOCs) are precursors for SOA. VOCs have been studied as major air pollutants and for their role in tropospheric ozone formation since 1950s (Pitts and Stephens, 1978). However, most low-molecular weight reactive VOCs contributing to ozone formation do not take part substantially in SOA production. Generally, SOA formation yields increase with the molecular weight of parent VOC. For instance, monoterpenes (C10) produce more SOA per unit of VOC mass compared to isoprene (C5), and less than sesquiterpenes (C15). SOA can be generated in the atmosphere also by chemical transformation (aging) of primary components in the condensed phase.
Global SOA estimations are extremely variable between assessments (Table 1.1). Therefore, constraining the global SOA budget is considered a hot topic in the atmospheric chemistry community (Nozière et al., 2015). The relative contribution of POA and SOA to the overall OA budget and the determination of their main sources remain a highly debated issue due to the persistent discrepancies between measured OA concentrations and the predictions of atmospheric chemistry models that often show an underestimation of the ambient concentrations.
16
Compounds Concentrations (Tg yr-1) Reference
Biogenic SOAs 270
Andrea, Crutzen et al., (1997)
Biogenic SOAs 13-24 Griffin et al., (1999)
Global biogenic emissions 491-1150 Guenther et al., (1995) Annual biogenic SOA formation 61-79 Kanakidou et al., (2000) VOCs isoprene and terpens 12-70 Kanakidou et al., (2005)
Isoprene 10-120 Matsunaga et al., (2005)
Terpenes 725 Lathiére et al., (2006)
Terpene oxidation 19 Griffin et al., (1999)
Total organic carbon 69 Liousse et al., (1996)
Total black carbon 12 Liousse et al., (1996)
Total sea salt 5900 Tegen et al. (1997)
Soil dust <1µm 250 Tegen and Fung (1995)
Soil dust <10µm 1000 Tegen and Fung (1995)
Total sulfate (as H2SO4) 150 Chin and Jacob (1996)
Biogenic sulfate 32 Koch et al., (1999)
Anthropogenic sulfate 111 Koch et al., (1999)
Nitrate 11,3 Adams et al., (1999)
Ammonium 33,6 Adams et al., (1999)
Table 1.1. A summary of global generated rates of particles into the atmosphere.
Despite the high organic content of aerosol particles, the knowledge about the actual OA sources is still limited: as a matter of fact, the huge complexity of the molecular composition of OA (Shimmo et al., 2004) challenges the resolution of modern analytical techniques and poses limits to the accuracy of OA source apportionment. Moreover, the organic composition of atmospheric particles is highly dynamic in nature, and very much dependent on atmospheric conditions, and this makes the characterization of OA even more challenging because it requires analytical techniques with an adequate time resolution of the measurement (Robinson et al., 2007; Hallquist et al., 2009; Jimenez et al., 2009).
Improving our knowledge on the sources and transformation mechanisms of POA and SOA by means of modern analytical techniques is crucial for developing strategies of reduction and mitigation of OA adverse effects on the environment and on human health.
17
1.5 ENVIRONMENTAL IMPACTS OF ATMOSPHERIC AEROSOLS
Air pollution is a very important environmental and social issue in both industrialized and developing countries. Air pollutants are emitted from anthropogenic sources, but it should be noted that harmful substances can be emitted or produced also by natural sources (e.g., volcanic SO2, biogenic precursors of ozone and particulate matter). In turn, biogenic aerosol concentrations are affected by human-driven changes in the photochemistry and in the climate conditions. Air pollutants exert diverse impacts on human health, ecosystems, the built environment and on the climate system. Long-living pollutants are transported or formed over long distances (100 to more than 1000 km) and affect vast geographical areas. Effective measures for improving air quality require a good understanding of the full atmospheric life cycle of air pollutants (EEA, 2016).
1.5.1 AEROSOL AND HEALTH – EUROPEAN AIR QUALITY
The emission reduction adopted in Europe in the last 20 years have significantly improved air quality, and for certain pollutants like SO2, exceedances of European threshold limits are rare. However, substantial challenges remain for ozone, nitrogen dioxide and especially particulate matter. A large proportion of European populations and ecosystems are still exposed to air pollution that exceeds European standards: approximately 85% of EU population was exposed to concentrations exceeding the stricter World Health Organization (WHO) Air Quality Guidelines (AQGs) value for PM2.5 in 2014 (EEA, 2016; http://www.euro.who.int/en/publications/abstracts/air-quality-guidelines-for-europe). Estimates of the health impacts attributable to exposure to air pollution indicate that PM2.5 concentrations in 2013 were responsible for about 467 000 premature deaths originating from long-term exposure in Europe (over 41 countries), of which around 436 000 were in the EU‑28 (see Figure 1.5). The estimated impacts on the population in the same 41 European countries of exposure to NO2 and O3 concentrations in 2013 were around 71 000 and 17 000 premature deaths per year, respectively, and in the EU‑28 around 68 000 and 16 000 premature deaths per year, respectively. Effective air-quality policies require action and cooperation at global, European, national and local levels, which must reach across most economic sectors and engage the public. Holistic solutions involving technological development, and structural and behavioural changes, must be pursued. In order to support economic prosperity, human well-being and social development, these policies are required and are part of the EU’s 2050 vision (EEA, 2016).
Over the last three decades, EU policies have resulted in decreased emissions of air pollutants and noticeable improvements in air quality. This European policy is in line with other international instruments and conventions. Furthermore, national, regional and local authorities play a very
18
important role not only in implementing EU legislation but also in adopting additional measures to reduce emissions and further protect their populations and the environment from the impacts of air pollution. (EEA, 2016). Significant decreasing trends in the PM10 annual mean were found in 2000– 2014 for 75% of a consistent set of European stations. Similarly, PM2.5 concentrations, on average, tended to decrease between 2006 and 2014 for all station types. In fact, on 2014, the number of EU Member States with concentrations above the air‑quality standards was lower than in 2013, as was the case for the urban population exposed to levels above those standards. However, current trends indicate that there will still be exceedances in 2020.
Numerous epidemiological studies show that fine air particulate matter and traffic-related air pollution are correlated with severe health effects, including enhanced mortality, cardiovascular, respiratory, and allergic diseases (Bernstein et al. 2004; Gauderman et al., 2004; Katsouyanni et al.,2001; Pope et al., 2004; Samet et al., 2005). Moreover, toxicological investigations in vivo and in vitro have demonstrated substantial pulmonary toxicity of model and real environmental aerosol particles, but the biochemical mechanisms and molecular processes that cause the toxicological effects such as oxidative stress and inflammatory response have not yet been resolved. Among the parameters and components potentially relevant for aerosol health effects are the specific surface, transition metals, and organic compounds (Bernstein et al. 2004; Bömmel et al., 2003; Donaldson et al., 2003).
Ultrafine particles (Da<100 nm) are suspected to be particularly hazardous to human health, because they are sufficiently small to penetrate the membranes of the respiratory tract and enter the blood circulation or be transported along olfactory nerves into the brain (Oberdorster et al. 2004; Nemmar et al., 2002; Oberorster et al., 2005). Neither for ultrafine nor for larger aerosol particles, however, it is clear which physical and chemical properties actually determine their adverse health effects (particle size, structure, number, mass concentration, solubility, chemical composition, and individual components, etc.).
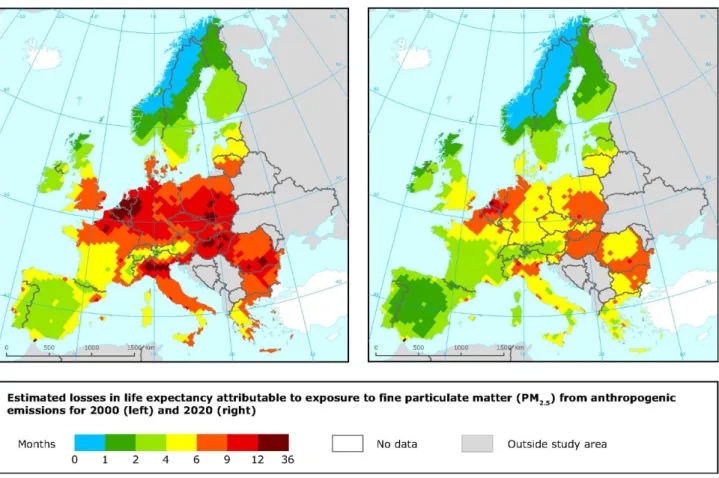
19
Figure 1.5. Health impact of PM mass concentrations (µg/m3). Loss in statistical life expectancy (months) that can be attributed to anthropogenic contributions to PM2.5 for the year 2000 (left) and for 2020 (right) for the CAFE baseline scenario. http://www.eea.europa.eu/data-and-
maps/figures/health-impact-of-pm-mass-concentrations-g-m3-loss-in-statistical-life- expectancy-months-that-can-be-attributed-to-anthropogenic-contributions-to-pm2-5-for-the-year-2000-left-and-for-2020-right-for-the-cafe-baseline-scenario
1.5.2 AEROSOL AND CLIMATE: IPCC REPORT
The most comprehensive and recent review about climate change and human impacts on the climate system is the Fifth Assessment Report (AR5) written and published by the Intergovernmental Panel on Climate Change (IPCC) in 2013. IPCC is the international panel of experts for assessing the state of the science of climate change. The IPCC was set up in 1988 by the World Meteorological Organization (WMO) and United Nations Environment Programme (UNEP) to provide policymakers with regular assessments of the scientific basis of climate change, its impacts and future risks, and options for adaptation and mitigation. At the end of 2007, the IPCC was awarded the Nobel Peace Prize (IPCC, 2013).
20
Climate change poses increasingly severe risks for ecosystems, human health and the economy. According to a European Environment Agency report published at the end of January 2017, land and sea temperatures are increasing; precipitation patterns are changing, generally making wet regions in Europe wetter, particularly in winter, and dry regions drier, particularly in summer; sea ice extent, glacier volume and snow cover are decreasing; sea level is rising; and climate-related extremes such as heat waves, heavy precipitation and droughts are increasing in frequency and intensity in many regions. (EEA, 2016).
The Mediterranean Sea region, home to around 480 million people living across 3 continents was identified as one of the main climate change hotspots (i.e. one of the areas most responsive to climate change) due to water scarcity, concentration of economic activities in coastal areas, and reliance on climate-sensitive agriculture (IPCC, 2013). The IPCC temperature projections show a probably increasing of 4-5°C for the end of the century for some Mediterranean areas.
The IPCC reports examine a full set of anthropogenic atmospheric compounds impacting the Earth’s radiative budget. Beside CO2, which is the main anthropogenic green-house gas (GHG) and it is not a pollutant, there are also several air pollutants which are also climate forcers, with a potential impact on climate and global warming especially in the short term (i.e. years to decades). Air pollution and climate change are therefore intertwined. Specifically, the climate impact of atmospheric aerosols arises from their ability to reflect solar radiation back to space and from their ability to act as cloud condensation nuclei (CCN). An increased CCN concentrations means higher cloud droplet number, hence higher cloud top reflectivity (higher cloud albedo), but also less probability of precipitation and longer cloud lifetime and increased cloud fraction (Seinfield and Pandis 2006; IPCC, 2013).
In order to quantify the global warming by the change in Earth’s energy balance, the concept of “radiative forcing” (RF) is normally used to quantify the radiative effect of an augmented concentration of atmospheric gases of aerosol due to anthropogenic activities. RF is expressed in Watts per square meter (Wm–2).
According to IPCC, there is very high confidence that the total anthropogenic RF increase rate since 1960 has been much greater than during earlier industrial-era periods, driven primarily by the continuous increase in concentrations. There is still low agreement among scientists on the time evolution of the total aerosol RF, which is the primary factor for the uncertainty in the total anthropogenic forcing. However, there is a high confidence that aerosols have offset a substantial portion of GHG forcing, despite the large uncertainty ranges on aerosol forcing.
Forcing can also be attributed to emissions rather than to the resulting concentration changes (Figure 1.6).
21
Carbon dioxide is the largest single contributor to historical RF from either the perspective of changes in the atmospheric concentration of CO2 or the impact of changes in net emissions of CO2. The relative importance of other forcing agents can vary markedly with the perspective chosen, however. Tropospheric O3 and black carbon (BC) are examples of air pollutants that are short-lived climate forcers and that contribute directly to global warming. Other PM components, such as organic carbon (OC), ammonium (NH4+), sulfate (SO42–) and nitrate (NO3–), have a cooling effect. In addition, changes in weather patterns due to climate change may change the transport, dispersion, deposition and formation of air pollutants in the atmosphere. For example, a warmer climate leads to an increase of O3 production at the ground level, and increased O3 levels then contribute to more warming. In order to reduce health and ecosystem impacts and cope with the climate change, BC emissions must be cut, along with those of other pollutants that cause tropospheric O3 formation, such as methane (CH4) (itself a greenhouse gas).
Air quality and climate change should therefore be tackled together by policies and measures that have been developed through an integrated approach. Examples are the impact on air quality from the large support via taxation of diesel cars (with lower carbon dioxide (CO2) emissions), or from the increased use of biomass combustion without adequate emission controls (EEA, 2016).
22
Figure 1.6: Radiative forcing of climate change during the industrial era shown by emitted components from 1750 to 2011. The horizontal bars indicate the overall uncertainty, while the vertical bars are for the individual components (vertical bar lengths proportional to the relative uncertainty, with a total length equal to the bar width for a ±50% uncertainty). Best estimates for the totals and individual components (from left to right) of the response are given in the right column. Values are RF except for the ERF of aerosol-cloud interactions (ERFaci). An additional rapid adjustment to aerosol-radiation interactions of –0.1 [–0.3 to +0.1] W m–2 is attributable primarily to black carbon. CFCs = Chlorofluorocarbons, HCFCs = Hydrochlorofluorocarbons, HFCs = Hydrofluorocarbons, PFCs = Perfluorocarbons, NMVOC = Non-Methane Volatile Organic Compounds, BC = Black Carbon. (IPCC, 2013).
Atmospheric scientific research is not the only way to approach the issue of air pollution and climate change. The European Union, by EIT (European Institute of Innovation and Technology), founded Climate-KIC, the EU’s largest public private partnership addressing climate change through innovation to build a zero carbon economy. It addresses climate change across four priority themes: urban areas, land use, production systems, climate metrics and finance. Education is at the heart of these themes to inspire and empower the next generation of climate leaders. It runs programmes for students, start-ups and innovators across Europe via centers in major cities, convening a community of the best people and organizations. The approach starts with improving the way people live in cities. The focus on industry creates the products required for a better living environment, and it look to optimize land use to produce the food people need (http://www.climate-kic.org/). During my PhD I followed several Climate-KIC educational activities, as The Journey, the most important summer school about climate change and business, and then I started to be involved in Climate-KIC Alumni activities, organizing meetings and workshop in that topic.
1.6 MEASUREMENT TECHNIQUES FOR ORGANIC AEROSOLS
1.6.1 INTRODUCTION
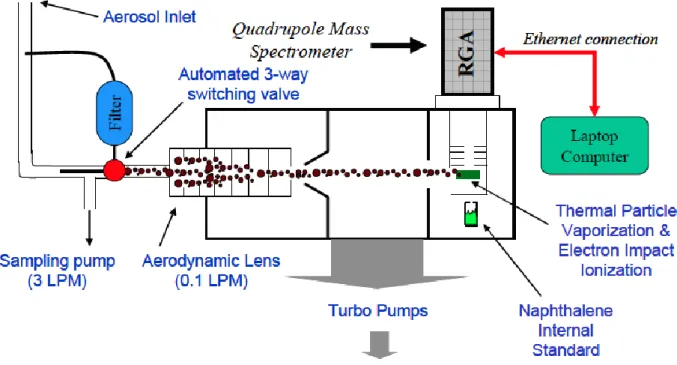
The determination of organic aerosol (OA) composition encompasses a wide range of analytical techniques, whose characteristics and applications are summarized by some recent review papers (McMurry, 2000; Hoffmann and Warnke, 2007; Rudich et al., 2007; Nozière et al., 2015). Here, some of the most recent advancements in OA and SOA analysis treated by the work of Hallquist et al. (2009) and Nozière et al. (2015) are summarized. A focus on the main techniques employed in this study, i.e. proton-nuclear magnetic resonance spectroscopy (1H-NMR) and aerosol chemical speciation monitor (ACSM) is given.
23
One of the main limitations to complete characterization of OA, and especially SOA, is the sheer number of individual molecular species present. Most of the OA mass is accounted for by complex mixtures of compounds, including many isomeric forms, and each occurring in very low concentrations. The recovery of particulate compound measurements with respect to total organic carbon varies dramatically between techniques: the methods for individual compounds analysis cannot cope with the full molecular complexity of the samples and generally exhibits low recoveries (≤10%), while spectroscopic methods for functional group determination provide a more complete analysis, because for the same chemical composition the number of functionalities is much smaller than the number of individual compounds.
The methods for OA chemical analysis are generally classified into off-line and on-line techniques. Off-line techniques, e.g., gas chromatography/mass spectrometry (GC/MS), liquid chromatography/MS (LC/MS), nuclear magnetic resonance (NMR) and Fourier transform infrared (FTIR) spectroscopy, provide detailed information on individual chemical species or functional groups in OA but generally require large amounts of sample, resulting in low time resolution of sampling (several hours to days) and low aerosol size resolution. On-line techniques (e.g., aerosol mass spectrometry, AMS) usually provide less specific information on composition (with respect to chromatographic techniques), i.e., some level of chemical characterization with less details on individual species, but have the advantage of fast acquisition times, providing near real-time data. Figure 1.7 highlights how some of the most important techniques suitable for field applications compare in respect to completeness, chemical resolution, and time/size resolution.
24
Figure 1.7. Summary of the most abundant analytical techniques used to characterize atmospheric organic compounds as function of their I factor, defined as the capability to determine molecular structure of a compound (= number of possible molecules which cannot be resolved by a given analytical techniques from the molecule of interest). A decreasing I factor describes the increasing ability of a technique to identify the molecular structure of a compound. The Y axis describes the fraction of the total organic mass of atmospheric samples characterized by a technique. The coupling of two techniques (often involving chromatography) significantly decreases the I factor. Techniques frequently coupled to chromatography or suitable to coupling with chromatography are shown in blue, the other in red. (Nozière et al., 2015).
As described above, techniques that provide molecular speciation, represented by GC/MS in the figure, can only do so for a small mass fraction of the OA (of the order of 10%) present in ambient aerosol. Time resolution is typically of many hours although automatic GC/MS systems for semicontinuous measurements, increasing time resolution up to 1 h, are now available (Williams et al., 2006, 2007). Improvements in this type of speciation techniques are highly desirable and are being actively pursued (e.g. Goldstein et al., 2008) but it is very unlikely that in the foreseeable future a single technique will provide full quantitative speciation of OA with a high time resolution.
25
Spectroscopic techniques, like AMS, FTIR and NMR, can be employed to improve completeness of analysis by exploiting their selectivity to specific chemical classes or functional groups. Mass spectrometric methods, like AMS, benefit of a much higher time and size resolution respect to the other techniques (e.g. DeCarlo et al., 2008) and are suitable for on-line elemental analysis (Aiken et al., 2008). Conversely, FTIR and NMR analysis can be carried out at a reduced time resolution but the resulting spectral data provide a much clearer information on functional group distribution with respect to AMS (e.g. Maria et al., 2003; Decesari et al., 2007).
In conclusion, a perfect field instrument does not exist, and at present a combination of techniques is required for a more complete characterization of OA and in particular of SOA.
1.6.2 OFF-LINE TECHNIQUES
Off-line techniques typically consist in distinct steps: aerosol sampling, laboratory workup and analysis.
1.6.2.1 Aerosol sampling
Sampling is the first step of the characterization of compounds and the choice of sample collection, preparation methods and appropriate analytical techniques can be crucial for their identification (Nozière et al., 2015). Sampling of particulate organic material (organic aerosols) is generally accomplished by collection on filter samplers or, to a lesser extent, with cascade impactors (e.g., MOUDI; DLPI, www. dekati.com) (Barro et al., 2009). The choice of the filter material on which the samples are collected is critical. When the samples have to be analyzed by thermal-optical analysis for total organic, elemental, and total carbon (OC, EC, and TC), quartz-fiber filters are mandatory because they are the only type able to sustain high-temperature treatments. Otherwise, other materials can also be used, for example, polytetrafluoroethylene (Teflon), or aluminum foil in cascade impactors. However, they all give rise to artifacts. In particular, all filter types can result in negative artifacts as the particulate-phase organics collected on the filter may volatilize during sampling. Quartz fiber filters are more prone to positive rather than negative artifacts because of their large adsorption capacity for volatile and semivolatile organic compounds (Turpin et al., 2000; Gelencsér et al., 2004; Mikuska et al., 2009).
Sample preparation
The off-line analysis of OA is performed in laboratory using aerosol samples collected onto filters followed by standard solvent extraction (Cheng and Li, 2004), supercritical fluid extraction (Chiappini et al., 2006) or thermal desorption (Greaves et al., 1985; Veltkamp et al.,1996). A range
26
of solvents and pre-treatments of the analytes can be used, including chemical derivatization, to increase the range of species analyzed. The specific solvent is often used as an empirical definition for fractions of aerosol organic carbon e.g., the “water-soluble organic carbon” (WSOC).
Thermal desorption has gained increasing popularity over the last few years for the measurement of semivolatile, thermally stable organic aerosol components and can be used without any sample preparation when combined with high resolution chromatographic techniques (Hays and Lavrich, 2007).
Solvent extraction or thermal desorption methods allow to extract the majority of particulate organic compounds from the sample, though rarely > 80%, but the real bottleneck in the analysis is the recovery and resolution of the chromatographic techniques. Because of the tremendous molecular complexity, the majority of organic compounds elute as an “unresolved complex mixture” (e.g., Williams et al., 2007).
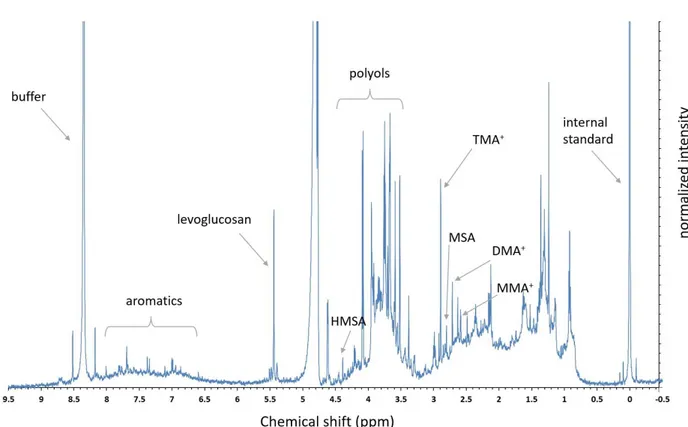
Semi-preparative ion-exchange chromatography was to separate WSOC fractions prior to proton NMR analysis (Decesari et al., 2000, 2001). This method allowed the characterization of polycarboxylic acids, including high-molecular weight compounds. The NMR spectra of aerosol polyacids were found to be similar to those characteristic of terrestrial fulvic acids, for example Suwannee River fulvic acid (SRFA, Cappiello et al., 2003). Standards of fulvic acids were often used as surrogates for ambient aerosol in studies of physicochemical properties (Parsons et al., 2004; Topping et al., 2005; Dinar et al., 2006).
1.6.2.3 Off-line molecular speciation methods
There are several atmospheric problems requiring the identification of specific organic compounds. An example is the quantification of the SOA mass resulting from one specific precursor, such as isoprene or α-pinene, at a given site. The approach usually employed consists of monitoring a few compounds that are unique to these processes or sources, called “markers” (Nozière et al., 2015). The identification of appropriate marker compounds for specific atmospheric processes is a difficult task due to the wide range of complexity and concentrations encountered in smog chamber and atmospheric samples. Important quality criteria for suitable marker compounds are reactivity, stability, and, for condensed-phase compounds, volatility.
The identification and quantification of specific molecular markers for SOA from different precursors are essential for the accurate assessment of their impacts in source apportionment studies. In addition, molecular speciation provides fundamental insights into SOA source processes, that is, the chemical reactions leading to their formation. Furthermore, molecular markers can serve as a “clock” for measuring the OA aging state. A summary of the main classes for molecular markers for POA and
27
SOA is provided below. I focused on polar compounds, which are the object of this thesis work. Therefore, tracer compounds for POA are presented only for biomass burning, which produces a range of oxidized organic compounds, while POA from fossil fuel combustion, being mainly apolar in nature, are not considered in this short review.
Molecular speciation activities started in the late 1990s for monoterpene SOA, (Glasius et al., 2000; Christoffersen et al., 1998; Yu et al., 1999) and much later for isoprene SOA, that is, after 2004 following the discovery of the 2-methyltetrols in atmospheric aerosol (Claeys et al, 2004). During the past two decades, substantial progress has been made with the structural elucidation of biogenic SOA markers.
Here an update will be given for markers related to isoprene and α-pinene, and information for markers related to other selected biogenic VOCs (“BVOCs”). In recent years, improved mechanistic insights have been obtained about the formation of isoprene markers under different experimental (smog chamber) conditions. As explained previously, the 2-methyltetrols, their corresponding sulfate esters, and the C5-alkene triols are generated by the condensed-phase reactions of the C5-epoxydiols produced in the gas-phase from isoprene photooxidation under low-NOx conditions (Paulot et al., 2009). In polluted areas (high-NOx conditions), 2-methylglyceric acid and its corresponding sulfate ester are preferentially formed. NOx-reach atmospheres also lead to the formation of organonitrates, which can subsequently partition to the particle phase and undergo a nucleophilic substitution with water or sulfate (Szmigielski et al., 2010; Darer et al., 2011). Isoprene SOA-related organosulfates identified in ambient fine aerosol include sulfate esters of 3,4-dihydroxybutan-2-one, glycolic acid, 1-hydroxy-3-oxobutane, and hydroxyacetone. As explained in the previous section, their formation, as well as the sulfate ester of 2-methylglyceric acid, was explained by multiphase reactions involving either sulfuric acid or the sulfate radical anion (Schindelka et al., 2013; Galloway et al., 2009; Wang et al., 2013).
Despite the fact that molecular speciation of monoterpene SOA already started in the late 1990s, significant progress has only been made in the past decade with a much more complete molecular speciation of α-pinene SOA and insights into their formation processes. A marker that has received particular attention is 3-methyl-1,2,3-butanetricarboxylic acid, which is now established as a suitable marker for aged α-pinene SOA (Müller et al., 2012). Other novel markers that were structurally characterized include 3-hydroxyglutaric acid, the lactone-containing terpenoic acids, terpenylic acid, terebic acid, 2-hydroxyterpenylic acid, 4-hydroxyterpenylic acid, and diaterpenylic acid acetate (Nozière et al., 2015). Furthermore, high-MW dimers have received attention and have been structurally identified and detected in ambient fine aerosol with the two most prominent ones being diesters with MW 368 and 358 (Yasmeen et al., 2010; Hoffmann et al., 1998; Muller et al., 2008;
28
Gao et al., 2010; Kristensen et al., 2014) The MW 368 dimer was shown to consist of a pinyl and a hydroxypinonyl monomeric unit, while the MW 358 dimer was found to comprise a pinyl and a diaterpenyl residue (Yasmeen et al., 2010; Gao et al., 2010). Dimers form through ozonolysis in the gas phase the possible involvement of Criegee intermediates (Kristensen et al., 2014). The exact formation mechanism of high-MW dimers warrants further investigation as they are implied in new particle formation.
Organosulfates related to α-pinene detected in ambient fine aerosol include sulfate esters of 2- and 3-hydroxyglutaric acid, hydroxypinonic acid, and isomeric MW 295 nitrooxy organosulfates with a pinane diol skeleton (Surratt et al., 2008). Nitrooxy organosulfates determined in ambient aerosol during intensive field campaigns were shown to form at night-time, in absence of photochemistry (Gomez-Gonzalez et al., 2012) and mediated by NO3* radical chemistry. Furthermore, they were also detected in significant concentrations in wintertime in areas impacted by wood burning (Kahnt et al., 2013).
Biomass burning aerosols originate from anthropogenic and natural combustion such as wild fires, agricultural fires, deforestation fires, and residential biomass combustion for cooking and heating. Carbonaceous aerosols from biomass burning are of scientific and public interest because of their occurrence in local, regional, and global environments as well as their impact on human health, air quality, visibility, and climate. Globally, biomass burning is one of the major sources of primary organic aerosols, light absorbing carbon (brown and black carbon), and probably also of SOA (Grieshop et al., 2009). Among biomass burning polar marker compounds, the pyrolysis products of cellulose and hemicelluloses are the most important class of compounds in biomass burning smoke. Cellulose is a macromolecule consisting of several to ten thousand linearly linked D-glucopyranose units, whereas hemicelluloses are smaller macromolecules that contain different monosaccharidic (e.g., mannose and galactose residues) but mainly D-glucopyranose units. Cellulose and hemicelluloses provide a supporting mesh for wood structures and account for 30−40% of woody tissue (Shafizadeh, 1984). The major pyrolysis products of cellulose and hemicelluloses are anhydromonosaccharides, levoglucosan anhydro-β-D-glucopyranose), galactosan (1,6-anhydro-β-Dgalactopyranose), and mannosan (1,6-anhydro-β-D-mannopyranose), and they are widely used as biomass burning marker compounds because they are specific and emitted in considerable amounts (Hornig et al., 1985; Locker et al., 1988; Simoneit et al., 1999).
Another class of polar biomass burning marker compounds is the pyrolysis products of lignin. Lignin is an amorphous biopolymer synthesized by monolignols and accounts for 25−35% of the dry mass of softwood and 18−25% of hardwoods. Its function is to provide strength and rigidity to plant structures (Shafizadeh, 1984; Parham et al., 1984). Its pyrolysis produces mostly substituted phenols
29
and substituted methoxyphenols with predominantly p-coumaryl alcohol derivatives from grass combustion, pconiferyl alcohol derivatives from softwood combustion, and sinapyl alcohol derivatives from hardwood combustion. This difference may be used as an indicator for the influence of soft or hardwood combustion in ambient aerosols (Hawthorne e al., 1988).
The characterization of individual aerosol markers in highly complex mixtures generally requires chromatographic separation. The two most employed techniques are GC, often with derivatization before the separation, and HPLC. The selection of a chromatographic column is crucial in the development of a suitable analytical method and must consider the chemical and physical properties of the analytes (volatility, polarity, molecular weight, solubility, etc.). In particular, if the polarities of the stationary phase and of the analyte are similar, their attractive forces are strong and result in a better retention (compound appearing late in the chromatograms). The selectivity and resolution of a column are determined by the intermolecular forces between the stationary phase and the target molecules, including van der Waals, hydrogen bonding, and dipole−dipole interactions (Nozière et al., 2015).
When compounds that are not volatile enough or thermally too labile to pass through the injector and/or the column, derivatization procedures can be applied to the samples before their GC analysis. The procedure consist in reacting the analyte with a derivatization reagent, such as 2,4-dinitrophenylhydrazine, the specific compounds obtained can afterwards be observed by the detector, such as characteristic ions when using mass spectrometric detection (Yu et al., 1998; Edney et al., 2003).
Ion chromatography (IC) offers a simple, reliable, and inexpensive separation and determination for organic ions in complex aerosol mixtures, it is also usually the first choice for the determination of low-MW organic acids in atmospheric aerosols and aqueous (cloud, fog, rain) samples. Ion exchange and ion exclusion are the two possible mechanisms for the IC separation. The former is typically used for polar organic compounds such as low-MW dicarboxylic acids, while the latter is generally applied to less polar organics such as weak acids (Tsai et al., 2008; Fischer et al., 2002; Domingos et al., 2012; Iinuma et al., 2009).
The atmospheric organic compounds identified by IC include water-soluble low-MW organic acids in aerosols, the most common being monocarboxylic (i.e., formic, acetic, pyruvic, and glyoxylic acids), dicarboxylic (i.e., oxalic, succinic, fumaric, malic, tartaric, glutaric, maleic, malonic, α-ketoglutaric, and oxaloacetic acids), and tricarboxylic acids (i.e., citric and cisaconitic acids) (Tsai et al., 2008; Domingos et al., 2012). Some aromatic acids (i.e., phthalic, syringic, 3-hydroxybenzoic, 4-hydroxybenzoic, vanillic, and isovanillic acid) have also been identified in aerosol particles from
30
smoke samples, and methanesulfonic and methanesulfinic acids both in ambient aerosols and in chamber studies (Facchini et al., 2008; Chen et al., 2012).
UV−vis spectroscopy is not specific and provides mostly bond/functional group identification (I ≥ 100), its coupling to liquid chromatography greatly improves the level of identification by adding information on retention times and the possibility to compare with reference standards. One of the important applications of HPLC−UV to organic aerosols is the determination of toxic compounds such as polycyclic aromatic hydrocarbons (PAHs) range, but with a poorer sensitivity compared to GC/MS methods (Nozière et al., 2015).
Tandem mass spectrometry (MS/MS or MSn) is widely applied to obtain structural information about organic molecules. The technique is used to produce structural information about a compound by fragmenting its molecular ion inside the mass spectrometer and identifying the resulting product ions. Selected/multiple reaction monitoring is particularly useful to confirm the identity of compounds in atmospheric samples. An example is the detection of carboxylic acids and of nitro-aromatic marker compounds used as biomass burning markers (Kitanovski et al., 2012). This scanning mode is not only highly specific but also highly sensitive. Tandem MS techniques used in combination with LC are very advanced analytical tools for both the detection and the detailed mass spectrometric characterization of organic compounds in complex atmospheric samples (Nozière et al., 2015).
1.6.2.4 Off-line functional group analysis
Functional group analysis using spectroscopic techniques can be used to reduce the complexity of the analysis and improve recovery. The most popular application among the off-line methods is the collection of aerosol on impactors or filters followed by analysis by FTIR spectroscopy to determine the concentration of organic functional groups such as saturated aliphatic (C-C-H), unsaturated aliphatic (C=C-H), aromatic (C=C-H), organosulfur (C-O-S), carbonyl (C=O), organic hydroxyl (COH), etc. (Blando et al., 1998; Havers et al., 1998; Maria et al., 2003; Polidori et al., 2008). The strength of this technique is the ability to measure the total concentrations of certain functional groups, such as amines or organosulfur species, which are difficult to quantify with alternative methods. FTIR spectroscopic analysis was applied during many field campaigns (e.g. Maria et al., 2003; Polidori et al., 2008; Russell et al., 2009). Maria et al. (2003) used aerosol concentrators to obtain sub-1 h time resolution for employ onboard a research aircraft. The OA concentration determined by FTIR spectroscopy showed good agreement with co-located AMS measurements in several studies (Gilardoni et al., 2007; Russell et al., 2009). Sequential solvent rinsing can be used to further separate the organic compounds by polarity (Maria et al., 2003; Polidori et al., 2008). The organic matter to organic carbon (OM/OC) ratio can also be estimated from these measurements