2 INDEX INDEX. 2 Abstract. 7 Abbreviations. 10 Figures. 14 Tables 15 CHAPTER 1- INTRODUCTION. 1.1 HEMATOPOIETIC MALIGNANCIES. 18
1.2 DIAGNOSIS OF LYMPHOPROLIFERATIVE DISORDERS. 20
1.2.1 ROUTINE LYMPHOMA DIAGNOSTICS. 20
1.2.2 IMMUNOPHENOTYPING. 21
1.2.3 CLONALITY ASSAYS. 23
1.3 AIMS OF THE STUDY. 34
CHAPTER 2- OPTIMISATION OF THE DNA EXTRACTION TECHNIQUES. 2.1 INTRODUCTION. 37
2.2 MATERIALS AND METHODS. 39
2.2.1 EDTA BLOOD SAMPLES. 39
2.2.1.1 Case Selection. 40
2.2.1.2 Protocols. 41
2.2.1.2.1 Gene Elute Mammalian Genomic DNA Miniprep Kit (Sigma). 41
2.2.1.2.2 QIAmp Mini and Blood Kit (Protocol QA). 41
2.2.1.2.3 Optimised Protocols (Protocols QB, QC, S). 42
2.2.2 CYTOLOGICAL SLIDES. 46
2.2.2.1 Case Selection. 46
3
2.2.2.2.1 Manufacturer’s Instructions. 48
2.2.2.2.2 Protocol from Roy- Chowdhury et al. (2016) 48
2.2.2.2.3 Protocol from Killian et al. (2010) 48
2.2.3 DNA QUALITY ASSESSMENT. 49
2.2.3.1 Spectrophotometry. 49
2.2.3.2 Polymerase Chain Reaction (PCR). 50
2.2.4 STATISTICAL ANALYSIS. 52
2.3 RESULTS. 52
2.3.1 Extraction from EDTA Blood Samples. 52
2.3.2 Extraction from Cytological Slides. 56
2.4 DISCUSSION. 58
2.5 CONCLUSIONS. 59
CHAPTER 3- ESTABLISHMENT OF FELINE POSITIVE CONTROLS. 3.1 INTRODUCTION. 62
3.2 MATERIALS AND METHODS. 62
3.2.1 Case Selection. 62
3.2.2 DNA Extraction. 63
3.2.3 DNA Quality Assessment. 64
3.2.4 Polymerase Chain Reaction (PCR) 65
3.2.4.1 Primer sets. 65
3.2.4.2 Reaction Settings. 66
3.2.4.3 Cycling Protocols. 68
3.2.5 VISUALISATION OF PCR PRODUCTS. 68
3.2.5.1 Agarose Gel Electrophoresis. 68
3.2.5.2 Polyacrylamide Gel Electrophoresis (PAGE). 69
3.3 RESULTS. 71
4
3.5 CONCLUSIONS. 75
CHAPTER 4- CANINE CLONALITY ASSAYS. 4.1 AIMS OF THE STUDY. 78
4.2 MATERIALS AND METHODS. 78
4.2.1 Case Selection. 78
4.2.2 Flow Cytometry. 79
4.2.3. Clonality Assay. 82
4.2.3.1 DNA Extraction. 82
4.2.3.2 DNA Quality Assessment. 84
4.2.3.3 PCR for Antigen Receptor Rearrangement (PARR). 86
4.2.3.4 Visualisation of PCR products. 89
4.3 RESULTS. 90
4.3.1 CASE DESCRIPTION. 90
4.3.2 IMMUNOPHENOTYPE. 92
4.3.2.1 T-ALL: Acute Lymphocytic Leukaemia of T- cell origin. 92
4.3.2.2 AUL: Acute Undifferentiated Leukaemia. 92
4.3.2.3 B-ALL: Acute Lymphocytic Leukaemia of B- cell origin. 93
4.3.2.4 Aberrant Phenotype. 93
4.3.2.5 T-CLL: Chronic Lymphocytic Leukaemia of T- cell origin. 93
4.3.2.6 AML: Acute Myeloid Leukaemia. 94
4.3.3 EXTRACTION DATA AND DNA ASSESSMENT. 96
4.3.4 PARR RESULTS. 98
4.3.4.1 Rearrangement of TCRG locus. 98
4.3.4.2 Rearrangement of IGH locus. 98
4.3.5 FLOW-CYTOMETRY VS PARR. 100
4.4 DISCUSSION. 104
5
CHAPTER 5- FELINE CLONALITY ASSAY.
5.1 AIMS OF THE STUDY. 117
5.2 MATERIALS AND METHODS. 118
5.2.1 Case Selection. 118
5.2.1.b Flow Cytometery Immunophenotyping. 119
5.2.2 Clonality Assay. 120
5.2.2.1 DNA Extraction. 120
5.2.2.2 DNA Quality Assessment. 121
5.2.2.3 PCR for Antigen Receptor Rearrangement (PARR). 122
5.2.2.4 Visualisation of PCR products. 126
5.2.2.4.1 Agarose Gel Electrophoresis. 126
5.2.2.4.2 Polyacrylamide Gel Electrophoresis (PAGE). 127
5.2.2.4.3 Capillary Electrophoresis (CE). 128
5.3 RESULTS. 130
5.3.1 EXTRACTION DATA. 130
5.3.2 CASE DESCRIPTION. 131
5.3.3 PARR RESULTS. 134
5.3.3.1 Rearrangement of TCRG locus. 134
5.3.3.1.1 Agarose Gel Electrophoresis. 134
5.3.3.1.2 Polyacrylamide Gel Electrophoresis (PAGE). 134
5.3.3.1.3 Capillary Electrophoresis (CE). 135
5.3.3.2 Rearrangement of IGH locus. 137
5.3.3.2.1 Agarose Gel Electrophoresis. 137
5.3.3.2.2 Polyacrylamide Gel Electrophoresis (PAGE). 138
5.3.3.2.3 Capillary Electrophoresis (CE). 142
5.3.4 COMPARISON OF THE ELECTROPHORESIS TECHNIQUES. 144
5.3.5 ADDITIONAL ANALYSIS. 146
6
5.4 DISCUSSION. 154
5.5 CONCLUSIONS. 164
References. 167
7
Abstract
This thesis is a retrospective study on canine and feline lymphoproliferative diseases advanced diagnostic techniques. In particular, we focus our attention on immunophenotyping by Flow Cytometry (FC) and clonality assays, comparing the diagnostic sensitivity and specificity of the latter in the course of canine leukaemias and feline lymphoproliferative diseases.
In Chapter 1, an overview of lymphoproliferative diseases was given: the importance of immunophenotyping in the classification of such diseases, and its prognostic value have been well established in the last decade of research. However, immunophenotype is still unable to distinguish in some cases between reactive and neoplastic disorders, making clonality assays a useful, complementary tool in the diagnostic process. PCR for antigen receptor rearrangement (PARR) is a molecular biology technique aimed to amplify receptor genes which are clonally rearranged in the course of a clonal neoplastic expansion. Due to the potential application of PARR to many kinds of source material and due to the significant advantages offered by FC as a secure, cost and time effective technique, we believe that FC and PARR could be a valid alternative to the more expensive and complicated biopsy with histology and immunohistochemistry, which to date is considered the gold standard in lymphoproliferative diseases diagnostics.
In Chapter 2, we optimised the protocols for extraction of sufficient DNA from our samples: due to the retrospective nature of our study, we believed that having optimised protocols using the minimum volumes of source material possible with the best performances, could be useful for our purposes. We optimised protocols for whole EDTA blood (used in Chapter 4 for the canine clonality assays) and cytological slides (used in Chapter 5 for the feline clonality assay). The first experiments on blood were performed using two kits (GenElute Mammalian Genomic DNA Miniprep Kit by Sigma Aldrich and the QIAMP Mini and Blood kit from Qiagen): we selected the Sigma kit protocol using as source material sample volumes containing a white blood cell count (WBC) of 9x10⁶/mL and optimising the elution step. Extraction from cytological slides was optimised combining three protocols and creating a new original one, with optimised cell lysis and elution steps. The protocols developed were used for further experiments in the succeeding chapters.
8
In Chapter 3 we established feline positive controls as internal controls for the following experiments run in Chapter 5. We selected four feline patients, diagnosed with lymphoma by histology and immunophenotyped by IHC. After extraction of DNA from FFPE tissue samples, we performed PARR using the primer set intended to be used in the following experiments in order to select the samples which were positive to the single primers. Due to the immunophenotype and the positive clonal amplification of the TCRG gene, one sample was selected as a positive control for T cell clonality. One other patient was selected, according to the same criterion, as positive control for B cell clonality testing. However, DNA obtained from two feline lymphoma cell lines (MS-4 and FT-1, for B and T cell clonality respectively) were used in the present study along with our established positive controls.
In Chapter 4 the value of PARR in comparison with FC in the course of canine leukaemias was investigated. Twenty-nine cases were selected: of those, nineteen were diagnosed with leukaemia, and ten showed a raised WBC attributable to infection or immune-stimulation. The first group comprised: eight dogs diagnosed with T-ALL (of which, one was showing evidence of LGL leukaemia), four AUL, three B-ALL, two biphenotypic leukaemias, one T-CLL and one AML. PARR was performed using two primers directed to the TCRG locus, and two directed to the IGH gene. Separation and visualisation of PCR products were performed by Agarose gel electrophoresis. Overall sensitivity and specificity of clonality testing using FC as gold standard were 73% and 100% respectively. Neoplasia was detected in approximately 63% of the neoplastic cases diagnosed by FC; all the non-neoplastic cases were confirmed as reactive by PARR. PARR confirmed phenotype in 50% of the cases of B and T cell neoplasia; moreover, two AUL was diagnosed as T cell neoplasia, and the double phenotypic leukaemias clonally rearranged just the TCRG locus. However neoplasia was not detected in high rates, and cell lineage did not match between the two techniques in many cases: for this reason, PARR should not be considered as a diagnostic tool by itself but has to be always integrated into a more comprehensive diagnostic process.
9
In Chapter 5, clonality testing was performed on feline lymphoma/leukaemia and reactive lymphoproliferative disorders samples. Of the thirty-seven cases retrieved from the Dick White Referrals (DWR) laboratory archive, only twenty-one cases provided sufficient amounts of good quality DNA from the cytological slides available. Thirteen cases were diagnosed as having neoplasia (seven T cell neoplasia and six B cell neoplasia), in the peripheral blood (four cases), affecting the gastrointestinal tract (four cases), or peripheral lymphnodes (three cases) or other locations (two cases). Five cases were diagnosed as having a reactive process. In three cases a clear-cut distinction between neoplasia and reactive hyperplasia was not possible by the FC analysis only. Clonality testing was performed using a primer set comprising one primer directed to the TCRG locus and five primers directed to the IGH gene. Agarose, PAGE and capillary electrophoresis (CE) were performed and compared. If DNA was available for the reactive cases, detection of IGH gene rearrangement was performed using additional primers. Clonality testing on our feline case series showed an overall sensitivity and specificity of 63.6% and 100% respectively, and neoplasia was detected in 42,5% of the cases of neoplasia diagnosed by FC. PAGE and CE showed a good concordance, but CE has to be preferred especially in ambiguous cases where a clonal population is present within a polyclonal background. Our results showed the potential of PARR in refining the diagnosis of lymphoma achieved by FC, but highlights as well the weakness of the technique in terms of low sensitivity, possibly due to incomplete gene coverage of the primers used. Moreover, it confirmed the importance of using high resolution and highly sensitive techniques for visualisation of PCR products, such as automated capillary electrophoresis.
10 Abbreviations. A: Adenine. A230: Absorbance at 230nm wavelength. A260/230: A260/ A230 ratio. A260/280: A260/ A280 ratio. A260: Absorbance at 260nm wavelength. A280: Absorbance at 280nm wavelength. AL: Alimentary Lymphoma.
ALL: Acute Lymphoblastic Leukemia. AML: Acute Myeloid Leukaemia. APC: Antigens Presenting Cells. AR: Antigen Receptor.
AUL: Acute Undifferentiated Leukaemia. B-CLL: B cell Chronic Lymphocytic Leukaemia BCR: B-cell Receptor.
BSA: Bovine Serum Albumin.
Bp: Base Pair.
C-: Constant Region of the AR genes. C: Cytosine.
CBC: Complete Blood Count. CD: Cluster of Differentiation.
CDR: Complementary Determining Regions. CE: Capillary Electrophoresis.
CKCS: Cavalier King Charles Spaniel. CLL: Chronic Lymphocytic Leukemia. CRP: C Reactive Protein.
11 D-:Diversity Region of the AR genes.
DLH: Domestic Long Hair. DNA: Deoxyribonucleic Acid dNTP: DeoxynucleotideTriphosphate DSH: Domestic Short Hair.
DTT: Dithiothreitol.
EDTA: Ethylene Diamine Tetraacetic Acid. Fab: Fragment Antigen binding region. FAB: French American British. fAR: feline Androgen Receptor. FC: Flow Cytometry.
FELV: Feline Leukaemia Virus.
FFPE: Formalin Fixed Paraffine Embedded. FNA: Fine Needle Aspiration.
FR: Framework Regions. G: guanine.
gDNA: genomic DNA Hb: Haemoglobin. HCT: Haematocrit.
HRM: High Resolution Melting (analysis). ICC: Immunocytochemistry.
Ig: Immunoglobulin.
IGH: Immunoglobulin Heavy chain. IGHJ: J- region of the IGH.
IGH-V: V- region of the IGH. IHC: Immunohistochemistry.
12
J-: Joining region of the AR genes. JRT: Jack Russell Terrier.
LGL: Large Granular Lymphocytes.
LGL-CLL: Large Granular Lymphocyte- Chronic Lymphocytic Leukaemia. LMP: low melting point.
MHC: Major Histocompatibility Complex. MRD: Minimal Residual Disease.
NCIWF: National Cancer Institute Working Formulation. NGS: Next Generation Sequencing.
NHL: Non-Hodgkin’s Lymphoma. NK: Natural Killer (cells).
NTC: Non-Template negative Control.
ORF: Open Reading Frame.
PAGE: Polyacrylamide Gel Electrophoresis. PARR: PCR for Antigen Receptor Rearrangement. PBS: Phosphate-buffered saline solution.
PCR: Polymerase Chain Reaction. RBC: Red Blood Cell Count.
REAL: Revised European American Lymphoma (classification). RES: Reticuloendothelial System.
RNA: Ribonucleic Acid.
RQ-PCR: Real-time Quantitative PCR. RT: Room Temperature.
SB: Southern Blot (analysis). SDS: Sodium Dodecyl Sulfate. SHM: Somatic Hypermutation.
13
T: Thymine
TAE: Tris-Acetate EDTA (buffer).
T-ALL: T cell Acute Lymphocytic Leukaemia. TBE: Tris-Borate EDTA (buffer).
T-CLL: T cell Chronic Lymphocytic Leukaemia. TCR: T cell receptors.
TCRG: locus of the TCR gene econding for the γ chain. UV: Ultra-Violet.
V-: Variable region of the AR genes.
WBC: White Blood Cell Count. WHO: World Health Organization.
14
Figures.
Figure 1. T cell receptor structure (αβ phenotype). 28
Figure 2. Canine TCRG locus. 30
Figure 3. Schematic representation of the 5’ end of Feline TRG cDNA. 30
Figure 4. Immunoglobulin structure. 31
Figure. 5. The canine immunoglobulin heavy chain locus. 32
Figure. 6. Examples of cellularity and macroscopic appearance of the slides selected. 47
Figure 7. Gel Scans for canine Ckit (A) and feline AR (B) genes. 53
Figure 8. Comparison of means of concentration obtained using different protocols. 55
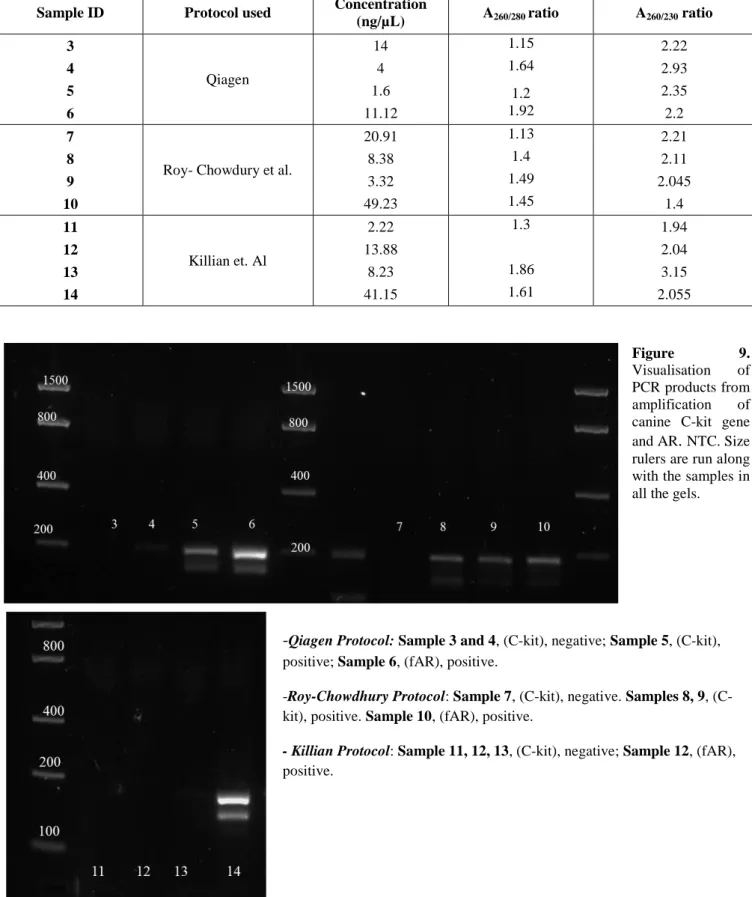
Figure 9. Gel Scans of canine C-kit gene and feline AR after DNA extraction using different protocols. 57
Figure 10. Gel Scans of PCR amplicons in Feline Positive controls establishment. 73
Figure 11. Example of a Flow Cytometry scatterplot. 80
Figure 12. Examples of agarose gels for visualisations of canine PCR products. 99
Figure 13. Agarose gel scans for visualisation of feline TCRG. 136
Figure 14. PAGE scans for visualisation of feline TCRG. 136
Figure 15. Electropherograms from CE for visualisation of feline TCRG. 136
Figure 16. Agarose gel and PAGE scans for visualisation of feline IGH obtained by V3F3 and IgH3 primers. 139
Figure 17. Electropherograms from CE for visualisation of feline IGH obtained by V3F3 and IgH3primers. 140-141 Figure 18. Agarose gel, PAGE gel scans and electropherograms for visualisation of feline IGH obtained by multiplex V1F2/V3F4 reaction. 143
Figure 19. Additional CE analysis for visualisation of feline IGH rearrangements carried out for sample 34. 147-148 Figure 20. Additional CE analysis for visualisation of feline TCR rearrangement carried out for sample 33. 149
Figure 21. Additional CE analysis for visualisation of feline TCR rearrangement carried out for sample 15. 150
15
Tables.
Table 1. Data from Group 1 of patients submitted to different DNA extraction protocols. 43
Table 2. Data from Group 2 of patients submitted to different DNA extraction protocols. 44-45 Table 3. Data from cytological slides submitted to different DNA extraction protocols. 47
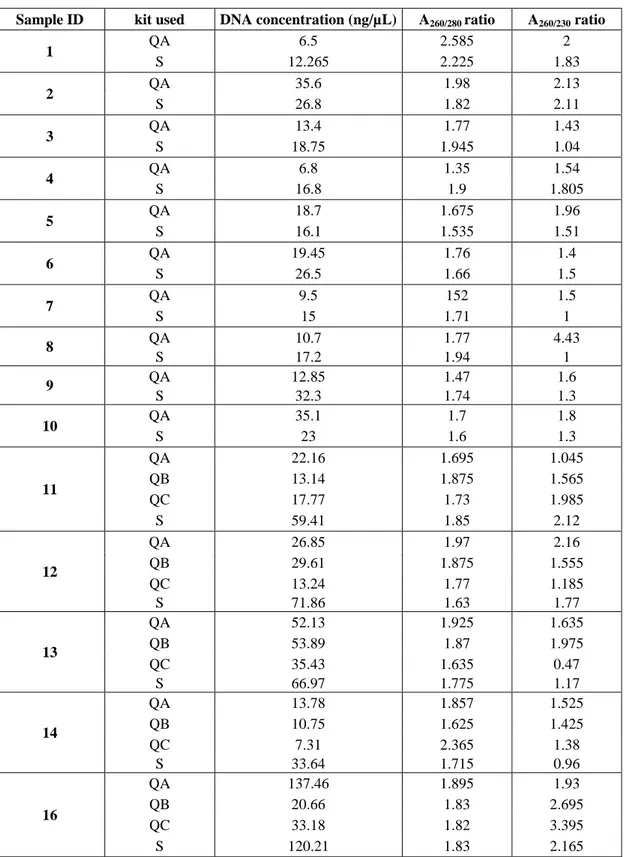
Table 4. Extraction data of EDTA blood samples submitted to different DNA extraction protocols. 54-55 Table 5. Extraction data of cytological slides submitted to different DNA extraction protocols. 57
Table 6. Primer set used for standard PCR amplification of feline TCRG and IGH loci. 67
Table 7. Extraction data from the four cases selected as feline positive controls. 71
Table 8. Monoclonal Antibodies (Mab) panel used in the study for Flow Cytometry. 81
Table 9. Information about canine EDTA blood samples enrolled in the study. 83
Table 10. Primer sets used for amplification of canine TCRG and IGH. 87
Table 11. Results from FC analysis of the canine patients enrolled in the study. 95
Table 12. Extraction data of the canine patients enrolled in the study. 97
Table 13. PARR results and comparison to FC of the canine patients enrolled in the study. 102
Table 14. Primers used for additional PCR amplification of the feline IGH. 124
Table 15. Data about the twenty-two feline samples enrolled in the study. 133
Table 16. Comparison of the three electrophoresis methods used for visualisation of feline amplicons. 145
Table 17. PARR results and comparison to FC of the canine patients enrolled in the study. 152
Supplementary information Table 1S. Signalment, FC results and clinical presentation of dogs affected by leukaemia. 182
Table 2S. Haematological findings of dogs affected by leukaemia. 183
Table 3S. Signalment and haematological findings of dogs affected by reactive leucocytosis. 184
17
CHAPTER 1:
INTRODUCTION
18 Lymphoid proliferative diseases are described as a subset of conditions affecting the reticuloendothelial system (RES)1. The distinction between malignant proliferation and benign reactive processes is crucial: in the first event, the uncontrolled proliferation is driven by mutations which evade the cell lifespan control mechanism; the second condition is consequent to immune stimulation, caused by external agents (bacterial, viral, parasitic, allergenic agents) or auto-immune stimuli.
1.1 HEMATOPOIETIC MALIGNANCIES.
A general valid distinction between hematopoietic malignancies is that “malignancy in a
largely undifferentiated lymphocyte is likely to occur in the marrow of a young individual and present as leukaemia, and malignancy in a mature lymphocyte will likely occur in the peripheral tissues of a mature individual and present as lymphoma.”1. In
fact, if one considers bone marrow as the most affected organ, with the presence of >20% of malignant cells, the diagnosis of Acute Lymphoblastic Leukaemia (ALL) can be achieved; Moreover, Chronic Lymphocytic Leukaemia (CLL) is defined as the presence of small mature lymphocytes in high numbers in the peripheral blood, making leukaemias a disease of bone marrow and blood. Conversely, lymphoma is characterised by the proliferation of malignant cells mostly present in the lymph nodes and/or other tissues. However this distinction is not so sharp: for example, ALL can involve secondary hematopoietic organs; or in the case of both Stage V lymphoma and CLL, circulating malignant cells can be detected, and secondary involvement of lymph nodes and/ or spleen can be present, making the distinction challenging1.
In general, lymphomas represent a diverse group of diseases, which vary in microscopic appearance (architecture, cellular morphology) and behaviour, with a different rate of dissemination and progression and the potential for involvement of any location.
Lymphomas are amongst the most common types of tumours in dogs and cats2. There are remarkable similarities between the clinical features of canine lymphomas and human Non-Hodgkin’s Lymphoma (NHL)3. The disease can be classified according to the anatomical localisation of the neoplastic cells; multicentric, alimentary, mediastinal,
19
or extranodal forms have been recognized in both dogs and cats, but the anatomical distribution seems to follow different rules in the two species. The most common type in the dogs is the multicentric2, but this localisation appears to be rarer in the feline counterpart. In fact, it has been reported that Alimentary lymphoma (AL) is the most common form in the cat4–7, especially in the post FeLV infection and current vaccination era8. Clinical staging of lymphoma accounts for five different stages depending on the localisation of the neoplasia and two substages according to clinical presentation9. Stage10 and substage have been found to be directly linked to survival in the cat6,11. Classification criteria for lymphomas rely on human guidelines because lymphoproliferative diseases in animals tend to mimic in appearance and behaviour the human counterpart12. Therefore human classifications have been applied in Veterinary Medicine. Consensus guidelines for diagnosis and classification are now mandatory in Veterinary Medicine to assist the best management of the disease and provide prognostic information.
Different classification schemes have been successfully applied to feline and canine lymphoproliferative diseases13. The Kiel classification (first proposed in 1974, then revised in the Updated Kiel classification in 1988 and 1990)14 has been successfully adapted to feline and canine lymphoid cancers15,16 and distinguishes subtypes according to the immunophenotype of the cells and the grade (low/high), correlating cell morphology. More recently, the Revised European American Lymphoma (REAL) and the World Health Organization (WHO) classifications have been established. They both combine tumour cell morphology, immunophenotype, genetic features and clinical manifestations, but they do not classify the neoplasia through the high/low-grade approach13. Moreover, the WHO classification covers all the hematopoietic malignancies regardless of their origin. These classifications have been both successfully applied to companion animals7,17. Another classification scheme is the National Cancer Institute Working Formulation (NCIWF)18–21, which is based on histopathologic features and identifies three subgroups (low, intermediate and high grade); it appears to be predictive of the biological behaviour. Furthermore,e the “French American British” (FAB) scheme
20 has been used in Human Medicine22,23 and Veterinary Medicine24,25 for classification of acute leukaemias, which distinguishes lymphoid and myeloid lineages not only according to cell morphology but also according to immunological features.
1.2. DIAGNOSIS OF LYMPHOPROLIFERATIVE DISORDERS.
1.2.1. ROUTINE LYMPHOMA DIAGNOSTICS.
While histopathological analysis and immunohistochemistry have been suggested to be the gold standard diagnostic tools in such malignancies26–28, cytology is often used as a fast, cost-effective tool to aid the diagnosis of lymphoma. Histology has the great advantage of giving the architecture of the lesion and the degree of cell proliferation and surrounding tissue invasion. Nevertheless, the acquisition of tissue samples, other than being an expensive and invasive procedure requiring general anaesthesia, can be difficult especially for some anatomical forms such as intestinal lymphoma, where biopsies are mostly taken endoscopically and often limited to the mucosa. Such specimens are often not sufficient to give a complete picture of the disease. Moreover, preparation of tissue samples requires longer times and more equipment than cytology, which is an easy technique performable even in small practices. Cytology, however, has its drawbacks, with a high risk of missing the neoplastic cells within a vast lesion and not giving any information on the architecture of the lesion. Moreover, despite the pathologist’s or clinical pathologist’s experience, identification of neoplastic cells (especially for indolent diseases, early stages of disease or presence of a residual population of normal lymphocytes) can be challenging. In addition, a morphological assessment with routine staining techniques only is nowadays considered insufficient to detect the cell lineage, especially if the distinction between myeloid vs lymphoid diseases is required.
However, cytology is considered sufficient for a first assessment of non-Hodgkin’s lymphomas, and it is considered a valid diagnostic technique especially if coupled with immunophenotyping by flow cytometry29–31. Its usefulness has also been shown in veterinary medicine for refining lymphoma diagnosis32,33.
21
1.2.2. IMMUNOPHENOTYPING.
Most of the classification schemes in use nowadays in Veterinary Medicine, consider the cell lineage as a discriminatory criterion between subtypes. The classifications nowadays applied to companion animals lymphoid leukaemias, in fact, distinguish between B and T cell diseases, and seems that phenotype, together with other variables, such as the anatomical location, histological and clinical grade, is related to survival time34. Moreover, FAB classification applied to Veterinary myeloid leukaemias distinguishes the different entities by cellular origin.
Immunophenotyping allows the detection of polypeptides ordinarily present on cell membranes or in the cytoplasm, the so-called “cluster of differentiation” (CD), by the use of a panel of monoclonal antibodies, which selectively label these proteins. If the pattern of expression is homogeneous within the lesion, a diagnosis of neoplasia can be achieved. Expression of a specific CD or of a combination of more CDs by the cells allows the recognition of the cell lineage. In the course of neoplasia, cells can increase or lose CD expression, or show aberrant patterns35. Any type of source material can be virtually submitted to immunophenotyping: tissue samples (immunohistochemistry, IHC), cytological preparations (immunocytochemistry, ICC), or cell suspensions (flow cytometry- FC).
The first two techniques (IHC and ICC) show a limited antibodies availability. Routine differentiation between B and T cell malignancies, in fact, is made upon positivity to CD79a and CD3 respectively21,36. Flow cytometry indeed offers a more extensive antibody panel, allowing better characterisation of the neoplasia37,38 than cytology or histology, even if combined with ICC or IHC respectively. For example, a routine diagnostic panel for leukaemias in dogs using FC includes from 12 -17 mAbs (Table 8). Moreover, FC allows to combine information about immunophenotype and morphological cellular features, such as size and cytoplasmic complexity, providing precise identification of the cell line. In particular, the hallmarks of FC in lymphoproliferative diseases are 1) detection of clonality which enables identification of
22
the ongoing neoplastic process 2) identification of lineage or lineage infidelity, possibly with higher sensitivity than IHC, given the broader panel of antibodies 3) detection of maturation stage and consequently biological behaviour. It has been described how cells with “blastic” features (such as expression of the marker CD34) tend to have higher proliferation rates and more aggressive behaviours39–41.
Cytometers have traditionally been used to define different cell populations in blood, based on light scatter properties: flow cytometry adds to the ability to measure the physical characteristic of the cells, the detection of CD expression pattern by the use of fluorescently labelled antibodies. In fact, the cells examined are redistributed into a laminar flow and are individually passed through a laser beam. The light scattered forward and the light scattered on the sides of the cell allows determination of the size and the internal complexity of the cell respectively. Moreover, the fluorescent labels (fluorochromes) bound to the antibodies, are excited by the light beam, and detectors collect emitted light and then digitally converted. The use of different fluorochromes with similar excitation wavelengths but different emission wavelengths enables the simultaneous detection of the various CDs, giving a better characterisation of the phenotype.
Combined information about size, cytoplasmic complexity and CD pattern expression, detected homogeneously in the sample, aids the diagnosis of lymphoma/ leukaemia, which cannot, in any circumstances be used alone, disregarding clinical information and morphological assessment by cytology.
However, Flow Cytometry is an easy and fast procedure which provides cost-effective results in a couple of hours. It applies to any cell suspension, from blood and cavitary fluids to FNA samples, which can be processed after stabilisation in medium (usually buffered culture medium with serum or albumin37). A minimum number of 2 million cells have to be contained in the sample to achieve good results and application of a complete panel of antibodies. Moreover, the specimen has to be fresh (possibly analysed within 48h from collection33,42), thus representing one of the limitations of the technique, as fast and correct shipment of samples cannot always be possible.
23
In the dog, immunophenotype has been demonstrated to be a significant prognostic factor. Despite B cell lymphomas being reported as having a better prognosis20,43–46, low-grade T cell lymphomas are considered to be mostly indolent; high-low-grade T cell lymphomas are indeed the most aggressive with short survival times45. The opposite results have been shown in the course of chronic lymphocytic leukaemia, with T-CLL having a better course than B-CLL, but atypical CLL has an aggressive behaviour with a poorer prognosis. The role of immunophenotype in acute leukaemias has not been demonstrated in the canine species47. However other contributors were involved in survival prediction. In the dog extranodal forms of lymphoma seem to have longer survivals and a less aggressive course than the multicentric type48. This is true also for the cat patients, with alimentary and renal lymphomas carrying the worst prognosis49–52. In one study on the cat, T small cell lymphomas were proven to be the most common type of treated alimentary lymphoma, with longer survival and good remission rates53. Nonetheless, a clear correlation between phenotype and prognosis in felines has not been proven to date10,34,52,54, probably due to the lack of antibodies available and validated for this species.
1.2.3. CLONALITY ASSAYS.
In the case of indolent forms of lymphomas or profound reactive hyperplasia, the distinction between reactive and neoplastic conditions is not so evident. Some features observed in the course of Large Granular Lymphocytes (LGL) leukaemia, for example, can overlap some other findings during infectious diseases55. Moreover, inflammatory bowel disease and intestinal lymphomas (especially the indolent forms), can be virtually indistinguishable by cytology and histology, even if assisted by immunophenotyping.56 Clonality is a hallmark of neoplasia: according to the somatic mutation theory of carcinogenesis, spontaneous mutations are responsible for tumour development and are clonally transmitted during malignant proliferation. The detection of a genetically homogeneous population is the principle of clonality testing and the distinguishing criterion between reactive and neoplastic lesions.
24
In lymphoproliferative disorders, the targets of clonality detection are the Antigen Receptors (AR) genes: these genes, under physiologic conditions, drive the synthesis of the membrane-bound ARs: Immunoglobulins (Ig) on the surface of B lymphocytes (chief representatives and effectors of humoral immune response) and T cell receptors (TCR), expressed by T lymphocytes (a significant component of cell-mediated immunity). The ARs are highly diverse within a normal lymphocyte population: this fact assures the ability of recognition of a wide variety of antigens. Diversity in Ig or TCR
structure is estimated to be in the order of 1012, making the event of two lymphocytes carrying the same receptor very unlikely57. The high genetic diversity is assured by the recombination and random joining of the regions composing the Ig and TCR genes, namely the Variable (V), Joining (J) constant ( C) and Diversity (D) regions. In the first instance, the joining process starts with the D-J conjunction, followed by the attachment of the V region. For those genes not containing the D sequence, the process involves VJ joining only. The last step is the (D)J-V joining to the C region. This mechanism potentially leads to a vast number of possible recombinations, which results in a wide receptor structure diversity, reflecting the high recognition and antigen-binding potential. Variety is also enhanced by random nucleotides insertion and deletion, as well as point mutations occurring between the joined regions. Moreover, some genes contain more than one C regions which can also undergo rearrangement. Additionally, antigenic stimulation provokes somatic hypermutation in B cell Receptor (BCR) genes, with insertion of point mutations all along the Immunoglobulin Heavy chain (IGH) gene.58 Conversely compared to a diverse, mixed lymphocyte population, a neoplastic population will show a restricted genetic pattern, given the fact that all the cells are identical clones of each other.
Clonality testing in Veterinary Medicine has been of interest in the last decade, representing an adjunctive tool in refining diagnosis of lymphoproliferative diseases, especially in the more controversial cases. These tests have been directed to amplification and detection of AR genes, and the molecular assays available vary in
25
design and complexity and include Southern blot (SB) analysis, Polymerase chain reaction (PCR), and real-time quantitative PCR (RQ-PCR).
Southern blot analysis has been used with success in a few reported studies in Veterinary Medicine59,60. Although there are excellent specificity and sensitivity of the assay, it presents many limitations, mainly technical. First of all, it is a time-consuming technique, requiring around seven days for sample processing and result interpretation; moreover, it needs fresh samples of good quality, precluding application to the fixed or archived material. Finally, it has a low analytical sensitivity, since it is unable to detect a small proportion of monoclonal cells mixed in an extensive background of normal polyclonal lymphocytes61. Finally, a significant limitation of the conventional Southern Blotting technique is its inability to detect gene rearrangements at much below the 5% level62.
Conversely, the popularity of Polymerase Chain Reaction (PCR) in routine diagnostics has arisen due to the versatility of the technique. It can be applied to fresh, frozen or fixed tissue; to archived samples such as formalin fixed- paraffin embedded (FFPE) tissue or stained cytological slides; to fluids and cell pellets obtained from fine needle aspiration (FNA). DNA can be extracted from virtually any source matrix, making PCR for antigen receptor rearrangement (PARR) a useful and convenient technique to be used in the Veterinary diagnostics routine. After DNA extraction, the PCR-based amplification is performed using a set of primers, to detect and amplify the AR genes. The amplified products are then separated by electrophoresis: the first studies reported Agarose gel electrophoresis as suitable for visualisation of prominent bands in the case of neoplasia, but this method has been replaced by higher resolution techniques such as polyacrylamide gel electrophoresis (PAGE). Nowadays, automated capillary electrophoresis (CE) is considered the best method for clonality detection27, and interpretation of results has been standardised by the EuroClonality/ BIOMED-2 guidelines applied to Veterinary clonality assays58,63
26
To date, the primers designed in the dog and the cat are directed to the TCRG locus (encoding for the γ chain of the TCR) and the IGH locus (encoding for the Heavy chain of the membrane-bound immunoglobulin).
However, PARR is a sophisticated technique: it requires basic molecular biology and genetics knowledge, and special precautions are needed during sample processing and interpretation. This technique albeit useful and full of potential is not an easy technique and has many limitations.
First of all, incomplete gene coverage by the primers in use can occur: to enable the highest efficiency possible, many studies have been carried out in both canine and feline lymphoproliferative diseases. These studies provided the primers now routinely used in diagnostics.
In the dog, the first approaches to clonality assays date back to the last years of the nineties, when the pioneers Vernau and Moore (1999) designed primers directed to the canine TCRG locus39. Years later, Burnett e al.(2003), developed a new primer set for amplification of canine TCRG and Ig genes64: namely two primers for B cell (IgH major and IgH minor) and one for T cell clonality detection. Primer design was implemented after the publication of the canine genome65,66 when more accurate sequences alignment was possible. New primers were designed by a Japanese research group67,68, and other groups69–71. In the last few decades, Keller et al.(2012) have improved the assay, developing a multiplex PCR detecting a more extensive range of rearrangements for TCRG72 even if more than one reorganisation per allele is present, resulting in increased sensitivity.
Knowledge of feline primers and clonality assays is more limited than in the canine counterpart. A first effort to define and detect the feline IGH gene was made in 2005 by Werner et al.73 In this study analysis of twenty-four transcripts obtained from normal feline splenic lymphocytes allowed the description of the IgM locus and the design of primers for B cell clonality assessment. The target of the experiment was the Framework Region (FR) 2 and the FR3 of the IGH gene. Two consensus forward primers placed into
27
the V region (IGHV) and three antisense primers (in the J segment) were outlined. Nevertheless, no clan/family association could be assessed at that stage. Later on, Heinrich et al.74 grouped feline IgH genes into two families (IGH1 and IGH3) and the sequences obtained by Werner some year before could be placed into the family IGH3. This study designed two pairs of primers directed to FR1 and FR3 of both gene families. The TCRG locus was widely described by Weiss et al.75, and a primer set was designed76. Ultimately, the Japanese group of Mochizuki et al. obtained other sequences both for the feline IGH gene and the TCRG, designing a wider primer set than the existing ones77,78, designed for multiplex reactions, thus improving sensitivity and specificity.
To date, feline PARR has a maximum sensitivity of 91% for TRG clonal rearrangement detection (ranging from 46% to 91% within three different published primer sets )73,76,78 and of 89% (ranging from 64 to 89%)74,77 in B cell clonality assays.
As a more extensive primer set is available for diagnostics and research in the canine species: B cell clonality assays have shown high sensitivity (ranging from 80% to 98%)70,79 and specificity (99%)80. PARR has detected lymphomas/ leukaemias of T-cell lineage with a specificity of 86-98%70,80and a sensitivity improved to 100% in some studies81, which make this method of interest to most clinical-pathology laboratories. The variable sensitivity and specificity rates are due to a plethora of reasons, mainly involving the difficulties in primer design and complete gene coverage, as
aforementioned, mainly due to the lack of knowledge in the genomic structure of TCR and Ig structure and encoding genes.
28
To date, the TCR has been described as a polypeptide bound to the surface of T lymphocytes. It is associated with CD3, forming the TCR-CD3 complex (Figure 1); it represents the primary effector of cell-mediated immune response, with its exclusive ability in recognising foreign molecules only if presented by antigen presenting cells (APC) through the major histocompatibility complex (MHC) molecules. The receptor is composed of four polypeptide chains, responsible for the αβ or the γδ phenotype.
In humans, dogs and cats the predominant phenotype of circulating T cells is αβ
phenotype, whereas a small percentage expresses the γδ heterodimer82. The γδ lymphocytes have been reported to be present in skin, lungs, intestine and reproductive organs lining epithelium83, to recognise antigen, not MHC bound and also to act as antigen presenting cells65,83, representing the link between innate and adaptive immunity.
Each αβ or γδ chain is composed of a Variable domain (V), a constant domain (C), a transmembrane region and a cytoplasmatic termination. Each chain is encoded in a distinct locus within the chromosome (the α chain in TCRA locus, the β in TCRB, the γ in TCRG and the δ in TCRD). The locus comprises different segments which, in turn, encode for the single domains: thus,
variable domain is encoded by the Variable (V-) segment, joined to the constant domain encoded by constant (C-) region by peptide encoded by Joining (J-) region. Diversity in some phenotypes is additionally enhanced by the presence of a Diversity (D) sequence (not present in TCRG locus). TCR structure is illustrated in Figure 182.
29 Despite the final phenotype, the first locus rearranged during T cell development is the TCRD, followed by TCRG locus. The lymphocyte can afterwards maintain the γδ phenotype or can proceed to TCRA rearrangement first, and consequently of TCRB locus, achieving the αβ phenotype84
. Nonetheless, the TCRG is retained despite the phenotype, representing a reasonable target for the clonality assay. Moreover, the organisation of canine TCRG in multiple cassettes gives more chances for the designed primers to cover more than one of all the possible rearrangements85. For these reasons, TCRG is the primary target of PARR.
With an approximate extension of about 500kb, the canine TCRG gene is located on chromosome 18. The different regions are grouped in eight cassettes aligned in tandem and divided one from another by a 10-18 bp space (except the area between cassettes 6 and 7, which is slightly larger). A total of 40 regions (8 TCRG-C, 16 TCRG-V and 16 TCRG-J) are diversely combined throughout the loci and not all the genes are functional. The V domains (target of amplification in clonality assays) comprise three Complementarity-determining region (CDR) intercut with four FR, similar to IgV gene86. Eight out of sixteen V segments are pseudogenes: the remainder assigns to 4 subgroups: TCRV2 (comprising four genes), TCRV4 and TCRV5 with one gene each and TCRV-7 with two genes. Within the J regions, seven are functional while seven are pseudogenes and two are Open Reading Frames (ORF). Six out of eight constant genes are functional, whereas TCRC1 is an ORF and TCRC6 is a pseudogene. The canine TCRG locus is illustrated in Figure 2.
The feline TCRG gene is located on chromosome 8. It comprises, similar to the dog different , J-, C- regions, differently situated throughout the locus (Figure 3). Eight V-regions have been described so far: of these five seem to be functional and were divided into three subgroups: subgroup one consisted of three members (V1, V2, V3)75,87, while subset 2 and 3 included one each (V4 and V5 respectively). the remaining three V sequences are likely pseudogenes and show high homology to the V4 sequences (V4.1P, V4.2P, V4.3P)88. J regions described so far have been attributed to three subgroups, with five members (J 1.1, J 1.2, J 1.3, J 1.4, J 1.5) in the first, two in the second (J2.1, J2.2)88
30
with one probably a pseudogene and one in the third (J3)75. An additional J region not attributable to any subgroup has been described, thus representing a pseudogene75. Finally, six feline C- regions of TCRG locus have been described (C 1, C 2, C 3, C4, C5, C6)75.
Similar to the dog, each feline TCRG gene comprises three CDRs intercut with four FRs (Figure 3).
Figure 2. Canine TCRG locus86
Figure 3. Schematic representation of the 5’ end of Feline TRG cDNA as retrieved from Weiss et al.
(2008)75. L, Leader sequence; FR, framework region; CDR, complementary determining region; V, variable region; N, n region; J, joining region; C, constant region.
31
Membrane Immunoglobulins (Ig) are antigen receptors expressed by B lymphocyte membranes, and the primary effectors of humoral immunity, which they can initiate without antigen presentation by other cells. These molecules are part of the antigen receptor complex in conjunction with Igα (CD79a) and Igβ (CD 79b). The structure comprises two Heavy chains (H) and two light chains (either κ or λ chain) encoded by IGH and IGK/IGL genes respectively. The heavy chain defines immunoglobulin class: in the case of membrane Ig, the presence of IgHµ or IgHδ determines either IgM or IgD subtype respectively89. Recognition and binding of antigens rely on the Fragment Antigen binding (Fab) region, composed of a variable (Fv) and a constant (Fb) segment of both heavy and light chains, similar to the TCR variable and constant domain respectively, and as well is encoded by genomic V and C regions. The V region is composed of four different conserved Framework Regions (FR1, FR2, FR3, FR4) intercut with three hypervariable complementary regions (CDR1, CDR2, CDR3)90. Immunoglobulin structure is illustrated in Figure 4.
The canine IGH gene has been extensively described. It is located on chromosome 8 and spans approximately 1400 kilobases (kb)66. The locus consists of four IGH-V genes families (for a total of 89 genes, of which 36 are functional), six IGH-D genes and six IGH-J genes organised in as many sets, and IGH.C genes. The locus is represented in Figure 586.
The full-length sequences of feline genes encoding for immunoglobulin heavy chains have not been thoroughly characterised. The V sequences have been so far ascribed to two subgroups, IGH1 and IGH391. In humans, the highest number of V genes are part of
32
the IgH3 family followed by the IgH192. This rule seems to be observed in the cat genome as well.74
33
Knowledge on genetic structure is crucial in primer design. However, additional difficulties in PARR design other than the complexity of the AR genes, are the potential mutations occurring at primer binding sites. This is a frequent event especially in B cell lymphomas: B lymphocytes after antigen stimulation undergo additional mutations (somatic hypermutation).58 In Human Medicine, it has been suggested as a possible cause of amplification lack in translocation during B cell lineage maturation, and to avoid this inconvenience it has been proposed to correlate standard primer sets directed to IGH genes, with supplementary primer sets directed to other targets (such as IGK).63 It is clear how an essential percentage of rearrangements is still likely not to be detected, due to the presence of unidentified VH and JH segments. The design of primers should be as broad as possible as it is crucial to avoid possible false-negative results.
False positive results can occur as well. If every neoplasm is clonal, not all clonal populations are neoplastic. It has been reported how some non-neoplastic diseases can yield a clonal population when analysed by molecular assays. Chronic infections such as canine Ehrlichiosis or Leishmaniasis or other vector-borne diseases37, or other conditions93 can stimulate a single or a few lymphocyte subclasses, giving a few clonal peaks that can lead to misdiagnosis of a reactive condition as neoplastic.
Moreover, the interpretation of results is crucial. Amplification products can be visualised by standard Agarose or PAGE gels, which represent dated techniques that nowadays are being replaced by more sensitive capillary electrophoresis (CE) detection methods. Although several attempts have been made in human medicine to standardise the interpretation of the peaks resulting after capillary electrophoresis94–96, reporting clonality testing is still a challenge for the pathologist, and relies on experience and results from previous assays performed, especially in more challenging cases.
Despite these many limitations, PARR is a rich-of-potential technique. Research nowadays is focused on optimisation of the technique firstly, and on the application of PARR to other diagnostic purposes. For instance, detection of minimal residual Disease (MRD) and relapse of neoplasia in early stages is one of the promising applications for
34
the near future. Studies have been conducted on the dog, showing how PARR can be a useful tool in the detection of MRD97,98 in dogs with remission of the disease with higher sensitivity than flow cytometry99.
1.3. AIMS OF THE STUDY.
The primary aim of this study was to refine the diagnosis of lymphoma achieved by flow cytometry using PCR techniques (PARR).
This refined PCR method would then be compared to flow cytometry in the same set of subjects.
Both methods will be compared in dogs and cats with lymphoproliferative disease and non-malignant proliferative conditions.
These aims are based on the following:
1) The importance of immunophenotype in lymphoma/ leukaemia diagnostics, 2) The advantages regarding cost and time, flow cytometry could represent a valid
alternative to other immunophenotyping techniques in the assessment of phenotype in lymphoproliferative diseases in both dogs and cats,
3) The sensitivity of PARR in detecting a clonal population within a reactive lesion, 4) The advantage of PARR which can be performable on virtually any sample type, 5) The lack of knowledge on feline clonality assays and the lack of comparison of
this method with techniques other than IHC,
6) The study will be specifically aimed at refining the methods for PARR for use with a variety of tissue sample from cats and blood from dogs.
36
CHAPTER 2:
OPTIMIZATION OF THE DNA
EXTRACTION TECHNIQUES.
37
2.1. INTRODUCTION.
Clonality assays are aimed to amplify specific genes expressed homogeneously by the cells examined, discriminating between the diagnosis of neoplasia or reactive lesion. Extraction and recovery of good quality genomic DNA (gDNA) is a critical juncture to obtain proper PCR amplifications and reliable results.
First known as “nuclein”, DNA has been studied over several years during the second half of the twentieth century and was finally described by Watson and Crick in 1953100,101.
Nevertheless, its first serendipitous extraction was performed about one century earlier by the German chemist Friedrich Miescher, who discovered this nucleus-derived molecule while studying cell chemical composition. The new substance was discovered in pus derived leukocytes, due to its insolubility in ether and its resistance to protease digestion. The first DNA extraction protocol was then set up over a few years and consisted of three crucial phases: isolation of cells of interest, isolation of nuclei and, finally, isolation of DNA. It was a long, time-consuming protocol, with the use of alkaline first, followed by acid solutions to enable precipitation of nucleic acids102. Nowadays, although different easy, time-saving commercial protocols have been developed, the necessary steps for DNA extraction are mostly invariant. Lysis is achieved using specific solutions aimed to reduce the disulfide bonds (such as dithiothreitol- DTT) or to mechanically dissolve the membrane, such as Sodium Dodecyl Sulfate (SDS) and heat to increase the fluidity of the cells and disrupt them. Chemical digestion by enzymes, such as Proteinase K, is also performed. After lysis is complete, DNA is bound to a solid phase, and the final elution step provides the pure gDNA solution.
Fundamental nucleic acids features when a molecular biology experiment is intended to be conducted, are: a good quantity of gDNA recovered expressed as ng/µL of eluate; purity of the gDNA recovered designed to have low contamination by proteins, salt and other substances; integrity of the gDNA recovered. Especially in a situation where archived (such as frozen blood, or cell pellets) or old (such as stained cytological or
38
haematological slides or FFPE tissue sections) samples are used, meeting these requirements can be challenging.
Different techniques are suitable for nucleic acid assessment. One of these is spectrophotometry, an analytical technique, which allows the quantification of a substance in a solution, depending on its own Ultra-Violet (UV) light absorbance spectrum103,104. The concentration of the molecule is calculated by the Modified Beer-Lambert Equation assuming that attenuation of a beam of light passing through it depends on the contents of solutes104,105. Concentration (c) of gDNA measured by spectrophotometry is described as:
c=(A*ε)/b
Where, A is the absorbance, intended as the measure of the attenuation of a beam of light passing through a solution; ε is the extinction coefficient, a measurement of how strongly a molecular species absorbs light at a given wavelength; b is the path length in cm, which is a peculiar characteristic for each spectrophotometer. For double-stranded DNA, absorbance maxima is 260nm (A260), whereas the extinction coefficient is
50ng-cm/µl.104
Moreover, evaluation of the absorbance at different wavelengths allows assessment of contamination by other molecules such as proteins or salts. The purity of DNA is generally evaluated by considering absorbance at 280 nm (A280), which is the absorbance
maxima for proteins and at 230 nm (A230), which is considered the absorbance maxima
of phenol and guanidine, mostly found in commercial DNA extraction kits and often residual from the extraction process. Ratios of A280 and A230 with A260 represent
contamination by protein (given by A260/280 ratio) and phenol/ guanidine (given by
A260/230 ratio), respectively.
Pure gDNA has an A260/A280 around 1.8 and an A260/A230 of around 2. Lower values are
indicative of contamination or residual reagents from the extraction process. Higher values are usually consistent with measuring on a contaminated instrument, or RNA
39
contamination105. It’s important to note that extremely low concentrations can lead to incorrect ratio measurements105.
The last important characteristic to consider when approaching DNA analysis is gDNA integrity. Polymerase Chain Reaction (PCR) amplification of control genes distributed across the entire genome can serve this aim106. Other techniques include quantitative PCR amplification such as Real Time PCR107–109, nested-PCR110, or simple, direct visualisation of DNA on agarose gels109.
This part of the study has been designed to optimise DNA extraction protocols to use for further experiments. We selected the GenElute Mammalian Genomic DNA Miniprep Kit (Sigma Aldrich)111 and the QIAamp DNA Blood Mini Kit (Qiagen)112. We aimed to find the best protocol using the minimum amount of sample possible and obtaining the maximum nucleic acid yield. We focused our attention on EDTA whole blood and cytological slides as source material, using the archive of the Central Diagnostic Services (University of Cambridge).
2.2. MATERIALS AND METHODS.
2.2.1. EDTA BLOOD SAMPLES.
Two different kits provided the protocols selected for the trial: the GenElute Mammalian Genomic DNA Miniprep Kit (Sigma Aldrich)111 and the QIAamp DNA Blood Mini Kit (Qiagen)112.
In a preliminary phase, archived EDTA blood samples were processed according to the manufacturer’s instructions. Afterwards, each sample was treated by four optimised protocols (illustrated below), aimed to increase DNA yield with minimum contamination from reduced sample volumes.
We investigated the following: 1) the best performance for the same volume of sample used (200μl as recommended by the manufacturer) and which method had the best overall output between the two kits; 2) if the number of cells used affected DNA
40
retrieval and if lowering cell counts suitable amounts of gDNA were still achievable; 3) which method assured the lowest levels of residual contamination by reagents.
2.2.1.1 Case selection.
Twenty-two EDTA blood samples were retrieved from the Central Diagnostic Services (University of Cambridge). All the samples were stored at -80° C for a maximum of one year.
Ten samples both from dogs (five) and cats (five) with a mild increase in WBC were enrolled in the first part of the trial: the aim was to compare the yield of the two kits using the manufacturer’s protocol (Table 1).
The other twelve canine blood samples showed an increase in WBC, and were further subcategorised into three groups to facilitate the following statistical analysis: (1) a mild increase in WBC (count of 6-50x109/mL), (2) a moderate increase (count of 50-100 x 109/mL) and (3) marked increase (count >100 x 109/mL). These cases were all previously diagnosed with hematopoietic neoplasia: B cell chronic lymphoid leukaemia (B-CLL) and undifferentiated acute leukaemias (AUL) in six cases (three per subtype of leukaemia); Large Granular Lymphocyte Chronic Leukaemia (LGL-CLL) and T cell CLL (T-CLL) in four cases (two per each subtype of leukaemia), T cell Acute Leukaemia (T-ALL,) and Acute Myeloid Leukaemia (AML) in the remaining three cases (Table 2).
As we intended to use the Qiagen kit we preferred to optimise this protocol. In fact, these twelve samples were processed using four different protocols: first, the Qiagen protocol with no modifications (protocol QA); secondly, the Qiagen protocol using volumes of blood containing 5x10⁶/L of WBC (protocol QB); thirdly, the Qiagen protocol using amounts of blood containing 9x10⁶/L of WBC (protocol QC); finally, the Sigma kit, using volumes of blood containing 9x10⁶/L of WBC (protocol S).
41
2.2.1.2. Protocols.
2.2.1.2.1 GenElute Mammalian Genomic DNA Miniprep Kit (Protocol Sigma). A mixture of 20µL of the Proteinase K (Sigma Aldrich) and 200µL of EDTA blood was placed into a 1.5mL microcentrifuge tube. To obtain RNA-free samples incubation for 2 minutes at room temperature (RT) with 4μL of RNase A Solution (Qiagen) was carried out. Lysis was performed by adding 200µL Lysis Solution C (provided in the kit) to the mixture and incubating at 55 °C for 10 minutes. Each pre-assembled GenElute Miniprep Binding Column was prepared with 500µL of the Column Preparation Solution which was discarded after centrifugation at 12.000 ×g for 1 minute. This step is considered essential for maximisation of gDNA binding to the column. Two-hundred μL of pure (96/100%) ethanol was added to the sample, which was consequently spun at ≥6500 × g for 1 minute. After discarding the flow through, two washing steps were performed, using the Washing Buffer provided in the kit. The final elution was carried out adding 200µL of the Elution Solution (provided) directly into the centre of the binding column; before centrifugation, the elution buffer was incubated in the column for five minutes at room temperature, to increase the elution efficiency.
2.2.1.2.2 QIAMP Mini and Blood kit (Protocol QA).
Digestion of 200µL of whole EDTA blood was carried out using 20μl of proteinase K. To obtain RNA-free samples incubation for 2 minutes at room temperature (RT) with 4μL of RNase A Solution (Qiagen) was carried out. Lysis was performed by adding 200µL of AL buffer (provided), incubation for 10 minutes at 56°C followed by the addition of 200µL pure (96-100%) of ethanol to the sample. No preparation was needed for the column in this kit. The lysate was transferred to the QIAprep Spin Miniprep Columns (Qiagen), and after centrifugation, the flow through was discarded. Washing steps were then performed twice with two different washing buffers (buffer AW1 and AW2 both provided). Elution was carried out using 200μL of elution buffer. As recommended by the manufacturer, a second elution was also performed in the same column, with a total final volume of eluate of 400µl.
42
2.2.1.2.3.Optimized protocols (protocols QB, QC, S).
The optimisation of the protocols was aimed to use the minimum amount of sample possible. We chose to extract gDNA using both kits, from volumes corresponding to WBC of 9x10⁶/L (protocols QC and S) and 5x9x106/L (protocol QB). In order to have the 200µL volume recommended by the original protocols, volumes were adjusted to the cell count: if the desired cell count was contained in less than 200μL, the final volume was made up using PBS. If more than 200µl of blood was required, 200μL of PBS was added after obtaining a cell pellet by centrifugation.
Moreover, a smaller amount of elution buffer was used (150μl) to increase the final concentration of gDNA.
43
Table 1. Group 1. Patients affected by mild WBC increases. Blood was processed according to
GenElute Mammalian Genomic DNA Miniprep Kit (protocol Sigma) and QIAamp DNA Blood Mini Kit (protocol QA) protocols.
Sample ID WBC (x106/L) Species Protocol used Volume (µL)
1Q 6.16 Dog QA 200 1S Sigma 2Q 21.47 Dog QA 200 2S Sigma 3Q 8.63 Dog QA 200 3S Sigma 4Q 9.36 Dog QA 200 4S Sigma 5Q 10.08 Dog QA 200 5S Sigma 6Q 11.03 Cat QA 200 6S Sigma 7Q 7.62 Cat QA 200 7S Sigma 8Q 8.45 Cat QA 200 8S Sigma 9Q 18.14 Cat QA 200 9S Sigma 10Q 39.14 Cat QA 200 10S Sigma
44
Table 2. Second group of patients, affected by leukaemia. Each sample was submitted to four
different protocols. QA, Qiagen protocol according to manufacturer’s instruction; QB, Qiagen protocol using volumes corresponding to a WBC count of 5x10⁶/L; QC, Qiagen protocol using volumes corresponding to a WBC count of 9x10⁶/L; S, Sigma protocol using volumes corresponding to a WBC count of 9x10⁶/L. Volume of blood and PBS were adjusted to have the final WBC and the final volume of 200µL.
Sample ID WBC (x106/L) Species Diagnosis Protocol Used Volume (µl) PBS (µl)
11QA 256.2 Dog B-CLL QA 200 11QB 5 QB 19.5 180.5 11QC 9 QC 35.1 164.9 11S 9 S 35.1 164.9 12QA 32.9 Dog LGL-CLL QA 200 12QB 5 QB 152 48 12QC 9 QC 273 12S 9 S 273 13QA 203.99 Dog T-CLL QA 200 13QB 5 QB 24.5 175.5 13QC 9 QC 44.1 155.9 13S 9 S 44.1 155.9 14QA 52.56 Dog LGL-CLL QA 200 14QB 5 QB 95.1 104.9 14QC 9 QC 171.2 28.8 14S 9 S 171.2 28.8 15QA 121.43 Dog AUL QA 200 15QB 5 QB 41.2 158.8 15QC 9 QC 74.1 125.9 15 S 9 S 74.1 125.9
45
Table 2. Continued.
Sample ID WBC (x106/L) Species Diagnosis Protocol used Volume (µL) PBS (µL)
16QA 258.36 Dog AUL QA 200 16QB 5 QB 19.4 180.6 16QC 9 QC 34.8 165.2 16 S 9 S 34.8 165.2 17QA 90.9 Dog AML QA 200 17QB 5 QB 55 145 17QC 9 QC 99 101 17S 9 S 99 101 18QA 27.69 Dog T-ALL QA 200 18QB 5 QB 180.6 19.4 18QC 9 QC 325 18S 9 S 325 19 QA 77.23 Dog B-CLL QA 200 19QB 5 QB 64.7 64.7 19 QC 9 QC 116.5 83.5 19 S 9 S 116.5 83.5 20 QB 76.96 Dog AUL QA 200 20 QB 5 QB 65 135 20 QC 9 QC 83.1 116.9 20S 9 S 83.1 116.9 21 QA 19.09 Dog T-CLL QA 200 21 QB 5 QB 471.5 21 QC 9 QC 261.9 21 S 9 S 261.9 22 QA 38.1 Dog B-CLL QA 200 22 QB 5 QB 128.5 71.5 22QC 9 QC 231.3 22 S 9 S 231.3
46
2.2.2. CYTOLOGICAL SLIDES.
The kit used for the trial was the QIAamp DNA Blood Mini Kit (Qiagen)112.
Archived cytological slides from dogs diagnosed with lymphoma/leukaemia were processed using the manufacturer’s instruction and two protocols published by Roy-Chowdhury et al. (2016)113 and Killian et al. (2010)114.
In particular, the aim of the experiment was: 1) to evaluate how many slides per patient are required to obtain the best gDNA yield and purity; 2) to indicate how to select slides according to characteristics: in particular, the amount of material assessed macroscopically and the cellularity needed to have the best gDNA yield and purity; 3) to determine which method assured the lowest levels of residual contamination by reagents; 4) to combine all the information to choose the best protocol.
2.2.2.1. Case selection.
Blood smears slides from 12 cases were selected for inclusion in the study based on subjective microscopic determination of cellularity of the smears and the morphological condition of the cells (classified as high, moderate and low cellularity). Two slides were available for seven patients (cases no. 3, 4, 6, 7, 8, 1, 14), whereas a single slide was available for the rest of the cases (no. 5, 9, 10, 12, 13). The macroscopic amount of material was moderate in the majority of the cases (no. 3, 4, 8, 9, 12, 13) while the remainder had low cellularity. Finally, cellularity was high in two cases (no. 7, 12), moderate in five (no. 3, 4, 5, 8, 13) and low in two slides (cases no. 9, 11). An example of cellularity of the slides is shown in Figure 6. The slides were assigned to three different groups, submitted to the three protocols: group one (samples no. 3, 4, 5, 6) using the manufacturer’s instructions; group two (samples no. 7, 8, 9, 10) using the protocol from Roy-Chowdhury et al.; and group three using Killian et al. protocol (samples no. 11, 12, 13, 14). Case data are summarised in Table 3.