Dyad: self-esteem
– academic success, evidenced by counseling activity
Abstract
La ricerca mira ad indagare l’influenza di un programma migliorativo sulla stima globale di sé di preadolescenti con ridotta autostima e a monitorare i cambiamenti occorsi nei risultati acca-demici. Partiamo, infatti, dall’ipotesi che, se i punteggi di autostima globale di preadolescenti con bassa autostima aumentano dopo aver conseguito il diploma, si possa avere una curva ascen-dente nei risultati accademici grazie a tale programma. Il gruppo di ricerca è composto da 126 preadolescenti, sia maschi che femmine, di età compresa tra 12 e13 anni. Sono stati selezionati studenti a bassa e medio-bassa autostima (che avevano ottenuto un punteggio 29 nella scala di Rosenberg). Abbiamo utilizzato la scala di Rosenberg per la misurazione dell’autostima e metodi di documentazione basati sui voti dei registri per i risultati accademici. Gli esiti della ricerca ci permettono di concludere che il programma ha migliorato l’autostima dei soggetti e i loro risultati accademici.
Parole chiave:
autostima, successo scolastico, preadolescenza, programma di miglioramento al fine di aumentare l’autostima
The research aims to investigate the influence of an ameliorative program over the global self esteem of preadolescences with reduced self esteem and to track changes occurred on their academic results. We assume that if the scores of global self esteem of preadolescents with low self esteem increases after they graduate an ameliorative program, we expect to have an ascendant curve for the academic results. The research group is made of 126 preadolescences, both boys and girls. There were selected students with low to medium-low self-esteem (whom scored under 29, at the Rosenberg Scale for self esteem measuring). We measured the self esteem with Rosenberg scale and the academic results by documentation methods: grades’ registries. The results concludes that after an ameliorative program take place, the preadolescent improve their self esteem and their academic results.
Key words:
self-esteem, academic success, preadolescence, ameliorative program aiming to increase self esteem di Daciana Lupu, Simona Tomozii
Daciana Lupu, Simona Tomozii
Dyad: self-esteem
– academic success, evidenced by counseling activity
1. Background
The self esteem remains one of nowadays challenges. No matter if the self esteem is too low or unrealistically raised without having a real fundament in the personality structure; in both cases it produces un-balance. There are situation when the self esteem may have rapid fluc-tuations causing to psychical discomfort. A large series of synonyms are used when pointing to the self esteem concept: self respect, self ap-preciation, self satisfaction, self contentment, self-assessment, self-pride, self consideration and appreciation. Here comes a legitimate question, what is actually the self esteem? The concept’s etymology comes from the Latin word “oestionare” and it has means assessment and estima-tion. The concept has a dual signification: to decide the value and to have an opinion about something. At present, that English speakers use the concept of self esteem with the meaning of self estimation, self ap-preciation while the French speakers see it more as self conceit (ap-proaching it from an emotional perspective). Most of the definitions accentuate the evaluative aspect of the self. The Romanian Explanatory Dictionary (1988) defines only a part of that word “a feeling of valu-ation determined by somebody’s or something’s credits or qualities”. Hayes (2003, p. 16) describes the self esteem as “making value judge-ments about what is good or bad”. Argyle sees the self esteem as “the self assessment, resulting in self acceptance and self valorisation, when compared to others or not” (1967, p. 120), and André and Lelord follow the same line when defining the self-esteem as “a judgemental view over ourselves which is vital for psychological balance” (2003, p. 61). Constantin (2004, p. 253) also highlights the evaluative procedure, but it adds some affective connotations of the self esteem: “it indicates the individuals’ emotions when referring to their own person”.
There are experts that perceive the self esteem as one of the in the human needs, such as Albu for whom the self esteem was “an urgent need with a survival value”, seeing it as an “benchmark and foundation of life and each individual activity” (2002, p. 77). Also the André and Lelord see it as a “profound and strong human need” (1999/2003, p.
77). The self esteem is seen as a personality attribute. Doron i Fr. Parot (1999, p. 745) considered the self esteem as “a personality trait when compared with the value that an individual assigns to its own person-ality” – Bednar, G. Wells i S. Peterson (1996) placed the self esteem in relation with the personality-motivation-affectivity, considering it a “sustainable and emotional sense of personal worth, based on a accu-rate perception of self ”. On the personal value perceived personal value direction, the definition offered by the Dictionnaire actuel de l éducation seems to be large broad and imprecise: “the global view offered by the individuals about themselves” (2005, p. 617).
2. Presentation of the Study
The research objective is investigate the influence of the ameliorative program over the global self esteem in the case of preadolescents with a low self esteem and to identify the changes that occurred in the ac-ademic results. The research hypothesis: If the global self esteem scores of preadolescents with a low self esteem have positive changes after ful-filling an ameliorative program, we expect that the academic results to perform a slight upward curve. The research lot: 126 preadolescents (enrolled in 10 classes of the 6th graders, from 5 schools) were in the
experimental group and 127 preadolescents formed the control group (enrolled in other 10 classes of the 6thgraders from 5 schools). Thus,
the experimental lot had 126 subjects of whom 68 persons (54%) were females and 58 (46%) were males. The control group had 127 subjects of whom 66 (52%) were females and 61 males (48%) (Figures 1 and 2 represent the proportion in which schools contributed with students first to the experimental group and second the control group).
Fig. 1: School percentage for the experimental group ! ! "#$% &'$% "&$% ! ! ! ! ! ! ! ! ! ! ! ! ! ! ! ! ! ! ! ! ! ! Sëcoala 8 52 elevi Sëcoala 6 21 elevi Sëcoala 13 53 elevi EXPERIMENTAL GROUP
Daciana Lupu, Simona Tomozii
Fig. 2: School percentage for the control group
For both research groups there can be made comparisons from the point of view final grades at the graduation of 5th and 6th grade (Fig-ure 3. and Fig(Fig-ure 4).
Fig. 3: Final grades – Experimental group
Under the temporary coordinates the research extended up to 2 years: in the first year (there was created the ameliorative program and it was also tested) and in the second year of research (it took place the initial assessment of the two research groups- pre-test, the ameliorative program implementation and the final assessment for the experimental and the control group- post-tests). The experiment, surveys, school documents study (registry) and statistical methods.
1) The experiment – in the designed experiment, the independent variable was self esteem of the preadolescents who participate in the ameliorative program of Counselling. The ameliorative program
! "#$% &'$% ()$% !!!!!!!!!!! Sëcoala 11 51 elevi Sëcoala 15 26 elevi Sëcoala 9 50 elevi CONTROL GROUP
Students per school
EXPERIMENTAL GROUP
Annual grades (class 5thand 6th)
Series 1
aimed to raise the level of self esteem of preadolescent with low and medium low self esteem. Increasing the self esteem of adoles-cents with low and medium low self esteem can influence the school performance, and can facilitate the awareness of success in different areas (sports, artistic, international, physical attractively) – dependent variables. The activities from the ameliorative program combined group activities (group counselling -18 meeting) with individual ones (individual counselling – 3 meetings). By these meeting the students had the opportunity to better know them-selves and others (classmates), to relate to others, to exchange opin-ions under the guidance of a specialist – the school counsellor. Perhaps the most important aspect was give real value to their for the strengths they have different areas: academic, artistic, relational and from the point of view of their corporal self esteem (physical attractiveness). The number of hours for the activities of the pro-gram was of 21 meetings.
2) The Rosenberg Scale for Self Esteem measures the general feeling of personal growth, the general self esteem. Low scores of low self esteem show a global negative perception of personal value while persons confident in their skills and with high degree of satisfaction for personal achievements have high self esteem scores.
3) The school documents study: registers and notepads – provide in-direct information about the educational activity, especially over its results.
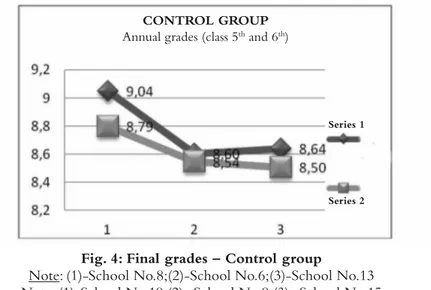
Fig. 4: Final grades – Control group
Note: (1)-School No.8;(2)-School No.6;(3)-School No.13 Note: (1)-School No.19;(2)- School No.9;(3)- School No.15
Serie 1- final grades for 5th grade Serie 2: final grades for 6th grade
Series 1
Series 2
CONTROL GROUP
Daciana Lupu, Simona Tomozii
3. Results of the study
Self esteem was assessed before the ameliorative program start and then was again measured at the end of it. The results are presented in the following figures, in the first one the results of the experimental group and in the second of the control group.
Fig. 5: Experimental group
means of initial assessment and of final assessment
Fig. 6: Control group
means of initial assessment and of final assessment
The results presented in Figure 5 belong to students from the ex-perimental group. One can notice an increase of global self esteem from the initial assessment stage to the post-tests phase. See table 3 Rosen1. with a mean of 26.69 which modifies positive at the end of
3 EXPERIMENTAL GROUP Self Esteem Rosen2 final Self Esteem Rosen 1 initial
Experimental group- means of initial assessment and of
f F CONTROL GROUP
the ameliorative program and Rosen2. with a mean of 30.18. The stan-dard error for Rosen 1 was of 2.49 and for Rosen 2 of 3.29. Scores spreading around core values is greater for post-tests stage, while for the initial stage the values grouped around average are homogenous. Dispersion also is higher for the results obtained at second application of the Rosenberg Scale (Rosenberg 2). At the initial test participated 126 preadolescents and at the final one 120. The difference consisting 6 teenagers is explained by the transfers at other schools or by the delay which are medically motivated. The lowest score shows a slide increase from the value of 17,00 for Rosen 1 self esteem to 18,00 for Rosen 2 self esteem. For the highest score the maximum score the self esteem increased with 5 points from 31,00 for Rosen 1 to 36,00 for Rosen 2. In Figure 6 we can see at the control group that the scores from the initial evaluation are higher than those from the final one (27,26 for Rosen 1 self esteem and 26.47 for Rosen 2 self esteem). The decreasing is associated with a standard error of 3.10 points for Rosen 1 and 4.92 for Rosen 2. Scores spreading around the central values is higher in the final phase, while in the initial assessment one the results are grouped more homogenous, as in the case of the experimental group. The values for the control group decrease while those for the exper-imental one increase. Also the dispersion is higher in the second as-sessment phase when we applied the Rosenberg self esteem scale (Rosenberg 2).
In Fig. 6 we can observe how the results of the initial and final as-sessment of control group register a decrease (27,26 for Rosen 1 self esteem and 26,47 for Rosen 2 self esteem). The decrease is associated with a standard error of 3,10 for Rosen self esteem and with 4,92 for Rosen 2 self esteem. Scores spreading around the core values is greater for the post-test phase while for the initial one, the values are grouped more homogeneous around the average, results similar to those from the experimental group. The mean values for the control group de-crease while the results for the experimental one rise. Also the disper-sion is higher for the results obtained in the case of final assessment at the application of Rosenberg Scale (Rosenberg2).
There are positive changes of value for the global self esteem. We can see in the experimental group case how the range for low scores (15-20) maintains while from phase one to phase 2 with the same number of students (2 students) (Figure 7. and Figure 8.).
Daciana Lupu, Simona Tomozii
Fig. 7: Experimental group – cumulative frequencies
Fig. 8: Experimental group–cumulative frequencies in pre-test phase for 5 ranges of scores in post-test phase for 5 ranges of scores
Note: 1 range 15-20; 2 – range 21-25; 3 – range 26-30;
4 – range 31-35; 5 – range 36-40
If at first assessment there were 41 preadolescent with scores up to 25, at the final assessment Rosenberg 2, their number lowered to 9 (see Figure 7. and Figure 8.). The same decline can be seen at the range of scores 26-30, ie 81 to 52 preadolescents. However in the high scores of global self esteem is a significant the improvement of the scores is significant from 4 to 57 students (for the range of scores 31 to 35), from 0 to 2 students for scores on top (36 to 40). Significant growth has occurred for the range of scores 31to 35. It is assumed to be the effect of the counselling activities of the ameliorative program.
Table 1: Registered results after the application
of Rosenberg Scale-final assessment (post-tests)
It can be seen how the experimental group results had suffered pos-itive changes in a very high percentage (81.74%) compared with the control group (23,83%). Why this difference? The interpretation can focus on the different contexts the preadolescent have to face within 11 to 13 years old. The situations create tension and they come from the external environment: parents, teachers, friends, and classmates, other significant adults from their life and even from the society. Still the most important are the pressures come from the preadolescent himself, from his self. Those internal pressures reach: physical self imag-ine, scholar expectances, the desire to engage in sport or artistic activ-ities, popular or unpopular, etc. The adolescent face them better when supported by significant adults around him: parents, teachers and scholar counsellor. An important role is played by educational coun-sellor who can polarise the activities held in school and in the family in a manner in which his/her self esteem rises and he/she will be able to value more the potential of success in all areas of life: academic, artis-tic, relational and the corporal self image (physical attractiveness). The educational counsellor can also initiate programs or program sequences with ameliorative purpose allowing students to better know them-selves, to assess both the self image and the self esteem.
Another researched area is represented by the preadolescents’ scholar results (the dependent variable) during the school year in which the research was conducted. At the end of each semester the results for each subject from the study plan, students’ absences and behaviour grades were registered. The final grades of the 5thand 6thgrade, as well
as averages of the subjects of each semester can be found in the fol-lowing table. (Table 2).
F
Rosenberg Scale- final
a
SELF ESTEEM SCORES Stagnate (students’ number) Lowers (students’ number) Rises (students’ number) Number of students who didn’t graduated school EXPERIMENTAL GROUP
(126 students) 10 students (7,91%) 7 students (5,55%) 103 students (81,74%) 6 students (4,80%)
CONTROL GROUP
(127 students) 25 students (19,68%) 65 students (51,18%) 30 students (23,83%) 7 students (5,52%)
Daciana Lupu, Simona Tomozii
Table 2: Annual and quarter results – experimental group
The reparation of academic results on school averages at the end of 5thgrade is the following: for very good results (averages are found on
the following range 9,01-10,00: 56 students – 44,44%) and the results seen as good (averages are found on the following range 8,01-9,00: 47 students – 37,30%) (compared with 22 students – 17,46% – with av-erages between 7,01 to8,00 and only one students with an average on the inferior range 0,79%). At the end of 6th grade, the situation
changes by frequency growth on average intervals: 8,01-9,00: 51 dents (40,47%); 7,01-8,00: 27 students (21,42%) and 6,01-7,00: 4 stu-dents (3,17%). It can be seen a decrease on the averages interval 9,01-10,00: 38 students (30,15%). At the end of the first semester the preadolescents from the control lot had academic results (general av-erages for the first semester) of which were of 8,47 with a standard er-ror of 0,083682. The minimum value for the first semester averages was 6,50 and the highest one was 9,75. At the end of second semester, after 21 hours of individual and group counselling activities, designed as part of the ameliorative program, students’ averages from the second increased slightly (from 8,47 in the first semester to 8,65 in the second semester –with a standard error of 0.82225). Also the minim value of the averages obtained in the second semester increased a little from 6,50 to 6,67. The same ascended curve is seen for the maximum value (9,75 to 9,93).
Figure 11 illustrates the averages for each semester of students in the experimental lot. The slight increase of the average value can be observed from the first towards the second semester.
No. Amplitude Mini - mum Maxi - mum Average Standard error Variance
Experimental group
Statistic Statistic Statistic Statistic Statistic Error Std. Statistic Statistic year 5 average 126 3,24 6,65 9,89 8,7524 ,06559 ,73620 ,542 year 6 final average 119 2,93 6,90 9,83 8,5857 ,07363 ,80317 ,645 Average grade semester 1 124 3,25 6,50 9,75 8,4752 ,07515 ,83682 ,700 Average grade semester 1 119 3,26 6,67 9,93 8,6520 ,07538 ,82225 ,676 Valid N 119 T
At the end of 6t changes by
f
At the end of second semester, after 21 hours of individual a
Preadolescents’ academic results from the control group had a dif-ferent route (Table 3.). At the end of the first semester, for the value of the general averages of each semester had the 8,40 (with a standard error 0.84730). For the first semester the average of the averages reg-istered a slight decrease and at the end of the semester the results in-dicated 8,36 (with a standard error of 0.087249). For the first semester the minimum value of the final averages was 6,13 and the maximum one of 9,94. These values lowered at the end of second semester: from 6,13 to 5,50 (the lowest value) and from9,94 to 9,88 (the highest value). F CONTROL GROUP EXPERIMENTAL GROUP
Fig 11: Mean of averages for each semester- Experimental group
Tab. 3: Annual and quarter results-control group
The repartition of academic results on averages at the end of 5th
grade, for the control group is the following: for the very good results (the range of averages lies from 9,01to 10,00: 47 students– 37%) and good results (the range of averages is from 8,01 to8,00 (22,83%) and only 4 students with a lower average – 3,14%). At the end of 6thgrade
the situation changes a little by increasing the frequencies on the ranges with median results: 8,01-9,00: 55 students (43,30%); 7,01-8,00: 30 students (23,62%) i 6,01-7,00: 5 students (3,93%). It registers a de-creases on the range of averages between 9,01 to 10: 30 students (23,62%). The same situation took place with the experimental, too. The results can be justified by the tasks difficulty and by a large volume of information, which modifies from one year to another. For students from the control group the slight decrease of the averages medium value from semester one to the second is presented in the next table.
Daciana Lupu, Simona Tomozii
No. Amplitude Mini - mum Maxi - mum Average Standard error Variance
Control group
Statistic Statistic Statistic Statistic Statistic Eror Std. Statistic Statistic
year 5 average 127 3,42 6,54 9,96 8,6040 ,07559 ,85183 ,726 year 6 final average 120 3,85 6,06 9,91 8,4077 ,07645 ,83743 ,701 Average grade semester 1 124 3,81 6,13 9,94 8,4059 ,07609 ,84730 ,718 Average grade semester 1 120 4,38 5,50 9,88 8,3693 ,07965 ,87249 ,761 Valid N 120 It registers a d
This range shows significant
i
EXPERIMENTAL GROUP CONTROL GROUP
Frequencies Frequencies
GRADES RANGES
Semester 1 Semester 2 Semester 1 Semester 2
5,01 - 6,00 - - - 2 6,01 - 7,00 4 4 7 3 7,01 - 8,00 34 31 32 32 8,01 - 9,00 50 34 55 52 9,01 - 10,00 36 50 30 31 Incomplete situations 2 7 3 7 TOTAL 126 126 127 127
The data analyse proves that in the experimental group, registers a significant increase on the range of averages of 9,01-10,00 (from 36 subjects to 50 subjects – 14 cases). This enhance caused decreasing on the range of averages of 7,01-8,00 and 8,01-9,00. A major concern is represented by the constant number of subjects registered on the rage of averages with lowest scores: 6,01 to 7,00 (4 subjects). Regarding control group, the quarter averages have a different route with in-creased, decreased and constant number of subjects, on the most ranges. If in the experimental group case we have the same number of students on the lowest range of averages, for students from the control group we observe a decrease of averages from the second semester, which formed a new range with averages between 5,01 to 6,00. The averages for students from the control group register decreasing result also for the average ranges of 6,01 – 7,00 (4 subjects) and 8,01-9,00 (3 sub-jects). The only interval that looks the same for both of groups is the range of averages of: 9,01-10,00. This range shows significant increas-ing results of students from the experimental group (14 cases) and slight increases for subjects from the control group.
Fig.13: Averages for first semester - Experimental group
Fig. 15: Averages for first semester - Control group
Fig.16: Averages for second semester – Control group
A comparative analysis was made, over the correlations between the averages from the second semester and the results from Ronsenberg 2 Scale which was applied in the final assessment. Correlations are sig-nificant where the significance p<0,01. For the experimental group, the correlation between the results from the second semester and the Rosenberg 2 Scale has a positive vale of 0.044, which means that if the self esteem increase the academic results increase, too. For control group the correlation between the academic results of the second se-mester and the self-esteem values from Rosenberg 2 is slightly positive (0.027). The correlation is stronger for the results received by the ex-perimental group compared to the results of the control group. The relation between the independent variable: self-esteem and the de-pendent variable: academic results are illustrated in the following fig-ures. Figure 17 shows the variables relation for the experimental group while the Figure 18 explains the preadolescents’ perspective from the control group.
Daciana Lupu, Simona Tomozii
CONTROL GROUP 1st semester grades GROUP CONTROL 1st rad 1st semester grades p<0,01. For t CONTROL GROUP 1st semester grades CONTROL GROUP 1st semester grades
Fig.18: Control group - averages for semesters 1 and 2 and initial and final self esteem (middle values) 1 and 2 and initial
and final self esteem (middle values)
4. Discussion
The conclusion that results from the two figures is that there is: a direct correlation between the increase in self-esteem and the increase in ac-ademic results regarding the experimental group. At the same time, there is another direct correlation between the decrease of self-esteem and the slight decrease of academic results for the control group, especially for the preadolescence with low and medium-low self-esteem. We con-clude the implementation of different ameliorative programs aiming to develop self-knowledge, self-image, realistic self image, and self-esteem can help preadolescents in the areas including academic activity.
F
Grades sem 1 Grades sem 2 Rosen1 initial Rosen 2 final
Grades sem 1 Grades sem 2 Rosen1 initial Rosen 2 final
CONTROL GROUP EXPERIMENTAL GROUP
References
Albu G. (2003). Searching the authentic education. Bucharest: Iri Press. André C., Lelord F. (1998). How to express emotions. Bucharest: Trei Press. Argyle M. (1967). The Psychology of Interpersonal Behaviour. London: Penguin
Books.
Constantin T. (2004). Autobiographical memory. Ia i: European Institute. Dewit D. (2000). The effect of school culture on adolescent behavioural
prob-lems: self-esteem, attachment to learning and peer approval of deviance as mediating mechanisms. Canadian Journal of School Psychology, 16(1), pp. 15-38.
Doron R., Parot F. (1999). Psychology dictionary. Bucharest: Humanitas Press. Hayes N. (2003). Psychology. New York: The McGraw Hill Companies. Harter S. [1998](2000). Self and Identity development. In C. Carver, M.
Scheier, Perspective on Personality. Needham Heihgts: Allyn &Bacon. Miller D., Lavin F. (2007). But now I feel I want to give it a try: formative
as-sessment, self-esteem and a sense of competence. The Curriculum Journal,
18(1), pp. 3-25.