Reaction Paths and the Conical-Intersection Seam of a
Retinal-Chromophore Model
Deniz Tuna,
*
,†Daniel Lefrancois,
‡Łukasz Wolański,
§Samer Gozem,
∥Igor Schapiro,
⊥,∇Tadeusz Andruniów,
*
,§Andreas Dreuw,
*
,‡and Massimo Olivucci
*
,#,○†Max-Planck-Institut für Kohlenforschung, 45470 Mülheim an der Ruhr, Germany
‡Interdisciplinary Center for Scientific Computing, University of Heidelberg, 69120 Heidelberg, Germany §Department of Chemistry, Wrocław University of Technology, 50370 Wrocław, Poland
∥Department of Chemistry, University of Southern California, Los Angeles, California 90089, United States
⊥Institut de Physique et Chimie des Matériaux de Strasbourg & Labex NIE, Université de Strasbourg, CNRS UMR 7504, Strasbourg
67034, France
#Department of Chemistry, Bowling Green State University, Bowling Green, Ohio 43402, United States ○Dipartimento di Biotecnologie, Chimica e Farmacia, Universitá de Siena, 53100 Siena, Italy
*
S Supporting InformationABSTRACT: As a minimal model of the chromophore of
rhodopsin proteins, the penta-2,4-dieniminium cation (PSB3) poses a challenging test system for the assessment of electronic-structure methods for the exploration of ground-and excited-state potential-energy surfaces, the topography of conical intersections, and the dimensionality (topology) of the branching space. Herein, we report on the performance of the approximate linear-response coupled-cluster method of second order (CC2) and the algebraic-diagrammatic-construction scheme of the polarization propagator of second and third
orders (ADC(2) and ADC(3)). For the ADC(2) method, we considered both the strict and extended variants (ADC(2)-s and ADC(2)-x). For both CC2 and ADC methods, we also tested the spin-component-scaled (SCS) and spin-opposite-scaled (SOS) variants. We have explored several ground- and excited-state reaction paths, a circular path centered around the S1/S0surface crossing, and a 2D scan of the potential-energy surfaces along the branching space. Wefind that the CC2 and ADC methods yield a different dimensionality of the intersection space. While the ADC methods yield a linear intersection topology, we find a conical intersection topology for the CC2 method. We present computational evidence showing that the linear-response CC2 method yields a surface crossing between the reference state and thefirst response state featuring characteristics that are expected for a true conical intersection. Finally, we test the performance of these methods for the approximate geometry optimization of the S1/S0minimum-energy conical intersection and compare the geometries with available data from multireference methods. The present study provides new insight into the performance of linear-response CC2 and polarization-propagator ADC methods for molecular electronic spectroscopy and applications in computational photochemistry.
1. INTRODUCTION
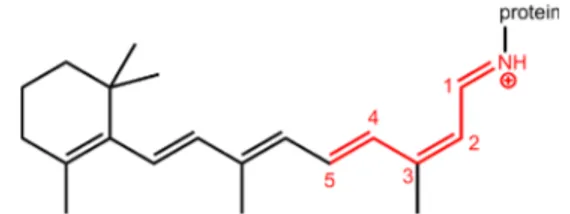
The penta-2,4-dieniminium cation (PSB3) has been extensively used as a minimal model system of the protonated Schiff base of retinal (rPSB), which is the chromophore of light-sensitive rhodopsin proteins (cf.Figure 1). In vertebrate and invertebrate retinas or in microbial membranes, the photoisomerization of rhodopsins initiates a reaction cascade that lies at the heart of light-sensing and other light-driven functions throughout various unicellular (archaea, eubacteria, and eukaryotic microbes) and multicellular (invertebrate and vertebrate) organisms. Static calculations, that is, the computation of vertical excitation
energies, the optimization of excited-state equilibrium geo-metries and minimum-energy conical intersections, and the mapping of excited-state potential-energy surfaces and conical-intersection seams, have been performed on PSB3 for almost two decades.1−16Insight into the photoinduced dynamics of PSB3 has been gained by performing nonadiabatic molecular-dynamics simulations on the isolated and solvated forms.17−26
Received: January 12, 2015 Published: October 22, 2015
Downloaded via 109.115.116.70 on March 25, 2021 at 07:24:23 (UTC).
In recent years, we have conducted a series of extensive benchmark studies for testing various ab initio and density-functional theory methods with respect to their performance in describing the potential-energy surfaces of the electronic ground state and thefirst electronically excited singlet state driving the photoisomerization of the central double bond of PSB3. Particular attention was paid to the performance of these methods in describing the potential-energy surfaces and associated electronic wave functions in the vicinity of a conical intersection and its topography and topology along the branching space. Methods that have been tested so far include CASSCF, CASPT2, MRCISD(+Q), NEVPT2, XMCQDPT2, EOM-CC, SORCI, and quantum Monte Carlo as well as several methods based on density-functional theory.27−34 Herein, we extend this benchmark series to the linear-response approximate coupled-cluster (CC) method of second order (CC2) and to the algebraic-diagrammatic-construction (ADC) method of the polarization propagator of second and third orders (ADC(2) and ADC(3)). For the ADC(2) method, we considered both the strict (ADC(2)-s) and extended (ADC(2)-x) variants, and for both CC2 and ADC methods, we also considered the spin-component-scaled (SCS) and spin-opposite-scaled (SOS) variants. The present contribution carries forward an ongoing effort to identify and assess computational methods for a balanced description of both molecular electronic spectroscopy and photochemical processes.35−37
The approximate coupled-cluster method of second order (CC2) was formulated by Christiansen, Koch, and Jørgensen as an approximation of the CCSD method, which reduces the scaling of the computational effort from N6for CCSD to N5for CC2, with N being the number of one-electron basis functions.38 A few years later, an efficient code, which makes use of the resolution-of-the-identity (RI) approximation and the linear-response formalism for the computation of electronically excited states, was implemented into the program package Turbomole39 by Hättig and Weigend.40 Köhn and Hättig then developed analytical excited-state gradients,41,42transition moments, and molecular properties43for the CC2 method. Other quantum-chemistry programs that provide the CC2 method are Dalton,44 CFOUR,45Psi-4,46Molpro,47and NWChem.48Due to its high efficiency, linear-response RI-CC2 has been extensively used for the investigation of electronically excited states of various small-and medium-sized organic molecules.49−76 Send, Kaila, and Sundholm have shown that the reduction of the virtual-molecular-orbital space allows one to obtain relatively accurate CC2 excitation energies of large molecules at reduced computa-tional effort.71,77 Helmich and Hättig have shown that the introduction of pair-natural orbitals (PNOs) reduces the scaling of the resulting PNO-CC2 variant to N4 and thus offers a significant speed-up for the calculation of CC2 excitation
energies of large molecules.78 Recent work by Martı́nez and co-workers has brought forth a tensor-hypercontracted (THC) variant of equation-of-motion (EOM-) CC2, which also reduces the scaling of the method to N4.79,80
Ledermüller and Schütz have presented analytical gradients for a CC2 method based on localized molecular orbitals.81 Sneskov and Christiansen have provided a comprehensive review on coupled-cluster methods for the computation of electronically excited states.57
The algebraic-diagrammatic-construction (ADC) scheme of the polarization propagator was originally proposed by Schirmer.82,83Although the theoretical foundation of ADC has been available for more than three decades, implementations of ADC methods into the quantum-chemistry packages Turbo-mole,39Q-Chem,84,85and Psi446have only recently begun to raise awareness of this method. The ADC formalism of the polarization propagator is based on many-body Green’s function theory. The polarization propagator describes the effect of an external perturbation, such as the absorption of a photon, on the polarization of the electronic structure of a many-electron system. The ADC scheme offers an approximate and efficient method for the evaluation of the polarization propagator by means of Møller−Plesset perturbation theory and, as such, allows for the computation of excitation energies and transition moments of a molecular system. For the computation of electronically excited states, three main variants of ADC are in use today: the strict version of second-order ADC, ADC(2)-s, the extended version of second-order ADC, ADC(2)-x, and third-order ADC, ADC(3). The two variants of ADC(2) differ in the order at which the two-particle-two-hole block in the ADC matrix (that is, double excitations) is treated, that is, at zeroth order in the ADC(2)-s variant and atfirst order in the ADC(2)-x variant. The ADC(2)-x variant thus gives a qualitatively correct description of doubly excited states, although excitation energies are generally too low.83,86,87ADC(3), which is computationally only slightly more demanding than ADC(2)-x, remedies these problems and additionally offers significantly higher accuracy.88 The ADC(2)-s method scales with N5(as does CC2), whereas the ADC(2)-x and ADC(3) methods both scale with N6(with slightly different prefactors).82,83,86−88Helmich and Hättig have presented PNO-ADC(2)-x, a variant that is based on pair-natural orbitals with a reduced scaling of N4, as well as two alternative approaches for the perturbative correction for double excitations to the ADC(2)-s scheme, which shows improved accuracy over that of ADC(2)-x (which is inherently inaccurate due to missing second-order coupling elements for single and double excitations) for the computation of singlet excited states of double-excitation character.89 Schütz has presented a local ADC(2) scheme and demonstrated its efficiency by optimizing several excited-state minima of a chlorophyll molecule.90Most recently, Lefrancois, Wormit, and Dreuw have presented a spin-flip variant of ADC and demonstrated its application to typical problems of strong multireference character in the electronic ground state.91
An advantage of the ADC methods over approximate CC methods is their Hermiticity, which avoids the breakdown in close vicinity of surface crossings, a well-known problem for CC methods.42ADC(3), in particular, scales with N6, in contrast to N7for CC3, which allows the efficient calculation of significantly larger molecular systems at high accuracy. While CC methods describe the ground and excited states on an equal footing, the ADC methods describe the electronic ground state at the Møller−Plesset (MP) level at the respective order of perturbation theory, that is, MP2 in the case of ADC(2)-s and
Figure 1. Structural formulas of the 13-cis rPSB chromophore of microbial rhodopsins (large structure) and of the model system PSB3 (red substructure, for which the bond to the protein is substituted by a hydrogen atom). The numbering shown for PSB3 is used throughout this article.
excitation energies in linear-response theory, are connected by simple relations. However, while the CC2 Jacobi matrix is non-Hermitian, the ADC(2) Jacobi matrix is Hermitian.42
In recent years, ADC(2) (or ADC(3)) has been applied for the elucidation of the electronically excited states of organic molecules, for example, for the exploration of excited-state potential-energy surfaces,76,93−106for the QM/MM description of DNA components in aqueous solution,107−109as well as for nonadiabatic molecular-dynamics simulations of isolated mole-cules101,110−113 and clusters or dimers,72,114−116 for the calculation of excitation energies or absorption spectra of large molecular systems,75,90,117−122 for the calculation of XPS,123 NEXAFS,121,123and XAS124spectra of organic molecules, for the calculation of photoionization125 and photoelectron126,127 spectra, and for the calculation of solvatochromic shifts of aromatic chromophores.128
Spin-scaling approaches werefirst proposed as efficient and more accurate variants of the MP2 method. This idea wasfirst introduced by Grimme in 2003, who partitioned the correlation energy into parallel and antiparallel spin components and scaled the weights of these two contributions by introducing two semiempirical parameters (scaling factors). This method was dubbed the spin-component-scaled (SCS) variant of MP2.129 One year later, Head-Gordon and co-workers proposed to neglect the parallel-spin component altogether and instead increase the scaling factor for the antiparallel-spin contribution slightly. This method was dubbed the scaled-opposite-spin (SOS) variant of MP2.130In 2008, Hellweg, Grün, and Hättig implemented SCS and SOS variants of CC2 into Turbomole,131 and Hättig and co-workers recently demonstrated the higher accuracy of SCS-CC2 against conventional CC2 for the calculation of 0−0 band origins of medium-sized and large organic molecules.58 Krauter, Pernpointner, and Dreuw implemented an SOS variant of ADC(2)-s and ADC(2)-x into Q-Chem and demonstrated its applicability to larger molecules as well as its accuracy.132 Grimme, Goerigk, and Fink have published an extensive review on spin-scaling approaches for various ab initio methods.133
A conical intersection is a point in molecular-coordinate space where two Born−Oppenheimer potential-energy surfaces of like multiplicity are isoenergetic and therefore intersect. The vicinity of a conical intersection is characterized by strong vibronic coupling, which leads to the breakdown of the Born− Oppenheimer approximation. The degeneracy at a point of conical intersection is lifted linearly atfirst order when displacing the molecular geometry along two specific nuclear-displacement vectors. These two degrees of freedom define the branching-plane or branching-space vectors (cf.Figure 2). Thefirst vector is known as the gradient-difference vector g, which points in the direction of maximal energetic splitting. The second vector is known as the nonadiabatic-coupling vector h, which points in the direction of strongest nonadiabatic interaction of the two adiabatic electronic states. Displacement of the molecular
geometry at a conical intersection along any of the remaining 3N− 8 degrees of freedom retains the electronic degeneracy and merely moves the system along the (3N− 8)-dimensional seam of intersections between the two potential-energy surfaces (also called the intersection space). The intersection seam connects an infinite number of conical-intersection points and exhibits a topography that can be characterized by minima and transition states. Efficient algorithms for the geometry optimization of minimum-energy conical intersections are available in a number of quantum-chemistry programs these days. Aside from the minimum of the intersection seam, a number of methods has been developed for exploring the intersection seam.5,134−137 Conical intersections are of comparable significance for non-adiabatic processes and nonluminescent photochemical reac-tions as are transition states for ground-state chemical reactions.138−145Therefore, the computational investigation of photochemical processes calls for electronic-structure methods that are able to correctly describe the potential-energy surfaces of two intersecting states in the vicinity of a conical intersection. This study aims at elucidating the performance of CC2 and ADC methods in the vicinity of the S1/S0conical intersection driving the photoisomerization of PSB3.
The description of the topology, that is, the dimensionality of the branching space, of a conical intersection by a quantum-chemical method is another focus of this work. As we have shown in a previous study,32 variational multiconfigurational wave-function methods, such as CASSCF, yield a correct description of the branching space and indeed yield a “conical” intersection. Other methods, such as certain multiconfigurational perturbative methods like SS-CASPT2 (but not MS-CASPT2), yield an incorrect description of the branching space and give a linear, as opposed to a conical, intersection, where the intersection seam is only (3N− 7)-dimensional. From hereon, we refer to the latter cases as surface crossings to distinguish these f rom true conical intersections. In general, methods that treat the two intersecting electronic states on an equal footing and include interstate-coupling elements in the Hamiltonian can be expected to yield a true conical intersection. Such methods are the CASSCF method, the MRCISD method, the multistate version of CASPT2 (MS-CASPT2), the XMCQDPT2 method,32 and the SI-SA-REKS method.30,13 On the other hand, methods that describe the intersecting states differently or do not include nonadiabatic coupling-matrix elements are expected to yield a linear crossing because the nonadiabatic-coupling vector is nonexistent for a method that cannot describe the vibronic coupling between the states. This has been shown for the single-state version of CASPT2 (SS-CASPT2), which treats each state by its own
branching plane, which is spanned by the two branching-plane vectors, the gradient-difference vector g, and the nonadiabatic-coupling vector h. The red circle represents a circular path around the conical intersection, which will be discussed later in the text.
unperturbed and completely uncoupled Hamiltonian (H0),32 and for linear-response TDDFT.32,146 A more detailed introduction to these issues can be found in ref32.
For the CC2 method, it has already been demonstrated by comprehensive theoretical derivation by Hättig and by Köhn and Tajti that the topology of surface crossings between excited states is incorrectly described. This behavior is rooted in the non-Hermitian formulation of linear-response CC2.42,147 Here, however, we consider only an S1/S0surface crossing, which is different from the already studied case of excited-state surface crossings in the sense that the two intersecting states are not both response states and as such derived as eigenvalues of a non-Hermitian Jacobi matrix. Instead, only the S1excited state (thefirst response state) is derived from the Jacobi matrix, whereas the ground state is the reference state for the CC2 linear-response formalism. It is, therefore, thus far unclear how CC2 behaves at an S1/S0surface crossing, since it has been deemed to be impossible to describe the strong multireference situation in the electronic ground state, which is found at an S1/S0surface crossing, with a single-reference linear-response formalism, such as the CC2 method. For these reasons, an analysis of the behavior of the linear-response CC2 method for S1/S0 surface crossings, in other words, a surface crossing between the reference state and thefirst response state, is not available to date. For the ADC methods, on the other hand, the electronic ground state is described at a different level of theory, that is, the MP2 or MP3 level. This means that due to the description of the intersecting states at different levels of theory (which naturally excludes any coupling between the states), an S1/S0surface crossing cannot be expected to present as a true conical intersection but as a linear intersection instead.
In this article, we report on a comprehensive evaluation of the performance of CC2 and ADC methods for the description of S0 and S1reaction paths as well as of the branching space of the conical intersection involved in the photoisomerization process of PSB3. To that end, we combine the most relevant pathways and explorations of the immediate vicinity of the conical intersection from our previous benchmark studies, that is, the ground-state bond-length-alternation (BLA) pathway, the diradicaloid minimum-energy path (MEPDIR), the charge-transfer minimum-energy path (MEPCT), the excited-state minimum-energy path from the cis isomer to the conical-intersection seam (MEPcis), the excited-state minimum-energy path from the trans isomer to the conical-intersection seam (MEPtrans), a scan along the conical-intersection seam, and, finally, a scan along a circular path centered at the conical intersection as well as a two-dimensional scan of the two intersecting potential-energy surfaces along the branching space.27,31,32Apart from these previously introduced pathways, we present a new evaluation of the CC2 and ADC(2)-s gradient-difference vectors along a circular path around the surface crossing. Details on these pathways are given in theMethods
section. We also evaluate the performance of a penalty-function algorithm developed by Levine, Coe, and Martı́nez148for the approximate optimization of the minimum-energy conical intersection of PSB3 with the CC2 and the ADC(2)-s methods. In total, the methods tested herein comprise CC2, SOS-CC2, ADC(2)-s, SOS-ADC(2)-s, ADC(2)-x, SOS-ADC(2)-x, and ADC(3), with additional evaluations of selected SCS variants given in theSupporting Information. The performance of these methods will be evaluated with respect to the reference energy profiles computed at the CASSCF and MRCISD+Q levels, as previously presented in the earlier contributions of this series.
2. METHODS
2.1. Preface on the ADC Methods. Since ADC methods are linear-response methods that yield excitation energies directly from the polarization-propagator formalism, an ADC level of theory for the electronic ground state does not exist. Following the derivation of ADC approaches via the intermediate-state-representation (ISR) formalism,149 the ADC(2) matrix representing the shifted Hamiltonian as well as the intermediate-state basis is constructed with respect to the MP2 ground-state energy and wave function, respectively. The same holds for the higher-order ADC(n) schemes and their relation to the corresponding MPn ground state. Accordingly, the corresponding MP ground-state energy is the most natural choice for the calculation of total energies, and a corresponding expression for the total energy of an excited state within the ISR-derived ADC schemes has already been provided in ref149. For this reason, in studies employing ADC methods, the electronic ground state is usually described by the MP2 (in the case of ADC(2)-s and ADC(2)-x) or MP3 (in the case of ADC(3)) method. Total energies of excited states are given as the sum of the underlying MP ground-state total energy and the ADC excitation energy derived from linear-response theory. We adopt the following convention for the f igures presented in this work: for the potential-energy profiles computed with an ADC method, the ground-state curve or surface is labeled as MP, whereas the excited-state curve or surface is labeled as ADC.
2.2.Ab Initio Methods and Quantum-Chemistry Codes. The Turbomole 6.6 program package39,150 was used for the calculations employing the approximate coupled-cluster method of second order (CC2), the spin-component-scaled variant of the CC2 method (SCS-CC2), and the scaled-opposite-spin variant of CC2 (SOS-CC2).150For the two spin-scaled CC2 methods, the default scaling factors of css=1/3and cos=6/5for SCS-CC2 and css= 0 and cos= 1.3 for SOS-CC2 were used. Throughout all calculations, the basis set 6-31G* with Cartesian d functions was used as well as the resolution-of-the-identity (RI) approxima-tion,40the latter of which requires the use of an auxiliary-basis set. Since Turbomole does not provide an optimized auxiliary-basis set for RI calculations with the basis set 6-31G*, we used the auxiliary-basis set for the basis set def2-SV(P) instead (the basis sets 6-31G* and def2-SV(P) exhibit very similar contraction schemes). Also, the frozen-core approximation was used, in which the 1s orbitals of the first-row atoms are frozen at the Hartree−Fock level. The results obtained along selected pathways using the SCS variants of CC2 and ADC(2)-s available in Turbomole are shown inFigures S28−S34in the Supporting Information.
The Q-Chem 4.2 program package85 was used for the calculations employing the algebraic-diagrammatic-construction (ADC) scheme for the polarization propagator of second order in the strict and extended variants, that is, ADC(2)-s and ADC(2)-x,87as well as the SOS variants of these two methods, SOS-ADC(2)-s and SOS-ADC(2)-x.132For SOS-ADC(2)-s, the scaling parameters cos= 1.3 and coscoupling= 1.17 were used, whereas for SOS-ADC(2)-x, the parameters cos= 1.3, coscoupling= 1.0, and cx = 0.9 were used. For the calculations at the third-order ADC(3) level,88,151a developers’ version of the adcman module within the Q-Chem 4.21 package was used.86Again, the 6-31G* basis set was used throughout all calculations. The RI approximation was not used.
For ADC methods, the reference state, that is, the electronic ground state, is treated at the respective order of Møller−Plesset Journal of Chemical Theory and Computation
6-31G*). The MRCISD branching-space vectors were obtained by optimizing the S1/S0minimum-energy conical intersection of PSB3 analogously to the description in the paper by Nikiforov et al.,15albeit using a full-π active space of (6,6) and the basis set 6-31G* for consistency with this series of papers. This calculation was performed in Columbus 7.153The CASSCF and MRCISD branching-space vectors were orthogonalized via the Yarkony procedure154 and normalized before they were used for the construction of the circles and 2D scans around the conical intersection. A comparison of the CASSCF- and the MRCISD-optimized minimum-energy conical intersection as well as the orthonormalized CASSCF and MRCISD branching-space vectors is shown inFigure S1 in the Supporting Information. The gradient-difference vectors for the CC2 and the ADC(2)-s methods were evaluated by subtraction of the gradient of the reference state from the gradient of the response state, which were obtained in Turbomole.
Throughout all figures, the energies are given in kcal/mol relative to the energy of trans-PSB3, which is the more stable isomer of PSB3.
2.3. Reference Reaction Paths. We use the ground- and excited-state pathways introduced in earlier contributions of this benchmark series,27,31,32the structures of which were optimized or constructed at the SA2-CASSCF(6,6)/6-31G* level. The BLA pathway scans the bond-length-alternation coordinate (cf.Figure 3a) and connects the transition state for the charge-transfer isomerization path (TSCT), the S1/S0conical intersection driving the photoisomerization process, and the transition state for the diradicaloid isomerization path (TSDIR) (cf. Figure 3b). The charge-transfer minimum-energy path (MEPCT) connects cis-PSB3, TSCT, and trans-PSB3 (and is centered in the region near TSCT), whereas the diradicaloid minimum-energy path (MEPDIR) connects cis-PSB3, TSDIR, and trans-PSB3 (and is centered in the region near TSDIR, cf.Figure 3b). These two pathways involve the hydrogen out-of-plane (HOOP) motion (cf.Figure 3a). The composite pathway in the S1excited state is composed of three pathways (cf. Figure 3c): the cis-side minimum-energy path (MEPcis), which connects cis-PSB3 with a cisoid conical intersection; the conical-intersection-seam pathway, which involves the HOOP motion and connects the cisoid conical intersection (CIcis), the conical intersection (CIBLA), and the transoid conical intersection (CItrans); and the trans-side minimum-energy path (MEPtrans), which connects trans-PSB3 with the transoid conical intersection (CItrans). Apart from these pathways, we also test each method along a circle centered at a selected point on the conical-intersection seam (cf.
Figure 2), which was determined by the S1/S0crossing point along the BLA scan separately for each method, except for the CASSCF and MRCISD methods, for which we used the optimized minimum-energy conical intersections instead. Around this geometry, a circle with a radius of 0.02 Å was constructed for each method in increments of 10° by using the orthonormalized branching-plane vectors determined at the
CASSCF level. (For the MRCISD+Q method, we used a radius of 0.01 Å because a radius of 0.02 Å resulted in a number of artifacts. For the CC2 method, we used a radius of 0.03 Å because a radius of 0.02 Å resulted in a discontinuous energy profile due to unconverged points. Furthermore, we used afiner increment of 1° for the CC2 method.) For comparison, we also constructed the circles for the CASSCF method using a smaller radius of 0.002 Å as well as using MRCISD branching-plane vectors, which is shown inFigure S18in the Supporting Information. For the construction of the 2D-surface plots in the branching plane, the same crossing points and orthonormalized branching-plane vectors were used. These scans were constructed by displacing the geometry of the crossing point by up to 0.05 Å in each direction. For the CC2 method, a roughly three timesfiner grid was used than for the other methods. For comparison, we also constructed these 2D scans for select methods using the orthonormalized branching-plane vectors computed at the MRCISD level of theory (cf. Figure S18 in the Supporting Information). The reader interested in the technical details on the construction of the various pathways is referred to the original papers.27,31,32
2.4. Charge-Transfer Character. In its ground-state cis or trans equilibrium geometry, PSB3 is a cation with the positive
Figure 3. Schematic representations of relevant intramolecular coordinates and reaction paths. (a) The bond-length alternation (BLA) mode, the hydrogen out-of-plane (HOOP) mode, and the torsion mode; (b) S0and S1CASSCF energy profiles along the BLA, MEPCT, and MEPDIRpathways as well as stationary points involved in these pathways given on the x-axis. The BLA path intersects TSCT, the conical intersection (CI), and TSDIR; the MEPCTpath connects TSCT with cis- and trans-PSB3; the MEPDIRpath connects TSDIRwith cis- and trans-PSB3. (c) S0and S1CASSCF energy profiles along the composite S1path connecting the MEPcispathway, the CIcis−CIBLA−CItransseam (CI seam), and the MEPtranspathway.
charge localized mainly on the Schiff-base nitrogen atom (on the iminium fragment). When PSB3 develops charge-transfer character, the positive charge translocates partially or fully across the central double bond to the other side of the molecule (on the allyl fragment). To quantify the charge transfer, we compute the charge-transfer character by summing the Mulliken charges of all the atoms of the allyl fragment (H2C5C4H−C3H; cf.
Figure 1for the numbering of atoms). Since the computation of Mulliken charges at the MP2 and MP3 levels is not yet implemented in Q-Chem, we show the charge-transfer character only for those methods for which Mulliken charges are available in Turbomole, that is, the CC2 and SOS-CC2 methods as well as the ADC(2)-s and SOS-ADC(2)-s methods (since we consider only the charge-transfer character of the reference state, the Mulliken charges computed for the latter two methods correspond to the Mulliken charges at the MP2 and SOS-MP2 levels, respectively). Since Mulliken charges cannot be computed at the MRCISD+Q level, the charge-transfer character was determined at the MRCISD level instead.
2.5. Nonparallelity Errors. We evaluate nonparallelity errors (NPEs) of a given method as a measure for the deviation of the energy profile obtained with this method from the energy profile obtained with a reference method along a given pathway. We use the energy profiles obtained with the MRCISD+Q method for reference. NPEs are computed by subtracting the minimum-energy deviation from the maximum-energy devia-tion, where the energy deviations between a method and the reference method are evaluated at each point of a given pathway. A small NPE, therefore, corresponds to an energy profile that runs fairly parallel to the energy profile of the reference method, whereas a large NPE hints at a deviation in the shape of the potential-energy surface and thus to a large extent of non-parallelity in the energy profiles along a given pathway obtained with two different methods.
2.6. Approximate Geometry Optimization of Mini-mum-Energy Conical Intersections at the CC2 and ADC(2)-s/MP2 Levels. For the approximate optimization of the minimum-energy conical intersection driving the photo-isomerization of the central double bond of PSB3, we used the program CIOpt developed by Levine, Coe, and Martı́nez.148The underlying algorithm employing a penalty function allows the approximate optimization of a minimum-energy conical intersection for any electronic-structure method capable of determining the energy of electronically excited states. The program CIOpt was interfaced with Turbomole to optimize the minimum-energy conical intersection of PSB3 at the CC2 as well as at the mixed ADC(2)-s/MP2 level of theory. The same settings regarding the basis set and the auxiliary basis set were used as specified above. Note that from all of the ADC variants tested in this work only the ADC(2)-s variant is implemented in Turbomole.
3. RESULTS
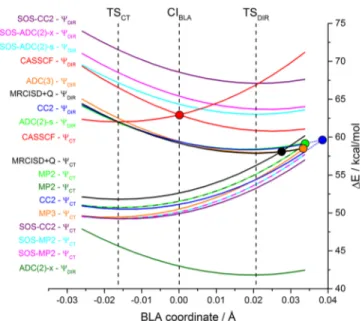
3.1. BLA Path. The energy profiles along the bond-length-alternation (BLA) scan are shown inFigure 4. The BLA scan intersects, in that order, TSCT, CIBLA, and TSDIR, whose positions are shown by vertical dashed lines. As already pointed out in a previous paper of this series, the CASSCF method overestimates the energy of the two transition states, TSCTand TSDIR, and gives an incorrect energy order by predicting TSDIRto be more stable than TSCT. These shortcomings can be attributed to the lack of dynamical correlation in the CASSCF method. Upon inclusion of dynamical correlation using the MRCISD+Q reference
method, the peaked CASSCF conical intersection CIBLAlocated in the middle of the BLA pathway moves toward TSDIR and changes its topography toward a sloped conical intersection, as shown by the curve for the MRCISD+Q method. Also, the energy order of TSCTand TSDIRis reversed. These effects have been rationalized in detail in a previous contribution of this benchmark series.27
Comparing the energy of theΨCTcurves of the CC2 and ADC methods with the MRCISD+Q reference values reveals that all CC2 and ADC methods tend to slightly overstabilize the charge-transfer state, ΨCT, but otherwise run fairly parallel to the MRCISD+Q curve. The effect of overstabilization of ΨCT is smallest for ADC(2)-s and ADC(2)-x and slightly larger for ADC(3), SOS-ADC(2)-s, and SOS-ADC(2)-x.
In the case of the diradical state,ΨDIR, we see a higher degree of variability in the energy among the different CC2 and ADC variants. ΨDIR exhibits open-shell character and, hence, a significant multiconfigurational character. The dramatic over-stabilization of ΨDIR by the ADC(2)-x method and, most importantly, the fact that the ADC(2)-x method reverses the energy order ofΨDIR and ΨCT shows that ΨDIR also exhibits significant double-excitation character, in contrast to ΨCT. The ADC(2)-x method overcompensates this effect and, hence,
Figure 4.Energy profiles (in kcal/mol relative to trans-PSB3) of CC2 and ADC methods including SOS variants along the BLA coordinate of PSB3. The curves are labeled at the left to distinguish diabatic potential-energy curves of mainly charge-transfer character (ΨCT) and covalent-diradical character (ΨDIR). S0and S1energies are given for the CC2 (blue), SOS-CC2 (purple), ADC(2)-s (green), SOS-ADC(2)-s (cyan), ADC(2)-x (olive), SOS-ADC(2)-x (magenta), and ADC(3) (orange) methods as well as for the CASSCF (red) and MRCISD+Q (black) methods for reference. S0 energies obtained for the ADC(2)-s and ADC(2)-x, as well as for the SOS-ADC(2)-s and SOS-ADC(2)-x methods, respectively, are equal (i.e., they correspond to the MP2 and SOS-MP2 levels, respectively) and are given as dashed lines. The positions of the transition states TSCTand TSDIRas well as the conical intersection intercepted by the BLA scan, CIBLA, are indicated by the vertical dashed lines in black. The approximate position of the surface crossings for the other methods is indicated by afilled circle. The surface crossing for the CC2 method is located slightly outside the original BLA pathway and was located by extrapolation of the original pathway (dotted blue lines). The surface crossings for the remaining methods are located further outside the original BLA pathway (on the extrapolated pathway) and are not shown.
underestimates excitation energies of excited states of double-excitation character, in contrast to excited states of single-excitation character. This is due to the, with respect to the singly excited configurations, unbalanced inclusion of doubly excited configurations at only the first order of perturbation theory in the formulation of the ADC(2)-x method (the singly excited configurations are included at second order).86,87Nonetheless, ΨDIRis well-described by CC2, ADC(2)-s, and ADC(3), whose energy profiles run fairly parallel and close to the MRCISD+Q values. On the other hand, it is obvious that the SOS variants of all tested methods, CC2, ADC(2)-s, and SOS-ADC(2)-x, dramatically overestimate the energy of ΨDIR, which is likely due to the failure of SOS methods to correctly describe a response state of multiconfigurational character.
The relative energies of ΨDIR and ΨCT determine the geometry, energy, and even the topography of the surface crossing CIBLA. As discussed in earlier work,
27
the MRCISD+Q surface crossing has a higher BLA value than that of the CASSCF crossing. It exhibits a sloped-intermediate topography, in contrast to the peaked topography of the CASSCF crossing. Wefind that the CC2 surface crossing has an even higher BLA value than that of the MRCISD+Q crossing, since CC2 slightly overstabilizesΨCT. In fact, the CC2 crossing lies slightly outside the original BLA path and was found by extrapolation of the original BLA pathway, that is, by generating new structures using the nuclear displacements of the BLA coordinate. This is similar to the results obtained at the EOM-CCSD level in an earlier benchmark study.28 The ADC(2)-s and ADC(3) surface crossings lie closer to that of MRCISD+Q and, thus, these methods perform better in this case than CC2. The other methods, on the other hand, show surface crossings that are significantly displaced with respect to the MRCISD+Q crossing, to such an extent that they do not appear in the range shown in
Figure 4. In fact, SOS-ADC(2)-x, SOS-ADC(2)-s, and SOS-CC2 show surface crossings at large BLA values (obtained by extrapolation of the original path) due to their destabilizing ΨDIR(these surface crossings have BLA values of 0.055, 0.055, and 0.07 Å, respectively). Quite differently, the surface crossing of ADC(2)-x is found at a negative BLA value (−0.04 Å) due to its dramatic overstabilization ofΨDIR.
The behavior of the CC2 method beyond the surface crossing, that is, for high BLA values obtained by extrapolation of the original BLA pathway, is shown inFigure 5. Beyond the surface crossing, the reference state, that is, the state which is computed as the electronic ground state, remains on theΨCTcurve, whereas the response state, that is, the excited state, remains on theΨDIR curve (cf.Figure 5a). This leads to the peculiar observation of
negative excitation energies, which one obtains beyond the surface crossing. This is analogous to what has been described by Martı́nez and co-workers for linear-response TDDFT.146 However, even though the surface crossing presents a case of strong ground-state multireference character, the CC2 method converges and does not exhibit any artifacts in this instance. The only discontinuities that we could identify are the Mulliken charges of the allyl and iminium fragments in the reference state, where we see a spike at the location of the surface crossing (cf.
Figure 5b) and in the dipole moments of the two states, which also exhibit a spike (cf.Figure 5c). We could not identify any obvious cause for the occurrence of these spikes.
3.2. MEPCTPath. The energy profiles and the charge-transfer character along the MEPCT path are shown inFigure 6a,b. As shown in part a, the CASSCF method overestimates the energy barrier at TSCT, which is corrected by inclusion of dynamical electron correlation, as shown for the MRCISD+Q method. All CC2 and MP methods underestimate the energy barrier with respect to the MRCISD+Q reference values. CC2 and SOS-MP2 give the lowest barrier heights at TSCT. Remarkably, the MP2 method comes closest to the reference value at the MRCISD+Q level. Away from the transition state, SOS-CC2 and CC2 underestimate the energy slightly, whereas SOS-MP2, MP2, and MP3 overestimate it. The S1energy profiles along the MEPCT scan are shown in Figure S2 in the Supporting Information.
The profiles of the charge-transfer character shown inFigure 6b show that the CC2 method reproduces the behavior of the MRCISD curve qualitatively best, although the charge-transfer character is slightly too low. Those methods that have been shown to overstabilize ΨCT with respect to the MRCISD+Q reference values in the BLA scan shown inFigure 4exhibit a broader charge-transfer region than that observed for the MRCISD values shown inFigure 6b. The SOS-CC2 method smears out the peak of the charge-transfer character over a larger region and falls off too slowly. The SOS-MP2 and MP2 methods deviate strongly from the MRCISD values: the region of strong charge-transfer character is too broad and falls off too slowly with increasing distance from the transition state. Exemplary for the linear-response methods, the decrease in the charge-transfer character of the CC2 reference state can be understood by recognizing the change in the molecularπ orbitals along the MEPCTpath. At TSCT, the HOMO and LUMO are fully localized on the iminium and allyl moieties, respectively. The same applies to the remainder of the π orbitals. This localization of the π orbitals results in a strong charge-transfer character. When the geometry of TSCT is displaced along the isomerization Figure 5.Behavior of the linear-response CC2 method along the BLA coordinate extended beyond the surface crossing by extrapolation of the original BLA pathway. (a) Energy profiles of the reference (black) and response (red) states. (b) Sum of Mulliken charges of the reference state for the allyl and the iminium fragment of PSB3. (c) Dipole moments (in D) of the reference (black) and response (red) states.
coordinate, the π orbitals develop an increasing level of delocalization over the entire molecule, which gradually reinstates the central double bond of PSB3 toward the planar ground-state minima. This delocalization of theπ orbitals results in decreasing charge-transfer character.
3.3. MEPDIR Path. The energy profiles and charge-transfer character along the MEPDIRpath are shown inFigure 7a,b. For the energy profiles, the same trends are observed as for those along the MEPCTpath. This is due to the fact that for all CC2 and ADC methods (with the exception of ADC(2)-x) theΨCTstate is stabilized with respect toΨDIR(cf.Figure 4) and therefore causes the character of the ground-state wave function of TSDIR to change from diradical (at the CASSCF level of theory) to charge transfer. Therefore, the MEPDIRpath, which was constructed at the CASSCF level of theory, passes through a region of charge-transfer character in the vicinity of the transition state TSDIR, and the profiles along the MEPDIRpath behave similarly to the ones along MEPCT. This is also reflected in the profiles for the charge-transfer character presented inFigure 7b, where wefind that CC2 and MP methods gain charge-transfer character, as opposed to
CASSCF and MRCISD, both of which retain diradical character at TSDIR.27
The charge-transfer character given in Figure 7b shows that the CC2 and MP2 methods as well as their SOS variants exhibit an inverted charge-transfer profile compared to those of CASSCF and MRCISD. This is due to the fact that the surface crossing is shifted so far along the BLA path that TSDIRis no longer located on the diradical state but, rather, on the charge-transfer state, which results in the strong charge-charge-transfer character at the TSDIRgeometry.
The S1energy profiles along the MEPDIRscan are shown in
Figure S3in the Supporting Information.
3.4. Composite S1Path. The S0and S1energy profiles along the composite S1 path obtained with CASSCF-constructed geometries are shown inFigure 8. The features of the CASSCF potential-energy surfaces and the MRCISD+Q-corrected surfaces are discussed in detail in ref 31. Here, we note that dynamical electron correlation introduced by MRCISD+Q causes an excited-state minimum to develop in the vicinity of the Franck−Condon region near cis- and trans-PSB3. We optimized these minima at the CASPT2 level of theory as part
Figure 6.(a) S0energy profiles (in kcal/mol) along the MEPCTpathway, which connects TSCT(in the middle of the plot) with cis- and trans-PSB3 (which lie outside the plotted region, at values of−0.54 and 0.65 Å· amu1/2, respectively). S0energies are given for the CC2 (blue), SOS-CC2 (purple), MP2 (green and olive), SOS-MP2 (cyan and magenta), and MP3 (orange) methods as well as for the CASSCF (red) and MRCISD+Q (black) reference methods. (b) Charge-transfer character along the MEPCTpathway for the CC2, SOS-CC2, MP2, SOS-MP2, CASSCF, and MRCISD methods.
Figure 7. (a) S0 energy profiles (in kcal/mol) along the MEPDIR pathway, which connects TSDIR(in the middle of the plot) with cis-and trans-PSB3 (which lie outside the plotted region, at values of−0.52 and 0.66 Å·amu1/2, respectively). The S
0energies are given for the CC2 (blue), SOS-CC2 (purple), MP2 (green and olive), SOS-MP2 (cyan and magenta), and MP3 (orange) methods as well as for the CASSCF (red) and MRCISD+Q (black) reference methods. (b) Charge-transfer character along the MEPDIRpathway for the CC2, SOS-CC2, MP2, SOS-MP2, CASSCF, and MRCISD methods.
of a previous contribution.31We alsofind that the degeneracy at the CASSCF conical-intersection seam is split due to an unequal stabilization ofΨCTandΨDIR, yet the extent of splitting varies among the various methods (as already observed inFigure 4). Also, all methods yield a minimum on the conical-intersection seam, that is, the conical intersection CIBLA, which is located in the center of the conical-intersection seam, is, as it should be, an actual minimum on the conical-intersection seam.
InFigure 8, we also notice a wide variability in the S1relative energies of the different CC2, ADC, and multiconfigurational methods, with ADC(2)-x giving the lowest excited-state energy with respect to the ground state and CASSCF giving the highest energy (due to the missing dynamical electron correlation). All ADC variants give lower excited-state energies than MRCISD+Q, whereas CC2 and SOS-CC2 give more similar energies to those of MRCISD+Q (although in the case of SOS-CC2 it deviates significantly at the conical-intersection seam). We also notice that the shape of the excited-state potential-energy surfaces near the Franck−Condon regions varies markedly for the different methods. For instance, CC2 and SOS-CC2 give a well-defined minimum close to the Franck− Condon regions of cis- and trans-PSB3, similar to MRCISD+Q. ADC(3) also displays a minimum, although a shallower one. However, ADC(2)-s, ADC(2)-x, ADC(2)-s, and SOS-ADC(2)-x show no minimum, similar to CASSCF.
Looking at the complete S1path, the energy profile of the CC2 method runs remarkably parallel to the MRCISD+Q energy profiles. The SOS-CC2 method runs parallel to the MRCISD+Q profile in the MEPcisand MEPtransparts of the scan, yet it deviates significantly in the CIseam part. All ADC methods deviate significantly from the entire S1energy profile of the MRCISD+Q method in the excited state, although the ADC(2)-s method seems to consistently underestimate the reference values, albeit running fairly parallel to them. For the S0state, on the other
hand, all CC2 and MP methods agree well with the MRCISD+Q profile.
In an earlier study,31we also optimized the same composite S1 path comprising MEPcis, the conical-intersection seam, and MEPtransat the CASPT2 level of theory. For the sake of brevity, we do not discuss CC2 and ADC energy profiles along this path here. We refer the interested reader to Figure S4 in the Supporting Information as well as to ref31.
Table 1shows the nonparallelity errors (NPEs) of the energy profiles obtained with various methods along the S1composite
path constructed of geometries obtained with the CASSCF method against the energy profile of the reference MRCISD+Q method. In detail,Table 1provides the NPEs along the full S0 path, along the full S1 path, along the S0 conical-intersection seam, and along the S1 conical-intersection seam. Since MRCISD+Q is chosen as the reference method, the NPEs for this method vanish throughout all the pathways. The comparison
Figure 8.Energy profiles (in kcal/mol) along the composite CASSCF S1pathway, which is composed of the MEPcis, the conical-intersection (CI) seam, and the MEPtranspathways. S0and S1energies are given for the CC2 (blue), SOS-CC2 (purple), ADC(2)-s (green), SOS-ADC(2)-s (cyan), ADC(2)-x (olive), SOS-ADC(2)-x (magenta), and ADC(3) (orange) methods as well as for the CASSCF (red) and MRCISD+Q (black) reference methods. S0 energies obtained for the ADC(2)-s and ADC(2)-x methods, as well as for the SOS-ADC(2)-s and SOS-ADC(2)-x methods, respectively, are equal (i.e., they correspond to the MP2 and SOS-MP2 levels, respectively) and are given as dashed lines.
Table 1. NPEs (in kcal/mol) for Various Methods along the Full S1CASSCF Path and along the Conical-Intersection Seam composite path composite path CI seam CI seam
method S0NPE S1NPE
S0 NPE S1 NPE MRCISD+Q 0.0 0.0 0.0 0.0 CASSCF 11.4 6.0 1.6 1.2 CC2 2.6 5.9 0.3 0.2 SOS-CC2 3.0 11.2 0.2 0.2 ADC(2)-s/MP2 3.8 7.9 0.4 0.5 SOS-ADC(2)-s/SOS-MP2 4.8 16.8 0.4 0.2 ADC(2)-x/MP2 3.8 13.1 0.4 0.1 SOS-ADC(2)-x/SOS-MP2 4.8 20.9 0.4 0.5 ADC(3)/MP3 5.5 10.8 0.5 0.1
of the CC2 and SOS-CC2 values reveals that CC2 gives the smallest NPE for the full S0pathway among all tested methods (2.6 kcal/mol), whereas the NPE of the SOS-CC2 method is slightly larger (3.0 kcal/mol). For the full S1pathway, on the other hand, CC2 gives the lowest NPE, whereas SOS-CC2 gives a large NPE. The latter arises from the fact that SOS-CC2 runs close to the MRCISD+Q reference profile in the MEPcis and MEPtransparts of the composite pathway, but it is shifted about 9 kcal/mol in the conical-intersection-seam part, which is likely due to the failure of SOS methods to describe multiconfigura-tional response states. The consistent parallelity of the SOS-CC2 method within the conical-intersection seam is demonstrated by the small NPE of 0.2 kcal/mol within the conical-intersection seam, which is equal to the NPE of CC2. This means that although the SOS-CC2 method overestimates the MRCISD+Q reference values by 9 kcal/mol within the conical-intersection seam, it does so consistently and the profile is therefore fairly parallel to the MRCISD+Q profile. The ADC(2)-s/MP2 method shows only slightly larger NPEs for the full S0and S1 paths than those for CC2 (3.8 and 7.9 kcal/mol), which reinforces the picture discussed above, where the ADC(2)-s S1 curve is almost perfectly parallel to the MRCISD+Q curve. Both SOS-ADC(2) methods as well as ADC(2)-x and ADC(3) show a large NPE for the S1path. The ADC(2)-x method consistently underestimates the S1energy, but the level of overstabilization varies from the MEP paths to the conical-intersection seam, which results in the largest NPE for the full S1path (20.9 kcal/ mol).
S0−S1energy gaps for the various methods atfive important geometries, that is, cis-PSB3, trans-PSB3, CIcis, CIBLA, and CItrans, are given inTable S1in the Supporting Information.
3.5. Circular Path around the Surface Crossing. The energy difference along the circles around the conical intersection or surface crossing constructed for the optimized conical intersections (in the case of CASSCF and MRCISD) or approximate surface crossings (in the case of the linear-response methods) using the orthonormalized branching-plane vectors (which were determined at the CASSCF level) is shown in
Figure 9. The CASSCF method shows the physically correct behavior for a true conical intersection: the energy difference between the two adiabatic states oscillates between 2.3 and 3.4 kcal/mol, which hints at an elliptical topography of the conical intersection.155Figure S5in the Supporting Information shows that both the energies of the two states and the charge-transfer character of the ground state oscillate. This is due to the fact that while moving along the circle the electronic character of the ground state changes from diradical to charge-transfer and back. The MRCISD method also shows the correct behavior for a conical intersection. The energy-difference profile suggests that the topography of the MRCISD conical intersection is different from that of the CASSCF conical intersection. The individual state energies for the MRCISD method and the charge-transfer character of the ground state are shown in Figure S6 in the Supporting Information. The MRCISD+Q method does not yield the correct intersection topology because the Davidson correction affects only the energies but not the interstate couplings. This is why a vanishing S0−S1energy gap is found for MRCISD+Q.
All ADC methods behave the same way: the three ADC methods shown in panel (a) reach a vanishing energy difference twice each, which is also true for the two SOS variants shown in panel (b). This is due to the fact that the S1state is described at the ADC level of theory, whereas the S0state is described at the
MP level of theory. The missing nonadiabatic coupling between S1and S0leads to a linear intersection topology, which presents in the form of two vanishing S0−S1energy gaps along the circle. The complete absence of any interaction between the reference state and the response state for the ADC(2)-s method is also evident fromFigures S10 and S11in the Supporting Information: the charge-transfer character of the reference state remains constant, and the dipole moments of the two states barely vary. While the CC2 method shows two distinct discontinuities, which result from the reference state and the response state switching energetic order, it nevertheless suggests empirically
Figure 9.S1−S0energy difference (in kcal/mol) along a circle centered around the surface crossing of PSB3. (a) Energy differences for the CC2 (blue), ADC(2)-s (green), ADC(2)-x (olive), and ADC(3) (orange) methods as well as for the CASSCF (red), MRCISD (pink), and MRCISD+Q (black) reference methods. (b) Energy differences for the SOS-CC2 (purple), SOS-ADC(2)-s (cyan), and SOS-ADC(2)-x (magenta) methods as well as for the reference methods. The approximate location of the surface crossing was determined for the response methods and for the MRCISD+Q method by locating the crossing point along the BLA scan (cf. full circles shown inFigure 4). For those methods that did not yield a crossing point in the original BLA scan, the BLA path was extrapolated for the determination of the crossing point. For the CASSCF and MRCISD methods, the optimized minimum-energy conical intersections were used instead. These approximate or exact geometries for the surface crossings were used for the construction of the 36 geometries in increments of 10° located on a circle spanned by the orthonormalized g and h vectors determined at the CASSCF level. For the CC2 method, 360 geometries were constructed in increments of 1°. A crossing of the two states along the circle results in a vanishing energy difference and is highlighted by black circles. The discontinuities observed for the SOS-CC2 method are due to a few points along the circle for which the calculations did not converge.
that the CC2 method describes a seemingly true conical intersection due to the nonvanishing energy gap. The strong interaction between the reference and response states is also indicated by the large variation of the charge-transfer character of the reference state shown in Figure S8 in the Supporting Information.Figure S9shows the strong variation in the dipole moments of the two states. Artifactual spikes at the points where the two states switch in energetic order are also observed. The variations in the charge-transfer character and in the dipole moments, which serve as diagnostics of the wave-function character, also suggest that the CC2 method describes continuously varying wave functions around the surface crossing,
which is indicative of a conical intersection. For the SOS-CC2 method, we did not succeed in finding a radius for which we could converge the entire circular pathway (cf.Figure 9b). Close to the two areas along the circle where the excitation energy of the response state becomes negative, the SOS-CC2 method does not converge (in contrast to the CC2 method). However, also for the SOS-CC2 method the energy gap never vanishes.
The energy profiles along the circular paths of the S0and S1or for the reference and response states, respectively, which were used for the computation of the energy differences shown in
Figure 9, are shown in Figures S5−S16 in the Supporting Information. The reader should note the switch in the energetic
Figure 10.Energy profiles (in kcal/mol) of the S0and S1adiabatic potential-energy surfaces in the 2D branching space of the conical intersection of PSB3 (note that the energy scales are different for each plot). The g vector corresponds roughly to the BLA coordinate, whereas the h vector corresponds roughly to the isomerization coordinate (cf.Figure S1). The grids were constructed by displacing the geometry of the optimized minimum-energy conical intersection (in the case of CASSCF and MRCISD) or of the approximate surface crossing determined via the BLA scan shown inFigure 4(in the case of the linear-response methods) up to 0.05 Å in each direction along the orthonormalized g and h vectors (which were determined at the CASSCF level except for MRCISD, for which we used the vectors determined at the MRCISD level). For each method, the plot is shown from two different perspectives. For the CC2 method, a roughly three times finer grid was used and a few points are missing due to nonconvergence.
order between the reference and response states observed for the CC2 and ADC methods (cf. Figures S8, S10, and S12−S16). Also, for the CASSCF method, we compare the effects of constructing a circle around the surface-crossing point determined by the BLA scan (cf. Figure 4) and around the CASSCF-optimized minimum-energy conical intersection, which is shown inFigure S17. We also compare the effects of using the orthonormalized CASSCF or the orthonormalized MRCISD branching-space vectors for the CASSCF energy profiles along the circle. Finally, we compare the effect of different radii of 0.02 and 0.002 Å for the CASSCF energy profiles. The latter two comparisons are shown inFigure S18. The circular pathways obtained in these various ways yield qualitatively the same results as those shown inFigure 9.
3.6. 2D Scans along the Branching Plane. The energy profiles of the 2D potential-energy surfaces constructed in steps of 0.01 Å in the branching plane spanned by the two orthonormalized branching-plane vectors of the optimized S1/S0conical intersection or approximate S1/S0surface crossing of PSB3 are shown inFigure 10for the various methods from two different perspectives. (The plots for the SOS variants of the CC2, ADC(2)-s, and ADC(2)-x methods are shown inFigure S19 in the Supporting Information.) The branching-plane vectors were determined at the CASSCF level of theory by optimizing the minimum-energy conical intersection (except for the MRCISD method, for which we used the MRCISD branching-plane vectors instead). The CASSCF method yields a peaked conical intersection of proper topology, that is, a true conical intersection, which exhibits a degeneracy inside the branching plane at a single point only. This is consistent with the correct dimensionality of a conical intersection of 3N− 8. Upon distortion of the geometry of the conical intersection along the branching-space vectors, the energies of the intersecting potential-energy surfaces split. None of the other methods shown inFigure 10yields such a peaked conical intersection. In contrast to the CASSCF conical intersection, the MRCISD conical intersection shows a sloped-intermediate topography. This is due to the shifting of the position of the curve crossing to higher BLA values, as already shown inFigure 4.
The charge-transfer character of the wave function of the S0 and S1states computed at the MRCISD level is shown inFigure S20in the Supporting Information. It shows the rapid transition of the ground-state wave-function character from a diradical character to a charge-transfer character at the conical intersection along the direction of the g vector (cf.Figure S20a and b) and the reversed behavior for the excited state (cf.Figure S20c). When followed adiabatically through the surface crossing, the ground and excited states exhibit an opposite wave-function character, that is, the ground state evolves from a diradical to a charge-transfer wave function, whereas the excited state evolves from a charge-transfer to a diradical wave function (cf. Figure S20d). This behavior is a manifestation of the so-called geometric-phase effect, which is the signature property of a true conical intersection.156
InFigure 10, the CC2 method shows a splitting of the energy along both the g and h vectors, although the branching of the two potential-energy surfaces is shallower than it is for MRCISD. It also shows a sloped-intermediate topography similar to MRCISD. As shown in Figure S19 in the Supporting Information, SOS-CC2 gives a qualitatively similar picture, although the splitting becomes even shallower. These observa-tions confirm the conclusions drawn from the circular path around the surface crossing shown inFigure 9, which did not
show a state crossing for the CC2 method, suggesting that this method yields a seemingly true S1/S0 conical intersection. However, note that both CC2 and SOS-CC2 show irregularities near the surface crossing, which, although difficult to spot in
Figures 10andS19, can be clearly observed along the circular path around the surface crossing shown inFigures 9,S8, and S14.
Figure S21in the Supporting Information shows the two CC2 potential-energy surfaces from Figure 10 divided up into the reference and response states. Analogously to what has been shown for the extended BLA scan inFigure 5,Figure S21shows that the reference state becomes the adiabatic S1state in some regions of the branching plane (that is, it becomes higher in energy than the response state). Moreover, it is apparent from
Figure S21that numerous artifacts occur in the vicinity of the surface crossing, with the response state behaving particularly erratically. Interestingly, these artifacts do not occur along the h = 0.00 Å isoline, for which both the reference and response states behave smoothly. Since the center of this 2D plot is the crossing point determined via the BLA scan (cf.Figure 4), the h = 0.00 Å isoline corresponds to the picture shown inFigure 5a. (Note that for the generation ofFigure 5a the pure BLA motion was used, whereas the nuclear-displacement vectors of the CASSCF-determined branching-plane vectors were used for the generation of the 2D scans; hence, the motion along the g vector can contain minor contributions from other molecular motions.) This behavior suggests that the artifacts are introduced by displacing the CC2 crossing point along the h vector, which corresponds to the isomerization motion of the central double bond of PSB3. Unfortunately, we cannot recognize any physical cause for these artifacts. The four frontier molecular orbitals HOMO− 1 to LUMO + 1, which are all π orbitals, remain continuous (that is, they do not change in energetic order) throughout the entire 2D grid. The charge-transfer character of the CC2 reference state along the branching space is shown in
Figure S22 in the Supporting Information. It shows that the wave-function character of the CC2 reference state changes twice from a strong transfer character to a weaker charge-transfer character upon a full revolution around the surface crossing, which indicates a significant change in the wave function when traversing around the crossing point. However, one has to note that the reference state becomes the adiabatic S1 state in some regions of the branching space, in which case the wave-function character of the excited state is depicted.
All ADC methods yield a linear topology for the surface crossing: the degeneracy is retained along the direction of the h vector. This observation confirms the conclusions drawn from the circular paths shown inFigure 9, which shows that the states cross twice. Thus, the ADC methods yield a (3N − 7)-dimensional intersection space and linear surface crossings. The reader should note that previous theoretical analyses concluded that ADC methods should be able to describe a conical intersection between excited states, whose excitation energies are obtained from a Hermitian Jacobi matrix, physically correctly.42,86,87 Here, however, the S1/S0 surface crossing, which is computed with an ADC method, is, in fact, and as already mentioned in theIntroduction, described at two different levels of theory: the response state is described at the ADC level of theory, whereas the reference state is described at the MP2 or MP3 level of theory instead. The description of the two intersecting potential-energy surfaces with two different electronic-structure methods, that is, one method for the description of the excited-state and another method for the description of the ground-state potential-energy surface, means Journal of Chemical Theory and Computation
to the positive BLA region (where all the other surface crossings are found).
The effect of using MRCISD branching-space vectors instead of CASSCF branching-space vectors for the construction of the 2D grids for the CASSCF, CC2, and ADC(2)-s methods is shown inFigure S23in the Supporting Information. It is obvious that the differences are minor. This is rationalized by the comparison of the orthonormalized CASSCF and MRCISD branching-space vectors shown inFigure S1of the Supporting Information: these vectors are, apart from their reversed sign, almost equal. Figure S23 also shows the 2D plot for the MRCISD+Q method, which shows the expected signs of irregularities close to the point of degeneracy: the degeneracy is not found for a single point only, but multiple points in close vicinity to the crossing point show a vanishing energy gap. These artifacts are, as already mentioned above, caused by the Davidson correction.
One may wonder whether it is appropriate to apply the branching-space vectors obtained at the CASSCF or MRCISD level for the approximate CC2 or ADC surface crossings to construct the circles and 2D grids around the surface crossing. In principle, these vectors have to be very similar to the method-specific CC2 or ADC branching-space vectors because at a conical intersection (or surface crossing in the case of ADC) one cannot observe an energy splitting along two (or one) nuclear-displacement vectors unless these vectors contain components of the exact branching-space vectors. Any nuclear displacement, which is not a component of a branching-space vector, moves the system along the intersection seam and thus no splitting of the degeneracy can be observed. If, for example, the CASSCF or MRCISD branching-space vectors were completely different from the method-specific CC2 branching-space vectors, then one would observe either a linear splitting or no splitting at all. While we have no means to directly compute the nonadiabatic-coupling vector for the CC2 method at the moment, we can, however, compute the gradient-difference vector to make a comparison to the CASSCF and MRCISD vectors. Thus, we computed the gradient-difference vector for the CC2 method by subtracting the reference-state energy gradient from the response-state energy gradient computed at the approximate point of surface crossing determined by the BLA scan. The result is shown inFigure 11. The obtained CC2 gradient-difference vector (cf. Figure 11c) agrees very well with one of the branching-space vectors obtained via the CASSCF and MRCISD optimizations of the minimum-energy conical intersection (cf. Figure 11a,b). Surprisingly, however, it agrees with the branching-space vector that was obtained as the nonadiabatic-coupling vector in both the CASSCF and MRCISD optimizations of the minimum-energy conical intersection. However, as has been shown in the seminal paper by Atchity, Xantheas, and Ruedenberg, the g and h vectors rotate, that is, exchange their character, upon a 90° rotation along a tiny loop around the conical intersection.157 Since the optimization of a minimum-energy conical intersection, in
general, never converges to the exact conical intersection, but instead close-by and thus on an imaginary loop around the exact conical intersection, it is a coincidence that both the CASSCF and MRCISD optimizations of the minimum-energy conical intersection ended up on a point close to the exact conical intersection where the g and h vectors exhibit the observed character. As a consequence, the fact that the CC2 gradient-difference vector compares to the nonadiabatic-coupling vector of CASSCF and MRCISD is merely coincidental.
3.7. D1and D2Diagnostics for the CC2 Method. The D1 diagnostic measures the extent of strong interaction of the Hartree−Fock reference wave function with singly excited determinants, whereas the D2 diagnostic measures the extent of strong interaction of the Hartree−Fock reference wave function with doubly excited determinants.158,159Since CC2 is a single-reference method, it is, strictly speaking, adequate only for describing molecular systems with a single-reference ground state, that is, an electronic ground state that is dominated by a single determinant. A large D1 or D2 value indicates a strong multireference character of the electronic ground state and thus hints at the possibility that the CC2 method may not be appropriate to describe the system at hand. Köhn and Hättig concluded that a D1value of up to 0.15 and a D2value of 0.25 is acceptable for the CC2 method to be an adequate method for the description of a given electronic system.41 The D1 and D2 diagnostics can be evaluated for any linear-response method and serve the purpose of detecting hidden multireference character in the reference wave function.
Figure 12shows the values of the D1and D2diagnostics for the CC2 method along the branching space of the S1/S0surface crossing. These two diagnostics overshoot the previously suggested trust regions41 in large regions of the branching space. Low diagnostic values are found for the coordinate space generated by displacement of the geometry of the surface crossing along the g vector, which corresponds to the BLA motion. Large values are found for the coordinate space generated by displacement of the geometry of the surface crossing along the h vector, which roughly corresponds to the torsion motion of the central double bond.
To rationalize the behavior of the D1diagnostic for the CC2 method, we have to revisit some insight gained from CASSCF calculations.27We know from CASSCF calculations that at TSCT the electronic ground state consists almost purely of the closed-shell configuration, which constitutes the charge-transfer wave function at this geometry. When TSCTdecays toward cis- or trans-PSB3 by introducing torsion around the central double bond, the closed-shell configuration mixes with the diradical configuration (cf. Figure 1B of ref27). The introduction of this mixing with a singly excited determinant increases the multireference character
the (a) CASSCF and (b) MRCISD levels of theory, with the (c) CC2 gradient-difference vector computed for the surface-crossing geometry determined by the BLA scan (cf.Figure 4).