UNIVERSIT `A DEGLI STUDI DI CATANIA
Dipartimento di Ingegneria Elettrica, Elettronica ed Informatica
Dottorato di Ricerca in Ingegneria Informatica e delle Telecomunicazioni
XXVII Ciclo
GREEN SOLUTIONS FOR LTE-A MOBILE NETWORKS Ing. Anna Dudnikova
Coordinatore
Chiar.ma Prof.ssa V. Carchiolo
Tutor
CONTENTS
1 Introduction and Structure of the dissertation 3
1.1 Introduction . . . 3
1.2 Structure of this Dissertation . . . 5
2 Motivation and Related Work 7 2.1 Overview on Femtocell Technology . . . 7
2.2 Technical challenges that arise with femtocell deployment 10 2.3 Overview on Related Works . . . 11
3 Pilot Power Control Approach 17 3.1 Problem Formulation . . . 17
3.2 Network Model . . . 18
3.3 Algorithm Description . . . 20
3.3.1 Listen Mode . . . 21
3.3.2 Initial Power Setting . . . 22
3.3.3 Dynamic Power Adaption . . . 23
3.3.4 Stabilization State . . . 27
vi CONTENTS
4 Performance Evaluation 31
4.1 Simulation assumptions and performance metrics . . . 32
4.2 Determination of thresholds . . . 33
4.3 Evaluation of scalability and robustness . . . 36
4.4 Evaluation of Stability . . . 42
4.5 Evaluation of Energy Efficiency . . . 45
4.6 Multi–MBS environment . . . 51
4.6.1 N OISE U L estimation in multi–MBS scenario 52 4.6.2 wSIN R estimation in multi–MBS scenario . . . 52
5 Implementation issues 55 5.1 Network Listen Mode . . . 55
5.2 SINR . . . 56
6 Appendix 59 6.1 The noise level on the uplink frequency band . . . 59
6.2 Wideband Signal to Interference plus Noise Ratio . . . 61
6.3 Simulation parameters . . . 63
7 Conclusions 65 7.1 Concluding remarks . . . 65
7.2 Possible work extensions. . . 67
7.2.1 Hybrid Access mode for Femtocells. . . 67
7.2.2 Automation of setting of thresholds’ values. . . 67
Acknowledgements
First of all, I want to thank my supervisor, Prof. Daniela Panno. Thanks for all the support over the last three years, for advices, pa-tience, for being always ready to help. I consider it a privilege to have been working under your guidance.
I sincerely thank Antonio Mastrosimone who, in the course of the last year of my PhD program, is my friend, colleague and office mate that became an integral part of my workdays. Thank you for your contributions to this dissertation and all the support.
I would like to thank also all my colleagues (Giuseppe la Torre, Salvatore Monteleone, Gaetano Carmelo la Delfa, Daniela Ventura and others). Thanks for being always ready to help, to give an advice. I hope that we will keep in touch also in future.
Then I want to thank all my family. The last three years were not easy, but you always believed in me. In spite of thousands of kilometers between us I always felt your love, care and infinite support.
This last paragraph is dedicated to a person who over the last months is near me and helps me to never give up. Marco, thank you for it.
CHAPTER
ONE
INTRODUCTION AND STRUCTURE OF THE
DISSERTATION
1.1
Introduction
Femtocell concept has found a place in the architecture of LTE net-works as a costeffective solution designed to improve both coverage and user throughput in residential and enterprise environments (where mobile users spend most of time), as well as to offload data traf-fic from macrocell network. Femtocells are low–power, short–range plug–and–play cellular Base Stations (BSs) that operate in a licensed spectrum. FBSs are conceived to be installed by end consumers in ad–hoc manner, rather than being part of a planned deployment, and are connected to the service provider via the user’s existing broadband Internet access (e.g. digital subscriber line or coaxial cable).
Due to the simple installation and advantages in terms of high
4 Chapter 1. Introduction and Structure of the dissertation throughput a large diffusion of LTE femtocell devices in residential and enterprise environments is expected in the near future. This new network paradigm gives rise to some technical challenges to be ad-dressed. Such large–scale deployment of these additional BSs may lead to a substantial increase of energy consumption of the overall cel-lular network. Furthermore, femtocells are conceived to share the same spectrum. That may lead to a harmful co–tier interference, which de-teriorates the overall system performance. This challenge will become especially acute in dense deployments where femtocells are very likely to be overlapped. So for the success of femtocell networks the issues of energy consumption reduction and interference mitigation should be addressed conjunctly.
In this dissertation, a self–optimized coverage function for LTE femtocells embedded in a macrocell area is proposed. In our approach, each Femto Base Station (FBS) dynamically adapts its pilot power (and thus the coverage) in response to the detected on–site user activ-ity. In a low load scenario the FBSs, whose presence is not essential for the proper operation of the network, reside in a low power Listen Mode. In this way a relevant energy saving on entire femtocell net-work can be achieved. In a high–load scenario, FBSs dynamically cre-ate high capacity zones under interference constraints. This permits to improve system capacity and offload more traffic from the nearby macrocell and, in the same time, to minimize co–channel interference in the femtocell tier. The proposed algorithm is fully distributed and provides highly scalable, flexible and robust control without signaling overhead, that makes it suitable for a large–scale femtocell deploy-ment.
1.2. Structure of this Dissertation 5
1.2
Structure of this Dissertation
In Chapter 2 is presented a brief overview on femtocell technology, then the main issues that arise with dense femtocell deployment are listed. In the last section of Chapter 2 is presentet a State-of-the-art overview.
In Chapter 3 we state the objectives of this dissertation, intro-duce the network model being considered and then present a detailed description of the proposed pilot power control algorithm.
In Chapter 4 are presented simulation results. We set optimal values of thresholds that guarantee an optimal functioning of the al-gorithm, evaluate scalability and robustness of our proposal, stability under changing traffic conditions.Then we evaluate an energy saving potential of our power management scheme taking into account a typ-ical diurnal traffic pattern. Finally, we test the performance of the algorithm in a Multi–MBS environment.
In Chapter 4 we discuss the possibility of practical implementation of the algorithm.
Finally, in Appendix the formulas for calculation of decision– making parameters and system parameters are presented.
Appendix is followed by conclusion remarks, where we discuss also possible work extentions.
CHAPTER
TWO
MOTIVATION AND RELATED WORK
2.1
Overview on Femtocell Technology
Data traffic demand in cellular networks today is increasing at an exponential rate [1]. As the link efficiency is approaching its funda-mental limits, further improvements in system spectral efficiency are only possible by increasing the node deployment density, getting the transmitter and receiver closer to each other. Studies on wireless us-age show that more than 50 percent of all voice calls and more than 70 percent of data traffic originate indoors. Voice networks are engi-neered to tolerate low signal quality, since the required data rate for voice signals is low, on the order of 10 kb per second or less. Data net-works, on the other hand, require much higher signal quality in order to provide the multi–megabit per second data rates [2]. The indoor environment is characterized by high wall penetration losses and for these reasons high data rates are difficult to achieve.
8 Chapter 2. Motivation and Related Work For this reason the femtocell concept has found a place in the ar-chitecture of LTE networks as a cost–effective solution designed to improve both the coverage and the user throughput in residential and enterprise environments (where mobile users spend most of time), as well as the overall system capacity by offloading data traffic from macrocells.
Femtocells, also called home base stations, are short–range low– cost and low–power base network nodes deployed by end consumers for better indoor voice and data reception. Femtocells are typically equipped with omnidirectional antennas, and their transmit power is 100 mW or less. FBSs are typically connected to the mobile core network through the consumer’s own broadband connection (such as digital subscriber line (DSL) or cable modem) and therefore there is usually no backhaul transmission cost to the mobile operator.
Femtocells may be deployed on the same carrier as macrocells or on a dedicated carrier. If a dedicated carrier is used it would typically be at a higher frequency to deliver high data rates within a limited areaw-ithout causing excessive interference. If femtocells share a carrier with the macrocells, it is spectrally efficient, but careful attention needs to be given to the interference that may arise between the femtocells and the macrocells.
The main benefits of femtocells can be summarized as follows.
1) Improved coverage and capacity. Due to the short scale of distances between serving cell and terminals, femtocells can achieve a high signal to interference plus noise ratio (SINR), providing an improved data reception even when there is no existing macrocell signal or poor coverage.
2.1. Overview on Femtocell Technology 9 2) Cost benefits. For what is regarding subscribers, depending on the pricing policy mobile operators, special tariffs can be applied for calls placed under femtocell coverage. For what is regarding oper-ators, femtocell deployments will reduce the operating and capital expenditure costs, as deployment of femtocells will reduce the need for adding macro–BS towers.
3) Improved battery life. Improved battery life for mobile devices due to reduced trasmitter–receiver distance.
Femtocells generally operate in three different access modes: closed, open and hybrid. Crucially, the choice of the access mech-anism influences not only the operation of the femto–tier, but also the macro–tier, and in particular cross–tier interference mitigation and handover management.
1) Closed access mode. In this mode only specified registered users can communicate with the femtocell access point (FAP). An unreg-istered user cannot access the femtocell even if it has the strongest link with a particular FAP. This access mode is considered to be suited for residential deployments.
2) Open access mode. The open type access control is similar to a typical macrocell. Any subscriber located within the range of the open access FAP can establish a connection with it. This access mode is considered to be used widely for enterprise deployments, in malls, cafes and other public areas. The benefit is that a large amount of traffic can be offloaded from the macrocell network to the femtocells. This is especially useful at cell edges where macrocell coverage is generally poor.
10 Chapter 2. Motivation and Related Work 3) Hybrid access mode. Allows a limited number of unsubscribed users to gain network access alongside the existing registered users.
2.2
Technical challenges that arise with
femtocell deployment
The femtocell density in urban scenarios is expected to be very high. According to the researches of “Informa Telecoms & Media”, the 9.6 million femtocells in operation today make up 56% of all base stations globally and they will continue to outnumber all other types of cells with an expected 86% of the total BS market in 2016 [3]. Due to the massive deployment of these additional BSs the wireless network energy consumption might be significantly increased.
This problem becomes especially acute if the FBSs use a static pilot power configuration based on the peak traffic load, in which they are required to transmit pilot signals continuously and to do the related processing even when they are not serving any users. This would lead to considerable energy waste for entire femtocell network under low traffic load conditions. For these reasons, energy saving techniques need to be exploited by designing efficient mechanisms to enable sleep modes in FBSs.
Another significant issue arises from the fact that femtocells are typically configured to use the same licensed frequency band as macro-cells with which they coexist. This is spectrally efficient, but can cause interference issues that become more challenging in dense FBS deploy-ments, where femtocells are very likely to be overlapped. In such a scenario downlink transmissions from one femtocell suffer interference
2.3. Overview on Related Works 11
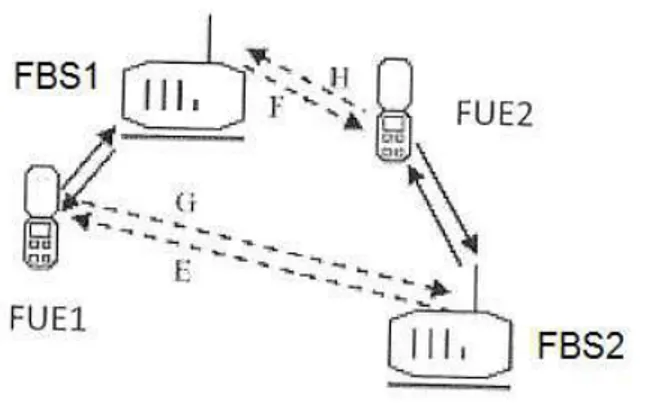
Figure 2.1: Femto–femto interference scenario.
from transmissions from another femtocell as shown in Fig. 2.1 by in-terference paths E and F. The increased level of inin-terference leads to a significant performance degradation of the overall femtocell network.
For the success of femtocell networks, both the issues of energy efficiency and interference mitigation should be addressed together optimizing the potential conflicts. It is important to note also that as the FBSs are conceived to be installed by terminal consumers without network pre–planning, the approaches that address the above techni-cal issues should be directed forward minimizing the intervention of network operator and users.
2.3
Overview on Related Works
In the literature some works have addressed co–tier interference and power consumption issues, proposing centralized or distributed pilot power control schemes and addressing the aforementioned technical challenges separately or in the aggregate.
12 Chapter 2. Motivation and Related Work Many studies (e.g. [4, 5, 6, 7]) deal with the method of pilot power control management that ensures a constant femtocell radius in the downlink irrespective of surrounding RF environment and deployment topology.
In the series of works [4, 5, 6] authors propose to save energy by turning into idle mode those femtocells which are not serving any active users. Idle FBS disable its pilot transmission and associated processing that represent the strongest contribution to the femtocell system power consumption.
Besides, three mechanisms of activation of idle femtocells are pro-posed. These mechanisms differ fundamentally in terms of the place-ment of activation control in the network, which can be either at the small cell, in the core network, or driven by the UE.
1) Small cell controlled sleep mode [4, 5, 6] Assuming the presence of sufficient underlay macrocell coverage, authors propose to equip FAPs with a low-power sniffer that permits the detection of the pres-ence of nearby MUEs. A UE, which is served by the MBS, likely transmits with high power, hence it is easy to detect. The detection threshold is computed at a femtocell by estimating the path loss to the MBS, such that UEs located at the femtocell edge can be correctly detected. Henceforth, when an UE is detected, the FAP switches to active mode and if the UE has the right to access the femtocell, the handover process is initiated. Otherwise, the FAP reverts to the switch-off mode. Simulation results show the proposed approach can lead to high energy gain. However the algorithm is adapted to the case when just one user is present in the femtocell coverage area. In high density scenarios the aggregate energy received from different sources of interference can cause false alarm events that affect detection
reli-2.3. Overview on Related Works 13 ability.
2) Core network controlled sleep mode [4, 5] In this scheme, the femtocell activity is managed by the core network that is in charge to transmit, via the backhaul, a specific wake-up control message. When a UE connects to the MBS, the core network exploits the knowl-edge about the UE and FAPs positions to verify if there is any UE-associated small cell in the same macrocell region. The core network driven method provides better activation control. Besides, this solu-tion has the advantage of distinguishing between registered UEs that can be served only by open/hybrid access femtocells. But this ap-proach implements a centralized decision that considers global knowl-edge on the status of the network that may be unfeasible in the next-generation femtocell deployments, where their location is random and unknown to the operator. Besides, the scheme it incurs control sig-naling over the backhaul to wake up small cells.
3) UE controlled sleep mode [4, 5] In this case the sleep mode con-trol is placed at the user’s side. A UE broadcasts the wake-up message in order to activate idle femtocells in its vicinity. This message could include identification information such that closed access femtocells wake up only for registered UEs. Idle FBSs are required to retain capability to receive the wake-up signal transmissions from the UE, and any time such signals are received, the transition to active state occurs. The UE-controlled scheme suffers mainly from two drawbacks. First, it increases UE battery consumption due to periodic broadcasts. Furthermore, it requires the specification of a robust physical/logical wireless control channel where the UE can send the wake-up message. In [7] a clustering based power saving scheme with fixed cell radius is proposed. The algorithm divides the femtocell network into clusters
14 Chapter 2. Motivation and Related Work by means of femto-gateway that assigns leader and members for every cluster. The leader is responsible for detecting active calls in its cluster coverage area and for coordination of the member FBSs, which in the absence of the active user can be switched off according to leader commands.
In [8] is proposed a distributed scheme of adaptive pilot power con-trol for FBSs which focuses on minimization of interference between residential femtocells and the outdoor macrocell.
The above mentioned power management schemes [4, 5, 6, 7, 8] have their own advantages and disadvantages. But the common fact is the absence of any coverage coordination between femtocells. This means that in dense heterogeneous deployments the coverage areas of adjacent femtocells can overlap causing a serious co-tier interference. In [9, 10, 11] adaptive power control schemes are presented which permit to overcome this issue.
In [9] is developed a distributed power control scheme for enterprise femtocell networks based on information exchange between neighbor-ing femtocells. The algorithm periodically adjusts femtocell’s pilot power to share system user load and minimize coverage holes and overlap. However, the energy saving issue is not addressed. In [10, 11] are introduced centralized approaches for dynamic power calibration which envisage a local femtocell management unit. In [10] the scheme includes UE-controlled sleep mode for FBSs in order to reduce power consumption. The FBS that receives the strongest wake-up signal level, broadcasted by UE, is chosen by Femtocell Management Unit to be waken-up. Then each active FBS adapts its transmission power as a function of UEs positions. In [11] FBSs use user activity detec-tion in order to save energy. Active FBSs adjust their pilot power
2.3. Overview on Related Works 15 levels in order to minimize co-tier interference following commands of Femtocell Interference Unit.
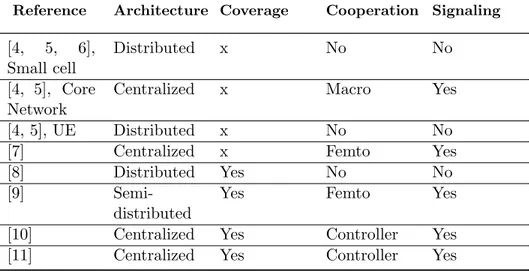
Table 2.1 synthesizes the main features of the analyzed power con-trol management schemes. The first column indicates the bibliography reference of compared approaches. Second column (Architecture) in-dicates whether the type of operation of each scheme is centralized, semi-distributed, or distributed. Third column (Coverage) indicates whether each scheme considers coverage aspects such as the SINR or the receiver’s sensitivity, i.e., minimum required power. Coverage analysis is crucial due to the fact that overlapping of adjacent cells leads to co–tier interference. Fourth column (Cooperation) indicates the kind of cooperation that is exploited by the FBS. A FBS can coop-erate with the underlying MBS, with neighboring FBSs, or both types of coordination can be implemented. Obviously, cooperation has a direct impact on both the overhead of signaling, which is indicated in the last column (Signaling).
As it can be seen, the majority of schemes require centralized oper-ation or consider signaling exchange between the nodes of the network. Although the centralized global knowledge-based architectures may provide better performance than distributed, the feasibility is often a concern. Such approaches require a central controller and information exchange between femtocells and the controller that may cause con-siderable signaling overhead. Moreover, centralized implementations may suffer a low scalability. The distributed power calibration is sim-ple, efficient and requires minimal technician assistance, thus making it attractive for practical use.
16 Chapter 2. Motivation and Related Work
Table 2.1: Summary of Related Work
Reference Architecture Coverage Cooperation Signaling
[4, 5, 6], Small cell
Distributed x No No
[4, 5], Core Network
Centralized x Macro Yes
[4, 5], UE Distributed x No No
[7] Centralized x Femto Yes
[8] Distributed Yes No No
[9]
Semi-distributed
Yes Femto Yes
[10] Centralized Yes Controller Yes
CHAPTER
THREE
PILOT POWER CONTROL APPROACH
3.1
Problem Formulation
In this dissertation is introduced a novel approach for pilot power optimization for LTE femtocell networks that addresses both energy consumption reduction and femto–femto interference issues. The ob-jectives are following:
1) Improve EE of the femtocell network in a low load scenario. 2) Improve the overall system capacity in high load conditions and
offload more traffic from the outdoor macrocell by maximizing the total coverage within the specified area where femtocells are de-ployed.
3) Reduce co–channel interference between adjacent femtocells by minimizing coverage overlaps with the view of guaranteeing a suf-ficient level of Signal to Interference plus Noise Ratio (SINR) to all
18 Chapter 3. Pilot Power Control Approach femtocell users (in order to provide the minimum required Quality of Service (QoS)).
4) Provide a robust, flexible, scalable and stable control scheme suit-able for a large–scale femtocell deployment.
To fulfill the objectives, we have chosen a fully distributed measurement–based control scheme without any signaling exchange between the nodes of the network. In our approach, each FBS each FBS integrates automatic and autonomous procedures of configura-tion and optimizaconfigura-tion of coverage in responce to the detected on–site user activity. In a low load scenario some FBSs, whose presence is not essential for the proper operation of the network, reside in a low power consumption state, that permits to achieve a relevant energy saving on entire femtocell network. In the case of a high user activ-ity, FBSs dynamically create high capacity zones under interference constraints, adapting their pilot power configuration to the current traffic load. In addition, the stability of our algorithm was obtained considering that the femtocell size does not have significant impact on the energy consumption of the FBS [12]. So, once an active FBS has adapted its configuration to the current traffic demand, it switches to Stabilization State rather than continuously adapt its pilot power as a function of users’ positions (that may result in an increased number of computational processes and handovers).
3.2
Network Model
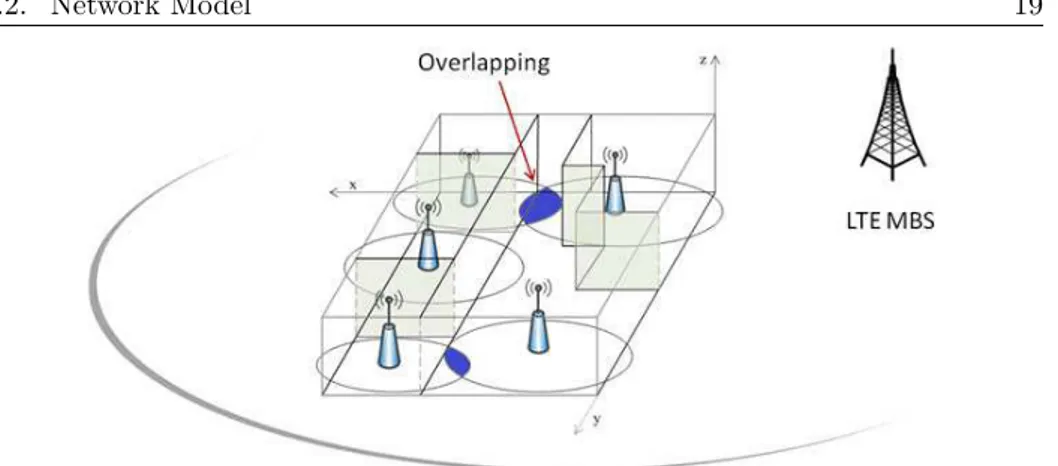
In this dissertation a two–tier heterogeneous network comprising a single macrocell embedded with a set of FBSs is considered (Fig. 3.1).
3.2. Network Model 19
Figure 3.1: Scenario: dense femtocell deployment.
This configuration may represent residential or enterprise environ-ments. Both FBSs and the Macro Base Station (MBS) are assumed to operate using the same OFDMA technology and to share the same licensed frequency band. We assume that the MBS ensures complete coverage, as this is the case in dense urban areas where femtocells are likely to be deployed as hotspots of large capacity for the purpose of increasing the throughput and offloading traffic from macrocells.
Femtocells are deployed without cell pre–planning and offer ser-vices to indoor UEs located in their coverage area. The MBS serves oudoor UEs and indoor UEs that are not under the coverage of ac-tive FBSs. All BSs are equipped with omni–directional antennas. For convenient analysis, some assumptions are made and are listed below. Assumption 1. There is no intra–cell interference in the downlink. Assumption 2. For FBSs the open access mode is adopted, i.e. FBSs behave as regular BSs and are accessible by any UE.
Assumption 3. Each UE can be served by at most one BS. Cell selec-tion is based on a maximum downlink received power of pilot signal.
20 Chapter 3. Pilot Power Control Approach Assumption 4. FBSs operate in two modes: Listen Mode and Active Mode [6].
Based on “Assumptions 2–3”, the macro–femto interference is less acute than femto–femto interference. In fact in this scenario UEs which are causing or suffering from interference can be handed over freely between the macro and femtocells [13]. For example, if a macro UE is near the edge of the macrocell and is also close to a close access femtocell, then it will be transmitting at high power and may interfere with the uplink of a small cell. If the macro UE can be handed over to the small cell, the interference to the small cell would be eliminated. Similarly in the downlink, a macro UE near the macrocell edge might suffer interference from a nearby small cell, which would be elimi-nated if the macro UE could be handed over to the femtocell [13]. Furthermore, specific macro–femto interference mitigation approaches (e.g. [14, 15, 16]) can be additionally applied without deteriorating the performance of our power control scheme. For this reason we focus only on the problem of femto–femto interference.
3.3
Algorithm Description
In this section we present the description of the algorithm in regard to a single FBSk, as the proposed pilot power control mechanism
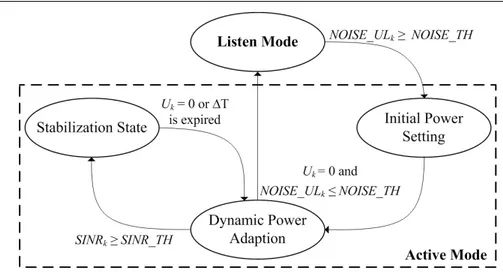
is measurement–based and does not require a global knowledge on the status of the network (which is peculiar to centralized solutions). Fig. 3.2 illustrates the FBS’s State Diagram and synthesizes the whole proposed power control mechanism.
3.3. Algorithm Description 21 Mode and Active Mode. The FBS that resides in Listen Mode disable its pilot power and associated processing, thus it achieves a significant energy saving. In Active Mode the FBS dynamically calibrates its pilot power (and thus the coverage) as a function of local traffic demand by carrying out a two step procedure that includes Initial Power Setting and Dynamic Power Adaption. As soon as an optimal configuration is achieved, the FBS switches to Stabilization State with constant setting of the pilot power.
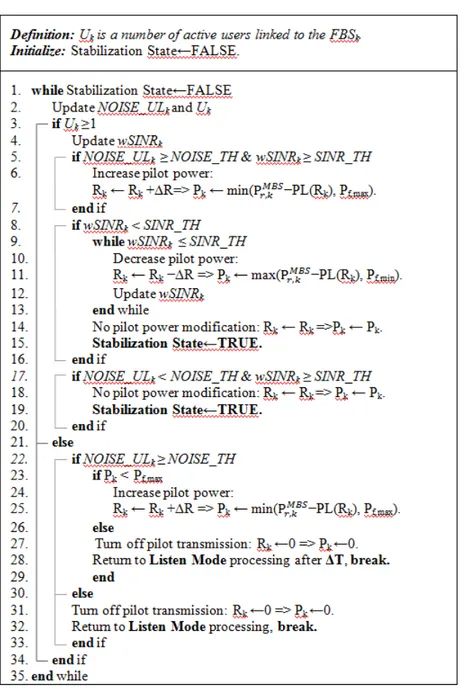
Operation of the proposed algorithm is based on estimation of two decision–making parameters by FBSk:
1) the noise level on the uplink frequency band (N OISE U Lk)
mea-sured by the FBSk for detecting the presence of any active user;
2) the minimal value of the set which consists of wideband SINR levels (wSIN Rk) measured by each active user connected to the FBSk
and feeded back to it for detecting harmful interference.
The detailed description of the decision–making parameters is given in Appendix. By comparison of these estimated values with the corresponding thresholds (N OISE T H and SIN R T H respec-tively) each FBS makes a decision on its pilot power calibration. In the following the detailed description of the algorithm is provided.
3.3.1
Listen Mode
In the initial state, when the local traffic demand is low or absent, the FBS without any active call resides in a low power Listen Mode with the pilot transmission and the associated processing disabled. Femtocell activity is controlled by a low–power sniffer integrated in
22 Chapter 3. Pilot Power Control Approach
Figure 3.2: State diagram in regard to a single F BSk.
the FBS, that continuously performs measurements of N OISE U Lk.
When a UE, located inside the sensing range of the sniffer, connects to the MBS, the sniffer detects a rise of the received noise power and the presence of active user can be detected. To avoid an unreasonable activation of idle femtocells we have introduced a threshold value of noise level (N OISE T H), which allows to control the sensitivity of FBSs.
3.3.2
Initial Power Setting
When the sniffer detects an adequate rise in the received noise power on the uplink frequency band, that is N OISE U Lk > N OISE T H,
the FBSkswitches on its pilot transmission and the associated
process-ing, providing cell coverage with initial radius Rini. For this purpose,
the FBS sets the initial transmit power to such a value that a user located at the edge of the femtocell with radius Rini receives, on
aver-3.3. Algorithm Description 23 age, the same power from the FBS and from nearby MBS. Therefore, the initial femtocell pilot power, subject to the maximum limit power of the FBS Pf,max, can be calculated in dBm as in [17]
Pk,ini = min(Pr,kM BS + P L(Rini), Pf,max), (3.1)
where PM BS
r,k is the pilot power of MBS received by FBSk; P L(Rini)
is the estimated path loss from the femtocell to a UE at the target radius Rini.
The path loss models used in the dissertation are given in Ap-pendix.
The received power PM BS
r,k is not estimated using a path–loss
model, but it is measured using the built in measurement capabil-ity of the FBS. This approach has the advantage that no information on the macrocell network is required.
Then, active UEs located within the coverage of FBSk can detect
the presence of two BSs, macro and femto, and can make a handover based on “Assumption 3”. Users offloaded to the femtocell have larger peak throughputs as they are close to their serving BS. In addition, those UEs who are still connected to the MBS enjoy more resources as they are shared now with a fewer number of macrocell users.
3.3.3
Dynamic Power Adaption
The Initial Power Setting procedure described above, which provides the initial cell coverage of the FBS, is optimized by Dynamic Power Adaption scheme.
24 Chapter 3. Pilot Power Control Approach (N OISE U Lk, wSIN Rk), compares them with corresponding
thresh-olds and calibrates its pilot power accordingly until finding an opti-mal power configuration which accomplishes the objectives 2 and 3 of Chapter 3 Section 1. Then it switches to Stabilization State.
Below we list all the considered cases and provide some explanatory notes.
1) There are active UEs linked to the FBSk, i.e. Uk6= 0
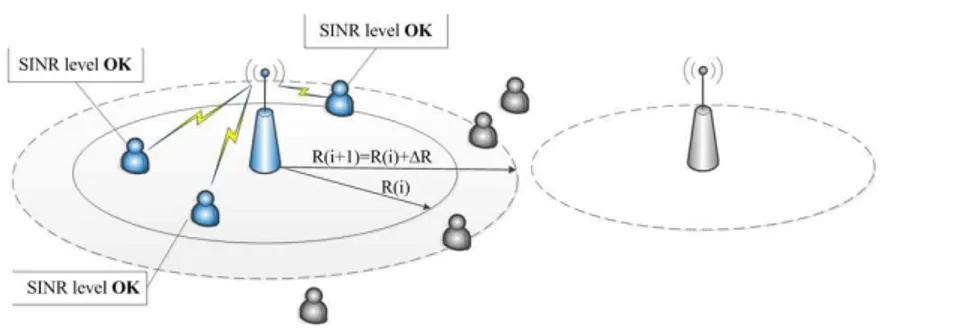
1.a) N OISE U Lk>N OISE T H & wSIN Rk>SIN R T H
If both decision–making parameters exceed corresponding thresholds, it means that there are other active UEs connected to the MBS in the sensing range of the sniffer and in the same time the minimum QoS requirement of each own active UE is en-sured. In this case FBSk has to increase its cell radius, Rk(i − 1),
of ∆R+
aiming to provide the coverage to more UEs. Accordingly, FBSk adapts its pilot power as follows
Rk(i) = Rk(i − 1) + ∆R +
; (3.2)
Pk(i) = min(Pr,kM BS+ P L(Rk(i)), Pf,max), (3.3)
where ∆R+
is the range modification step, i is the iteration num-ber.
This case is illustrated by Fig. 3.3.
Then active UEs, located within the range of the FBSk can
detect the presence of two BSs, macro and femto, and can establish the connection based on “Assumption 3”. Users offloaded to the FBS have larger peak throughputs as they are close to their serving
3.3. Algorithm Description 25
Figure 3.3: The illustration of coverage extension.
BS. In addition, those UEs who are still connected to the MBS enjoy more resources as they now share the macro cell resources with a fewer number of users.
In the next iteration the FBS will update the decision–making parameters and will verify the fulfillment of one of the conditions (1.a, 1.b, 1.c, 2.a, 2.b).
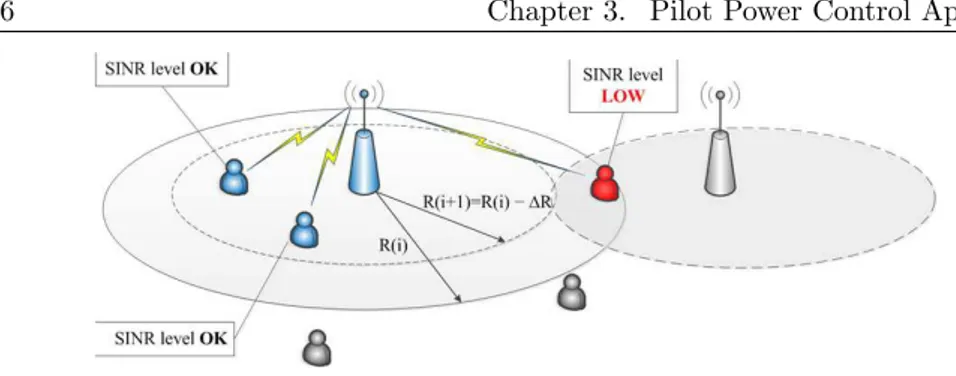
1.b) wSIN Rk 6SIN R T H
A wSIN Rk value below its acceptable level means that the
minimum QoS requirement is not satisfied for at least one currently connected user. This user is likely to be located in the overlap area between adjacent femtocells. So FBSk decreases its cell radius of
∆R− by setting its pilot power in the following way:
Rk(i) = Rk(i − 1) − ∆R−; (3.4)
Pk(i) = max(Pr,kM BS + P L(Rk(i)), Pf,min), (3.5)
where Pf,min is a minimum transmit power of the FBS.
26 Chapter 3. Pilot Power Control Approach
Figure 3.4: The illustration of coverage reduction.
As a result of coverage reduction, those users who were suffering from the interference appear to be out of coverage of FBSkand they
establish a new connection based on “Assumption 3”.
In the next iteration the FBS updates wSIN Rk value and
ver-ifies the fulfillment only of condition (1.b). So FBSk continually
decreases its pilot power until wSIN Rk >SIN R T H, then its
pi-lot power remains constant irrespectively to N OISE U Lk value.
This decision allows to eliminate continuous variations of the cov-erage area in order to avoid an excessive number of handover events and to achieve the Stabilization State.
1.c) N OISE U Lk< N OISE T H & wSIN Rk>SIN R T H
FBS has achieved an optimal coverage and it switches to Stabi-lization State and its pilot power remains constant.
2) No active UE linked to the FBSk, i.e. Uk= 0
If there are not currently connected active UEs, FBSk adapts its
coverage according only to N OISE U Lk value.
3.3. Algorithm Description 27 It means that there are active macro UEs located in the sensing range of the sniffer.
If Pk 6 Pf,max, the FBS increases its pilot power according to
(3.4). Due to the coverage extension some active macrocell users can handover into the femtocell based on “Assumption 3”. In the next iteration the FBS updates the decision–making parameters and verifies the fulfillment of one of the conditions (1.a, 1.b, 1.c, 2.a, 2.b), adapting its pilot power setting accordingly.
If FBSk has achieved the maximum value of its pilot power
(Pk = Pf,max), while macro UEs remain unattainable (Uk = 0),
FBSk turns off its pilot power and associated processing and rests
in Listen Mode for ∆T time interval. So, FBSk will reside in an
energy saving state, rather than being active measuring a high N OISE U Lk level due to transmissions of unattainable UEs.
2.b) N OISE U Lk< N OISE T H
The FBS turns off its pilot transmission and associated signaling and returns to the Listen Mode processing.
The Dynamic Power Adaption procedure is summarized in Fig. 3.5.
3.3.4
Stabilization State
The FBS achieves Stabilization State when its pilot power (and thus the coverage) is optimized based on the on–site traffic demand and in the same time an acceptable SINR level is guaranteed to each of its currently connected user. From Stabilization State, FBSk switches
28 Chapter 3. Pilot Power Control Approach the local radio environment and, if required, updates its pilot power setting. The transition to Dynamic Power Adaption is carried out: periodically with time intervals ∆T if there are active UEs currently connected to FBSkor immediately when no UE is connected to FBSk,
3.3. Algorithm Description 29
CHAPTER
FOUR
PERFORMANCE EVALUATION
In this chapter we verify the performance of the proposed scheme by simulations in MATLAB. Firstly we set optimal values of thresholds that guarantee an optimal functioning of the algorithm. After that we show scalability and robustness of our proposal changing the femtocell deployment topology and considering different distances of the group of FBSs from the MBS. Then the stability under changing traffic con-ditions is evaluated. Then we evaluate an energy saving potential of our power management scheme taking into account a typical diurnal traffic pattern. Finally, we test the performance of the algorithm in a Multi–MBS environment.
32 Chapter 4. Performance Evaluation
4.1
Simulation assumptions and
perfor-mance metrics
The system parameters setting used in the simulations can be found in Appendix. More specifically, some assumptions and simplifications were made: all UEs have “Power class 3” (Pmax = 23 dBm), defined by
the standard; all FBSs have the same maximum transmission power Pf,max; P0 and α values are equal for all FBSs; UEs belong to two
different traffic classes: Low–Rate users and High–Rate users with different number of allocated Physical Resource Blocks (PRBs).
As regards the traffic load, in our simulations we consider Nu
ac-tive UEs (50% are Low–Rate users and 50% are High–Rate users) uniformly distributed, or, alternatively, concentrated in the macrocell area.
Furthermore, we have defined the following metrics. 1) Overlapping factor of femtocells (Θ).
Θ = N P i=1 N P j=i+1 Θi,j N P i=1 Ai − N P i=1 N P j=i+1 Θi,j , (4.1)
where N is the total number of FBSs; Ai is the area covered by
fem-tocell i; Θi,j is the overlap area between femtocell i and femtocell j.
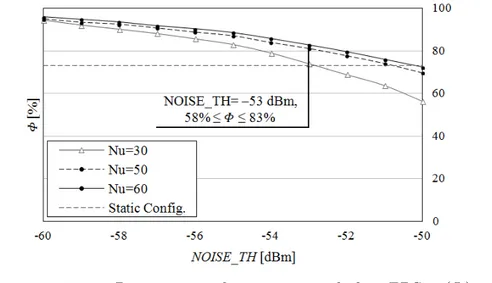
2) Percentage of users present in the macrocell area served by all FBSs (Φ). Φ = N P i=1 Ui Nu · 100, (4.2)
4.2. Determination of thresholds 33 where Ui is a number of users served by FBSi; Nu is a total number
of active users present in the macrocell area.
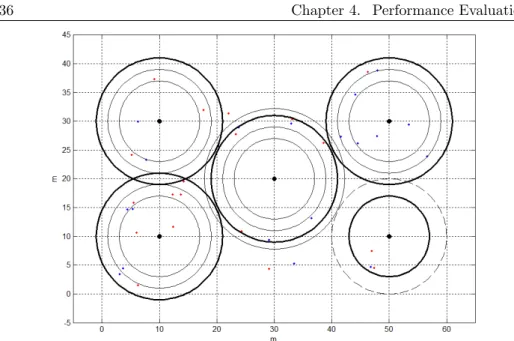
In the following for assessing the performance of our coverage func-tion we compare it to the static pre–planned configurafunc-tions, where the pilot power of each FBS is fixed and is ideally set to provide the max-imum coverage with minimal femto–femto interference by excluding overlap between adjacent femtocells (see, for example, Fig. 4.1).
4.2
Determination of thresholds
As the proposed algorithm requires to set optimal values of the thresh-olds SIN R T H and N OISE T H, we have firstly set SIN R T H = −4 dB and then determined an optimal N OISE T H value by carry-ing out a series of simulations. Notice that accordcarry-ing to [18] the above value chosen for SIN R T H is defined by LTE specifications like a
34 Chapter 4. Performance Evaluation minimum SINR required to guarantee satisfactory QoS.
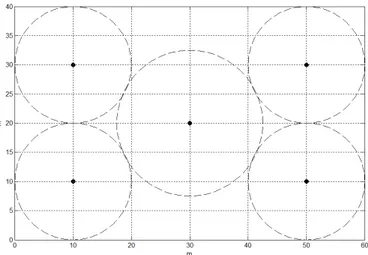
The scenario used to simulate and evaluate an optimal N OISE T H value represents an enterprise environment with 5 FBS (see Fig. 4.1) localized so as to cover most part of an area (60×40 m2
). We also assume that this area is covered by a MBS located at a dis-tance of about 300 meters.
Fig. 4.2 and Fig. 4.3 show diagrams of Θ and Φ, respectively, for N OISE T H varying from −60 to −50 dBm (with the step of 10 dBm). The results are averaged over 50 independent simulation runs. For the static configuration Θ = 0 for different traffic load scenarios, this is because the pilot power of each FBS is constant and it is configured to avoid overlap areas between adjacent femtocells. The value of Φ, instead, is maintained around 73%. So, even such “ideal” configura-tion cannot guarantee the coverage to all active UEs present in the considered macrocell area. By comparative analysis of the simulation results (see Fig. 4.2 and Fig. 4.3), it can be estimated that a good trade–off between Θ and Φ is achieved with N OISE T H set to −53 dBm. In fact, this threshold value provides Θ ≤ 5% and Φ is about 80% in a high load scenario.
Finally, the thresholds are set to: SIN R T H = −4 dB; N OISE T H = −53 dBm and are used in all the following simula-tions. With this values of thresholds in Fig. 4.4 is shown an example of the operation of our algorithm: each FBS dynamically adapts its pilot power (fine line) according to the traffic demand until Stabiliza-tion State (bold line). Here and in all following simulaStabiliza-tion results the users present in the macrocell area are indicated by dots.
4.2. Determination of thresholds 35
Figure 4.2: Overlapping factor of femtocells (Θ) vs. N OISE T H.
Figure 4.3: Percentage of users served by FBSs (Φ) vs. N OISE T H.
36 Chapter 4. Performance Evaluation
Figure 4.4: Example of the operation of proposed algorithm.
4.3
Evaluation of scalability and
robust-ness
To evaluate the scalability and robustness of our proposal, we have carried out a series of simulations varying the network topology: Topology 1. 5 FBS localized so as to cover most part of an area (60×40 m2
) (see Fig. 4.1);
Topology 2. 3 FBS localized so as to cover most part of an area (60×40 m2
) (see Fig. 4.5);
Topology 3. 20 FBS randomly distributed in an area (100×100 m2
) (see Fig. 4.6).
For all topologies, the MBS is assumed to be located at the distance of about 300 meters.
4.3. Evaluation of scalability and robustness 37
Figure 4.5: Static configuration (dotted line) and final configuration
for the proposed algorithm (solid line) for Topology 3, Nu = 70.
Figure 4.6: Static configuration (dotted line) and final configuration
38 Chapter 4. Performance Evaluation In Fig. 4.7 and Fig. 4.8 are shown Φ and Θ for each topology at various UE’s densities per unit area (ρ = active users/m2). When the system is in low traffic conditions (ρ ≤ 0.01), our algorithm provides lower Φ values compared to the static configuration, as in this case our power control scheme places some FBSs in Listen Mode (for instance, three FBSs reside in Listen Mode in Fig. 4.9), thus allowing to achieve a relevant energy saving on entire femtocell network. However, in this scenario the MBS can alone handle the traffic while offering to users satisfactory throughput. When the traffic load increases (ρ > 0.01) the proposed algorithm, thanks to its adaptive nature, allows to ob-tain higher Φ values compared to the static configuration (see Fig. 4.7), while maintaining an acceptable level of Θ (see Fig. 4.8). More pre-cisely, in Fig. 4.10 is shown an example of how the algorithm is able to provide the coverage to those users (indicated by triangles) who could not be covered by the static configuration, while guaranteeing the suf-ficient SINR level to all connected users (minimal overlap). So, in a high load scenario our algorithm allows to offload more traffic from the MBS and therefore to increase the overall system capacity. In addition, EE of the overall cellular network also enhances, as MBS’s power consumption is strongly related to its traffic load [12]. Let’s note that numerical values vary depending on the specific arrange-ment of FBSs, but, regardless the network topology being considered, implementation of the proposed algorithm allows to offload up to 13% active users from the MBS. This confirms scalability of proposed power control scheme.
Lastly, for each topology, we have considered various distances of the FBSs from the MBS (300 m, 1 km, 5 km, 20 km and 30 km) (Fig. 4.11, Fig. 4.12, Fig. 4.13 respectively). The simulation results
4.3. Evaluation of scalability and robustness 39 differ slightly from those previous confirming flexibility and robustness of our self–coverage function.
Finally, the scalability, dynamic adaptability, and flexibility of the proposed algorithm guarantee a natural robustness to any faults or shutdown of one or more FBSs.
Figure 4.7: Percentage of users served by FBSs (Φ) vs. UE’s density
ρ.
40 Chapter 4. Performance Evaluation
Figure 4.9: Static coverage (dotted line) and final configuration for
the proposed algorithm (solid line), Nu = 20.
Figure 4.10: Static coverage (dotted line) and final configuration for
4.3. Evaluation of scalability and robustness 41
Figure 4.11: Percentage of users served by FBSs (Φ) vs. UE’s
density ρ for Topology 1.
Figure 4.12: Percentage of users served by FBSs (Φ) vs. UE’s
42 Chapter 4. Performance Evaluation
Figure 4.13: Φ vs. ρ at various distance of the group of FBSs from
the MBS for Topology 3.
4.4
Evaluation of Stability
The performance of our algorithm, in terms of stability and respon-siveness of the control, depends on the ∆T value, that is the time interval in which a FBS resides in Stabilization State before switching to Dynamic Power Adaption procedure.
We expect that with shorter ∆T duration the system is more re-sponsive to the changes of traffic conditions due to the frequent pilot power adaptions. But this could result in a significant increase in the number of handover events. To determine the appropriate ∆T value, we have considered a new scenario in which the traffic load is variable in time. More specifically, the simulations have been carried out under the following assumptions:
1) UEs are uniformly distributed in the considered macrocell area. The total number of UEs varies during the observation period of
4.4. Evaluation of Stability 43 16 hours (6:00 to 22:00) as shown in Fig. 4.14.
2) The mobility of UEs is neglected, but each UE can reside in on/off state following the Poisson Distribution process of the call arrival time. The interarrival time and the call holding time are expo-nentially distributed with means λ = 4 [min] and µ = 3 [min] respectively.
We provide simulation results only for Topology 1, as due to scala-bility of our power control scheme analogous results can obtained also with others.
Fig. 4.15 shows the average percentage of users covered by all FBSs during the whole observation period for several ∆T values. We observe that for ∆T ≤ 16.5 [min] our algorithm responds more efficiently to the traffic fluctuations and, consequently, provide higher Φ values compared to the static configuration (dotted line). However, such ∆T values lead to a substantially increased number of handovers (see Fig. 4.16) due to the frequent pilot power calibration events in attempt to continuously improve the coverage. Protracted ∆T duration delays the response of FBSs to the changes of the traffic demand and, as a consequence, adversely affect the performance of our algorithm in terms of Φ (see Fig. 4.15 for ∆T > 16.5 [min]). Nevertheless, in this case the number of handovers is significantly reduced (see Fig. 4.16).
Let’s also note that the total duration of Listen Mode intervals is not sensitive to ∆T values, as the FBS switches to Listen Mode if no UE is connected to it independently if ∆T is expired or not.
So, by comparative analysis of simulation results shown in Fig. 4.15-4.16 we have determined ∆T = 13 [min] as an optimal value, that permits to achieve a good trade–off between the number of
han-44 Chapter 4. Performance Evaluation dover events and Φ. The next the analysis is made with ∆T = 13 [min].
Figure 4.14: User distribution pattern.
4.5. Evaluation of Energy Efficiency 45
Figure 4.16: The total number of handover events vs. ∆T intervals.
4.5
Evaluation of Energy Efficiency
In the following we provide a power consumption analysis for FBS which operates in Active Mode and Listen Mode. According to [12] the power consumption is load dependent for MBSs, while there is a negli-gible load dependency for FBSs, so we assume static power consump-tion across all traffic load for FBSs and we use a static component– based power consumption evaluation model introduced in [19]. This power model is built around the split of a BS into a number of com-ponents and sub–comcom-ponents, as shown in Fig. 4.17.
A FBS consists of two transceivers (TRXs). A TRX comprises an Antenna Interface (AI), a Power Amplifier (PA), a Radio Frequency (RF) small–signal transceiver section, a digital baseband (BB) inter-face including a receiver and transmitter section, a DC–DC power supply, an active cooling system and an AC–DC unit (Main Supply) for connection to electrical power grid.
46 Chapter 4. Performance Evaluation
Figure 4.17: Overview of base station components included in the
power model.
So, the power consumption of the FBS that resides in Active Mode can be calculated as follows
PACT = NT RX ·
PP A+ PRX + PT X+ PBB+ PSnif f.
(1 − σDC)(1 − σM S)(1 − σCool.)
. (4.3)
Table 4.1 summarizes the state of the art power consumption of LTE femtocells as of 2012. Applying the data reported in Table 4.1 to equation (4.3), we obtain PACT = 7 [W].
Table 4.1: LTE femtocell transceiver power consumption
PA, TX, RX, BB, DC–DC, Cooling, AC–DC, NT RX
[W] [W] [W] [W] σDC σCool. σM S
1.0 0.2 0.2 1.2 0.08 0.0 0.1 2
By switching to Listen Mode, the FBS switches off the PA, RF transmitter and RF receiver. However, the sniffer (PSnif f. = 0.3 W [6])
is switched on to perform received power measurements on the uplink frequency band. So, the power consumption of the FBS that resides
4.5. Evaluation of Energy Efficiency 47 in Listen Mode results
PLM = NT RX ·
PBB+ PSnif f.
(1 − σDC)(1 − σM S)(1 − σCool.)
= 3.62 [W]. (4.4) As can be estimated, the addition of Listen Mode to the normal femtocell operation results in a power saving of 48.29% for each idle femtocell.
The total amount of energy consumed by FBSk is given in the
following equation:
EF BSk = PACT,k· tACT,k+ PLM,k· tLM,k, (4.5)
where PACT,k and PLM,k represent the power consumption of FBSk
when it resides in Active or in Listen Mode, respectively; tACT,k and
tLM,krepresent the time period (expressed in hours) in which the FBSk
is in Active Mode and in Listen Mode, respectively.
So, the total amount of energy consumed by entire femtocell net-work can be calculated as:
EF N = N X k=1 Ek F BS. (4.6)
To evaluate the energy saving potential of our algorithm in a real-istic scenario we have taken into account a traffic profile that emulates the spatial and temporal variations during a working day in an enter-prise scenario. More specifically, we consider Topology 3 (Fig. 4.18) provisioned of a Dining and Lounge Area, where the number of users increases substantially during the lunch break (from 13:00 to 15:00) (as shown in Fig. 4.19).
48 Chapter 4. Performance Evaluation
Figure 4.18: Static configuration (dotted line) and final coverage for
our algorithm (solid line)–Topology 3, ρ = 0.006
After a series of simulations, in Fig. 4.20 we report the number of active femtocells, averaged over each hour. Besides, in Fig. 4.21 the average number of active users connected to FBSs with our algo-rithm and those with the static configuration are presented. Finally, in Fig. 4.22 we report the energy saving gain obtained for each hour and calculated as follows
EGAIN =
EF N,Static− EF N,OurApproach
EF N,Static
, (4.7)
4.5. Evaluation of Energy Efficiency 49
Figure 4.19: User distribution pattern.
Figure 4.20: Medium number of active femtocells vs. time.
and represent the total amount of energy consumed by the whole fem-tocell network with the static configuration and with implementation of our algorithm, respectively.
By comparing the above results, in low load conditions numerous FBSs reside in Listen Mode, that permits to achieve a significant
en-50 Chapter 4. Performance Evaluation
Figure 4.21: Percentage of users served by FBSs (φ) vs. Time of
day.
Figure 4.22: Energy Saving gain vs. Time of day.
ergy gain (see Fig. 4.22) and in the same time does not affect seriously the user coverage. In fact, as shown in Fig. 4.21, the coverage pro-vided by our power control scheme is only marginally lower than those static. Nevertheless, in these conditions the MBS alone can provide satisfactory performance to its connected users. In high load condi-tions, most of FBSs are active and our control scheme provides better
4.6. Multi–MBS environment 51 coverage compared to the static configuration (Fig. 4.21) and, conse-quently, more traffic is offloaded from the MBS (just when it is the most necessary).
Applying (4.7) to the whole observation period, we have quantified the total amount of energy consumed by entire femtocell network dur-ing a workdur-ing day: EF N,Static = 2240.00 [Wh] and EF N,OurApproach =
1871.84 [Wh]. It can be estimated that implementation of our algo-rithm in this case study results in an overall energy saving gain of 16.44%. It is important to emphasize that the total power saving of the femtocell network is relevant considering the expected large–scale deployment of FBSs in urban scenarios.
4.6
Multi–MBS environment
In this section we discuss the applicability of proposed pilot power control scheme in a multi–MBS environment. To evaluate the perfor-mance of our algorithm is such a scenario, we estimate the impact of the presence of neighboring MBS on estimation of the decision–making parameters (N OISE U L and wSIN R).
We have considered two adjacent MBSs: MBSi and MBSj, which
belong to the same operator and have equal maximal transmit powers PM BS
t (see the Table with system parameters setting in Appendix).
The MBSs are located at the distance Li,j = 3 [km] from each other.
In the coverage area of MBSi is embedded a FBS at the distance di
52 Chapter 4. Performance Evaluation
4.6.1
N OISE U L estimation in multi–MBS
sce-nario
For distances di < Li,j/2, the presence of neighboring macrocell does
not affect the performance of our algorithm, since in such a scenario UEs would be connected to the MBSi (based on “Assumption 3”).
The presence of adjacent MBSj would have an impact only at the cell
edge, where UEs, located in the vicinity of the FBS, could be con-nected to different MBSs. N OISE U L parameter estimation will not be affected even in this scenario, as it represents the total noise power in the uplink frequency band irrespectively to the choice of serving cell by UEs. This is because our pilot power control scheme is self– organizing and without any intercell signaling exchange. What may happen is that the idle FBS would measure an elevated N OISE U L level and would switch to Active State not only due to the presence of UEs connected to MBSi, but also due to transmissions of those
con-nected to MBSj. It will not cause any negative effect on the operation
of our algorithm. On the contrary, at the edges of the cell, where users experience the worst conditions in terms of channel quality and band-width, femtocells will be switched on providing better performance to users.
4.6.2
wSIN R estimation in multi–MBS scenario
To evaluate the impact of ajacent MBS on the wSIN R estimated by femtocell users, we have assessed downlink interference variations with different distances of the FBS from MBSi and from MBSj. We have4.6. Multi–MBS environment 53 area of MBSi, is moving radially with respect to both MBSs (di=(100,
Li,j/2) [m], see Fig. 4.23). In this way, when the distance increases
from one MBS by ∆d, the distance from the other MBS decreased by equal value (∆d) and the interfering effect becomes more sensitive.
The simulation results show that when the FBS is close to MBSi,
the interference power that would receive a femtocell UE from MBSj
(IM BSj) is negligible compared to those from MBSi (IM BSi). The
in-terference power received from both MBSs reaches its maximal value at the cell edge, where the aggregate MBSs’ interference doubles (IM BSj + IM BSi). However, the aggregate interference power received
from both MBSi and MBSj at the cell edge is lower than the
interfer-ence that users would experiinterfer-ence when they are connected to a FBS located next to one of MBSs.
The provided analysis show that the performance of our pilot power control scheme of are not affected by the presence of neighboring MBSs in a multi–MBS environment.
54 Chapter 4. Performance Evaluation
Figure 4.23: Multi–MBS simulation scenario.
Figure 4.24: Interference power received from MBSi and MBSj vs.
CHAPTER
FIVE
IMPLEMENTATION ISSUES
In this chapter we propose some methods for practical implementa-tion of proposed pilot power control mechanism. As our approach is based on two decision–making parameters: N OISE U Lk (measured
by each FBS) and wSIN Rk (measured by each active femtocell user),
the practical implementation issues are related to estimation of these parameters.
5.1
Network Listen Mode
For the practical implementation of the sniffer for measurement of the uplink noise level a femtocell would require only an additional uplink receiver that can perform correlation between signals. This receiver is analogous (operates in the same frequency band) to those used to receive uplink traffic. The duplication of the uplink receiver would bring just an unsignificant extra cost.
56 Chapter 5. Implementation issues Either way, the sniffing capability is often already integrated into femtocells. The key vendors produce LTE FBSs equipped with the Network Listen Module (NLM) which facilitates the plug-and-play deployment of femtocells (see Table 5.1). It permits to the femtocell to make measurements of surrounding macrocells and femtocells in order to optimize its configuration settings. NLM can be used in our approach to perform measurements of noise level on the uplink frequency band and as the module is already integrated into femtocell such a solution incurs no extra cost.
Table 5.1: Femtocell market status
Vendor Product name
ip.access Limited nanoLTE Access Points family (femtocells for enterprise and public access): nanoLTE E–40, nanoLTE+ E-100
Cisco Systems Cisco Aironet 3600 Series and Cisco Universal Small Cell 5310
Alcatel–Lucent 9760 Small Cell product family
Fujitsu BroadOne LS100 Series LTE femtocell (resi-dential), BroadOne LS200 Series LTE femtocell (semi-public/enterprise)
5.2
SINR
The SINR calculation is not defined in the 3GPP specifications but it is defined by femtocell vendors, as this parameter is used a lot by operators and the LTE industry in general. As consequence, the
5.2. SINR 57 practical implementation of SINR measure is defined based on specific application purposes.
In this work SINR parameter is introduced to enable coverage cal-ibration of FBSs in order to control overlap between adjacent femto-cells. As cell radius is defined by the power of pilot signal, to achieve our goal, there is no need to calculate the appropriate SINR level of each active UE’s connection. For this reason, in our simulations we do not consider RBs allocated to each UE for the SINR estimation. We measure a value that is based on pilot power signals received by each femtocell UE from its serving cell and from interferring cells. Values used in our simulations can be derived based on Reference Signal Re-ceived Power (RSRP) measurements made by UEs’ which are defined by LTE specifications: wSIN Rku = RSRPk u N +1P j=1,j6=k RSRPuj + N0 , (5.1) where RSRPk
u is the Reference Signal Received Power (RSRP)
mea-sured by UEu from its serving BSk; RSRPuj represents RSRP
mea-sured by UEu from interfering BSj and NRBs is the total number of
RBs over the E-UTRA bandwidth.
RSRP is the linear average (in watts) over the power contributions (in [W]) of the resource elements that carry cell–specific reference sig-nals (RSs) across the channel bandwidth and is the most basic of the UE physical layer measurements. It can be calculated as:
RSRPuk = RST P P k
58 Chapter 5. Implementation issues where RST Pk is Reference Signal Transmit Power (RSTP) (transmit
CHAPTER
SIX
APPENDIX
6.1
The noise level on the uplink
fre-quency band
The noise level on the uplink frequency band measured by FBS is calculated as N OISE U Lk = Nu X u=1 (Pu− P L(du,k)), (6.1)
where Nu is a total number of active users in the macrocell area, Pu
represents the transmit power of UEu, P L(du,k) is a path loss between
UEu and FBSk.
The 3GPP specifications [18] define the setting of the UEutransmit
60 Chapter 6. Appendix power by the following equation (dB scale):
Pu = min(Pmax, 10·lg(Mu)+P0+α·P L(du,j)+∆M CS+f (∆i)), (6.2)
where Pmax is the maximum allowed transmit power that depends on
the UE power class; Mu is the number of assigned Physical Resource
Blocks (PRBs) to UEu; P0 is a UE specific (optionally cell specific)
parameter that represents the power allocated to one PRB; α is a cell specific path loss compensation factor; P L(du,j) is the downlink path
loss between UEu and its serving FBSj, calculated in the UEu; ∆M CS
is a UE specific parameter depending on the Modulation and Coding Scheme (MCS); f (∆i) is a function that allows relative, cumulative
and absolute corrections and it is also UE specific.
Neglecting the short term variations (∆M CS and f (∆i)) in 6.2, the
average transmit power level of UEu becomes:
Pu = min(Pmax, 10 · lg(Mu) + P0+ α · P L(du,j)). (6.3)
The path loss (in dB) is modeled based on 3GPP specifications [20] designed for urban deployment scenario.
The path loss between an indoor UEu and the outdoor MBS is
modeled as
P LN LOS(du,M BS) = 2.7 + 42.8 · log 10(du,M BS) + LOW, (6.4)
where N LOS denotes that there is no visual line of sight between transmitter and receiver; du,M BS is a distance between UEu and the
MBS; LOW is the penetration loss of an outdoor wall.
6.2. Wideband Signal to Interference plus Noise Ratio 61 calculated as
P L(du,j) = 38.46 + 20 · log 10(du,j) + 0.7 · d2D,indoor+ 18.3 · n, (6.5)
where (du,j) is a distance between UEu and the FBSj; (0.7 · d2D,indoor)
takes account of penetration loss due to the walls inside an apartment, d2D,indoor is a thickness of an indoor wall and it is assumed d2D,indoor =
0.3 [m]; n is the number of penetrated floors.
We consider a single–floor building. In this case the last term in (6.5) can be neglected.
6.2
Wideband Signal to Interference plus
Noise Ratio
Each active UEu measures the level of wideband SINR and feeds back
the result to its serving FBS. This estimated value can be calculated in accordance with [21] as follows
wSIN Rku = Pk r,u Ik u + N0 , (6.6) where Pk
r,u is the pilot power of FBSk measured by UEu; Iuk is the
interference of other cells; N0 is a thermal noise power.
Below we provide analytic expressions for calculation of the terms in (6.6).
62 Chapter 6. Appendix The FBSk pilot power measured by UEu is modeled as
Pk r,u = Pk t,u As· Lw· dnu,k , (6.7) where Pk
t,u is pilot power transmitted by FBSk and dnu,k is a distance
between UEu and FBSk.
The interference power measured by UEu due to transmissions of
all non–serving BSs (macro and femto) can be calculated as
Iuk = N +1X j=1,j6=k
Pr,uj , (6.8)
where N is the total number of FBSs; Pj
r,u is the pilot power received
from interfering BSj (calculated according to 6.7).
Note that because of “Assumption 1” of no intra–cell downlink interference, the pilot power transmitted by the serving FBS is not seen as interference by UEu.
The FBSk has to ensure that no UE’s wSIN R falls below its
threshold SIN R T H level chosen to guarantee an adeguate QoS. So, the second decision–making parameter represents the minimal value of the set {wSIN Rk
u}:
wSIN Rk = min{ wSIN Ruk }, ∀ u ∈ Uk, (6.9)
6.3. Simulation parameters 63
6.3
Simulation parameters
In Table 6.1 are summarized system parameters values used in simu-lations.
64 Chapter 6. Appendix
Table 6.1: System Parameters
Parameter Symbol Value
Initial femtocell radius Rini 7 m
Maximum transmit power of FBS Pf,max 23 dBm
Minimal transmit power of FBS Pf,min −40 dBm
Transmit power of MBS PM BS
t 43 dBm
PRBs assigned to a High–Rate user Mu 3
PRBs assigned to a Low–Rate user Mu 1
Maximum transmit power of UEs Pmax 23 dBm
Path loss compensation factor α 1
Power to be contained in one PRB P0 −106 dBm
Path loss at 1 m AS 37 dBm
Path loss exponent n 3
Thermal noise power N0 −96.8 dBm
Wall penetration loss LOW 15 dB
Number of FBSs N 5
Range modification step ∆R
+
2 m
CHAPTER
SEVEN
CONCLUSIONS
7.1
Concluding remarks
In this dissertation, a fully distributed measurement–based coverage function for LTE FBSs embedded in a macrocell area that addresses both power consumption reduction and femto–femto interference is-sues is proposed.
In Chapter 4, Section 2 we have carried out a series of simulations that have permitted to set optimal values of thresholds which guaran-tee an optimal functioning of the algorithm (i.e. permit to achieve a trade–off between user coverage and overlapping factor of femtocells). In a low load scenario our pilot power control scheme places some FBSs in Listen Mode, that permits to reduce power consumption to up to 48.29% for each inactive femtocell. In a high load scenario each FBS dynamically adapts its pilot power (and thus the coverage) to the on–site traffic distribution and in these conditions our algorithm
66 Chapter 7. Conclusions allows to offload up to 13% more active users from the MBS than the static configuration scheme while guaranteeing a sufficient SINR level to all connected users. This consents not only to increase the overall system capacity, but also to improve the EE of cellular networks, as MBS’s power consumption is strongly related to the traffic load.
Simulation results obtained in Chapter 4, Section 3 show that the proposed power control scheme is scalable, flexible and robust. In fact, the performance of the algorithm depends neither on the density of FBSs per unit area, nor on the MBS’s location.
In Chapter 4, Section 4 we have carried out a series of simulations to determine an optimal value of ∆T , that is the time interval in which a FBS resides in Stabilization State before switching to Dynamic Power Adaption procedure. ∆T = 13 [min] was chosen as an optimal value that permits to achieve a trade–off between user coverage and the number of handover events.
Furthermore, in Chapter 4, Section 5 we use a component–based model to quantify the energy saving potential of our algorithm. Sim-ulation results show that in a case study our approach achieves an overall energy saving gain of 16.44% under a typical enterprise traffic profile.
The results obtained in in Chapter 4, Section 6 show that the proposed pilot power control scheme is suited for a Multi–MBS envi-ronment.
7.2. Possible work extensions. 67
7.2
Possible work extensions.
7.2.1
Hybrid Access mode for Femtocells.
One of the targets of further research could be to extend the function-ality of the proposed algorithm considering a ”Hybrid access mode” for FBSs, in which the femtocell provides service to all UEs, but prefer-ential treatment is given to its associated registered users, while other users can connect via a subset of remaining available subchannels on a best–effort basis.
7.2.2
Automation of setting of thresholds’ values.
The performance of the proposed pilot power control scheme are strongly related to the chosen values of thresholds. More specifically, with too high N OISE T H value idle FBSs would remain in Listen Mode even in the presence of active macrocell UEs located in their vicinity. This would vain the presence of FBSs. From the other side, too low N OISE T H threshold level would cause useless activation of idle FBSs even when all active macrocell UEs are located outside the maximal coverage area of femtocells. This would lead to considerable energy waste and to a harmful femto–femto interference due to the overlapping between adjacent femtocells.In this dissertation an optimal threshold’s value (that permits to achieve a trade–off between percentage of users served by femtocells and overlapping factor) was determined by simulations and using spe-cific path loss models suited for urban femtocell deployment scenario. Obviously, path loss models are good instruments, but they depend on multiple environmental factors. Obviously, the choise of optimal