ALLELE-SPECIFIC EXPRESSION OF APC IN ADENOMATOUS
POLYPOSIS FAMILIES
Ester Castellsagué,
Translational Research Laboratory, IDIBELL-Institut Català d’Oncologia, Barcelona 08907, Spain. Sara González,
Translational Research Laboratory, IDIBELL-Institut Català d’Oncologia, Barcelona 08907, Spain Elisabet Guinó,
Bioinformatics and Biostatistics Unit, Department of Epidemiology, IDIBELL-Institut Català d’Oncologia, Barcelona 08907, Spain
Kristen N. Stevens,
Department of Epidemiology, University of Michigan, Ann Arbor MI 48109, Michigan, USA Ester Borràs,
Translational Research Laboratory, IDIBELL-Institut Català d’Oncologia, Barcelona 08907, Spain Victoria M. Raymond,
Department of Internal Medicine, University of Michigan Medical School, Ann Arbor MI 48109, Michigan, USA
Conxi Lázaro,
Translational Research Laboratory, IDIBELL-Institut Català d’Oncologia, Barcelona 08907, Spain Ignacio Blanco,
Cancer Genetic Counseling Program, IDIBELL-Institut Català d’Oncologia, Barcelona, Spain Stephen B. Gruber, and
Department of Internal Medicine, Epidemiology, and Human Genetics, Division of Molecular Medicine and Genetics, University of Michigan, Ann Arbor MI 48109, Michigan, USA Gabriel Capellá
© 2010 The American Gastroenterological Association. Published by Elsevier Inc. All rights reserved.
Correspondence: Gabriel Capellá Translational Research Laboratory, IDIBELL-Institut Català d’Oncologia, Barcelona 08907, Spain.
[email protected] Tel +34 93-260-7461 Fax +34 93-260-7466.
Contribution to the manuscript: - Ester Castellsagué: Study concept and design; acquisition of data; analysis and interpretation of
data; technical or material support; drafting of the manuscript.
- Sara González: Study concept and design; acquisition of data; study supervision. - Elisabet Guinó: Statistical analysis.
- Kristen N. Stevens: Technical or material support; acquisition of data. - Ester Borràs: Technical or material support; acquisition of data. - Victoria M. Raymond: Technical or material support; acquisition of data. - Conxi Lázaro: Critical revision of the manuscript for important intellectual content.
- Ignacio Blanco: Critical revision of the manuscript for important intellectual content; acquisition of data. - Stephen B. Gruber: Critical revision of the manuscript for important intellectual content; acquisition of data.
- Gabriel Capellá: Study concept and design; drafting of the manuscript; critical revision of the manuscript for important intellectual
content; obtained funding; study supervision.
Disclosures: No conflicts of interest exist.
Publisher's Disclaimer: This is a PDF file of an unedited manuscript that has been accepted for publication. As a service to our
customers we are providing this early version of the manuscript. The manuscript will undergo copyediting, typesetting, and review of
NIH Public Access
Author Manuscript
Gastroenterology. Author manuscript; available in PMC 2011 August 1. Published in final edited form as:
Gastroenterology. 2010 August ; 139(2): 439–447.e1. doi:10.1053/j.gastro.2010.04.047.
NIH-PA Author Manuscript
NIH-PA Author Manuscript
Translational Research Laboratory, IDIBELL-Institut Català d’Oncologia, Barcelona 08907, Spain.
Abstract
Backgound & Aims—Germline mutations of the APC gene are the pathogenic cause of most cases of familial adenomatous polyposis (FAP) and a lesser proportion of attenuated FAP (AFAP). Systematic analysis of APC at the RNA level may provide insight into the pathogenicity of identified mutations and uncover the molecular basis of FAP/AFAP in families without
identifiable mutations. Here, we analyzed the prevalence of imbalances in the allelic expression of
APC in polyposis families with germline mutations in the gene and without detectable mutations
in APC or and MUTYH.
Methods—Allele-specific expression (ASE) was determined by single nucleotide primer extension using an exon 11 polymorphism as an allele-specific marker. In total, 52 APC-mutation-positive (36 families) and 24 APC/MUTYH-mutation-negative (23 families) informative patients were analyzed. Seventy-six controls were also included.
Results—Of the APC-mutation-positive families, most of those in which the mutation was located before the last exon of the gene (12 of 14) showed ASE imbalance, which is consistent with a mechanism of nonsense-mediated decay (NMD). Of the APC/MUTYH mutation-negative families, two (9%) showed ASE imbalance as a hallmark of the putative pathogenic cause of the disease. Normal allele expression was restored after treatment of short-term cultured lymphocytes with puromycin, supporting the NMD hypothesis.
Conclusions—ASE analysis may be an indicator of pathogenicity for some cases of FAP and AFAP in which APC mutations are not found. ASE might also be useful for prioritizing the order in which different areas of APC should be tested. Our results underline the importance of RNA-level studies in molecular diagnosis of FAP.
Keywords
Familial adenomatous polyposis; Allele-specific expression; APC; Nonsense-mediated decay
BACKGROUND & AIMS
Familial adenomatous polyposis (FAP), an autosomal dominant disease predisposing to colorectal cancer, is mainly caused by truncating germline mutations in the APC gene (5q21–22)1. Widespread use of sequencing techniques has led to the identification of an increased number of missense mutations2, variants with a putative impact on mRNA splicing3, and cases of somatic and germline mosaicisms4. Exon dose analysis has detected gross rearrangements in a minority of cases5. Although in a lesser proportion of cases, attenuated FAP (AFAP) is also associated with APC mutations and with biallelic germline mutations in the MUTYH gene, showing an autosomal recessive pattern6.
In other cancer predisposition genes such as MSH2, MLH1, BRCA1, BRCA2 and NF1, studies at the RNA level have shown that mutations causing a premature termination codon (PTC) usually trigger nonsense-mediated decay (NMD) of the mRNA7-11. This mRNA surveillance mechanism reduces the abundance of premature stop-codon-harboring mRNA and of the corresponding truncated proteins. NMD of the affected transcript occurs if the PTC is located approximately 55 bp upstream of the last intron-exon boundary12. Although some RNA studies of the APC gene have been published, focused mainly on the presence of aberrant splicing due to missense, silent or unclassified variants3,13, to date there are no published studies offering a systematic analysis of the impact of pathogenic APC mutations at the RNA level.
NIH-PA Author Manuscript
NIH-PA Author Manuscript
The proportion of familial adenomatous polyposis (FAP) families with identifiable APC mutations has shown a slight increase with the incorporation of new techniques into diagnostic algorithms. However, a large subset has undetectable pathogenic changes [designated here as APC(−)/MUTYH(−)]. Small decreases in APC mRNA have been detected in APC(−)14,15 and APC(−)/MUTYH(−) families16-18. In contrast, high germline levels of an APC mRNA isoform resulting from an exon 10-15 connection have been observed in a case of APC(−)/MUTYH(−) AFAP19. Germline imbalances in allele-specific expression (ASE) of the APC gene have been detected in FAP and AFAP families14, 15, 18, 20, but their potential contribution to diagnostic yield is unknown.
The prevalence of imbalances in APC allelic expression was analyzed in two sets of polyposis families: APC mutation-positive [designated here as APC(+)] and APC(−)/
MUTYH(−). Here we show that mutations outside exon 15 are associated with a clear allelic
imbalance at the RNA level that is secondary to NMD, and that these imbalances are also detected in a low proportion of APC(−)/MUTYH(−) families.
PATIENTS AND METHODS
PatientsOne hundred and twenty-seven FAP and AFAP families from the Catalan Institute of Oncology (ICO) and the University of Michigan (UM) were initially tested for germline
APC and MUTYH mutations by comprehensive diagnostic methods (sequencing or SSCP
analysis of all exons and exon-intron boundaries, gross deletion analysis by QMPSF (Quantitative Multiplex PCR of Short Fluorescent Fragments) and/or MLPA (Multiplex Ligation-dependent Probe Amplification) and/or Southern blot for the APC gene, presence of germline epimutations in APC promoter in conjunction with sequencing of the two most prevalent variants of the MUTYH gene – Y165C and G382D). Mutations were found in 76 families, while the molecular pathogenic cause of the disease remained unknown in 51 families. The mutation detection rates were 83% for FAP and 25% for AFAP.
Individuals from 59 of the families tested heterozygous for the rs2229992 APC coding SNP in exon 11 of the APC gene and were the informative population of the present study. These families were divided according to mutational status: (i) 36 APC(+) families (24 classical FAP, 34 carrier individuals; 12 AFAP, 18 carrier individuals); and (ii) 23 APC(−)/
MUTYH(−) families (5 FAP, 6 individuals; 18 AFAP, 18 individuals).
A total of 76 heterozygous controls were included: 29 non-carriers from APC mutation families, 6 carriers and 24 non-carriers from MSH2 and MLH1 mutation families, and 17 Ashkenazi Jewish individuals diagnosed with sporadic microsatellite-unstable colorectal cancer that form part of the Molecular Epidemiology of Colorectal Cancer (MECC) study. This is a population-based case-control study of incident colorectal cancer (CRC), including histopathologically confirmed cases from all incident colorectal cancer cases diagnosed in northern Israel from 31 March 1998 onwards. Informed consent was obtained from all of the subjects who participated in the study.
Genotyping: SNaPshot analysis of genomic DNA
Peripheral blood lymphocyte DNA was obtained using the FlexiGene DNA kit (Qiagen). Twenty-five ng of genomic DNA were amplified in a final volume of 25 μL containing 0.13 μmol/L primers, 0.2 mmol/L dNTPs, 2.5 mmol/L MgCl2 and 1.25 U Taq polymerase (Thermoprime Plus DNA Polymerase; ABgene). After an initial denaturing step, samples underwent 5 initial cycles (1 min at 94°C, 30 s at 65°C, 30 s at 72°C), 20 cycles (1 min at 94°C, 30 s at 65°C decreasing 0.5°C/cycle, 30 s at 72°C), and 10 final cycles (1 min at 94°C, 30 s at 55°C, 30 s at 72°C). Primers in exon 11 (Forward:
5′-NIH-PA Author Manuscript
NIH-PA Author Manuscript
GGGACTACAGGCCATTGCA-3′ and reverse:
5′-CAAGTTTGTCAAAGCCATTCCAGC-3′) were used to amplify the rs2229992 SNP. To remove unincorporated primers and dNTPs, PCR fragments were purified using illustra™ GFX™ PCR DNA and Gel Band Purification Kit (GE Healthcare). For the single nucleotide primer extension reaction, primer extension was carried out with the SNaPshot Multiplex Kit (Applied Biosystems) with 5′-ATTGCAAGTGGACTGTGAAATGTA-3′ according to manufacturer’s instructions. Briefly, reactions were performed in a total volume of 10 μL containing 1.5 μL treated PCR product, 4.5 μL SNaPshot Ready Reaction Mix and 0.2 μmol/L extension primer. Primer extension thermocycling conditions consisted of 25 cycles of 96°C for 10 s, 50°C for 5 s, and 60°C for 30 s. SNaPshot reaction products were treated with 1 U shrimp alkaline phosphatase (usb) for 60 min at 37°C and then 15 min at 75°C. Products were run in an ABI Prism 3130 DNA sequencer and analyzed by GeneMapper v4.0 (Applied Biosystems). Heterozygous samples showed a profile with two peaks (black and red peaks represent C and T alleles, respectively), while only one peak was observed for homozygous samples.
Measuring ASE: SNaPshot analysis of cDNA
Total RNA was isolated from frozen lymphocytes using Trizol Reagent (Invitrogen) according to manufacturer’s instructions. Two hundred and fifty ng of RNA were reverse-transcribed into cDNA using pdN6 primers and MMLV reverse transcriptase (Invitrogen). To specifically amplify rs2229992 SNP in cDNA, we used the same exon 11 forward primer as for DNA amplification and a reverse primer targeting the exon 11-12 junction (5′-ATAGAGCATAGCGTAGCCTTGTTG -3′). PCR reactions were performed in a final volume of 25 μL containing 2 μL of cDNA, 0.2 μmol/L primers, 0.2 mmol/L dNTPs, 2.5 mmol/L MgCl2 and 1.25 U Taq polymerase (Thermoprime Plus DNA Polymerase; ABgene). After a denaturing step, 35 cycles of 30 s at 94°C, 30 s at 55°C, and 30 s at 72°C were performed. The remaining steps were the same as described for genotyping, including purification, SNaPshot reaction, phosphatase treatment and capillary electrophoresis. ASE was measured using peak intensities in heterozygous samples. Allelic frequencies were calculated as freq. C = C/(C+kT) or freq. T = T/(T+k’C), where k and k’ are constants given by the mean of C/T (k) and T/C (k’) proportions in control samples. These constants were used to correct for unequal representation of alleles in known control heterozygotes, caused by differential PCR amplification of alleles, differential efficiencies of ddNTP incorporation in the extension reaction, unequal emission energies of fluorescent dyes21, or putative differences in physiological RNA levels due to alternative splicing affecting exons 1, 7, 9, 10A and 14 of the APC gene22-27. ASE values are expressed as the proportion of
frequencies of the two alleles (freq. C:freq. T). Three independent replicates of all experiments were obtained, and a set of controls was included in every experiment. A Mann-Whitney test was used to evaluate ASE differences among groups.
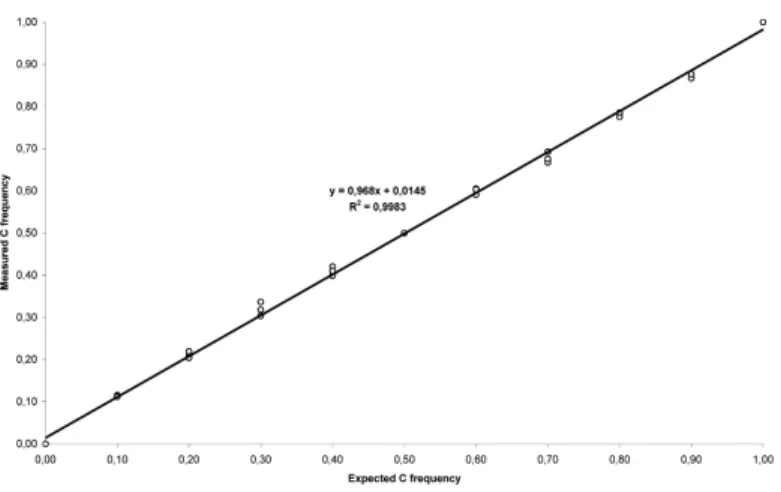
To validate the SNaPshot analysis as a quantitative technique, two homozygous samples representing the two alleles were selected. After reverse transcription, cDNAs were mixed in different proportions (0:10, 1:9, 2:8, 3:7, 4:6, 5:5, 6:4, 7:3, 8:2, 9:1 and 10:0) and analyzed in triplicate. As seen in Figure 1, SNaPshot assay of rs2229992 SNP provides a quantitative measurement of ASE of the APC gene with an analytical sensitivity of at least 10% (Figure 1). To set the cut-off points for equal and unequal expression we used 14 controls from the ICO subset of samples and obtained a mean value of 1.002±0.055 (Figure 2, A). From these results we established a conservative range for normal ASE values of 0.836-1.168 with a confidence of 99% (mean values ± 3·SD). These values were independently validated in an additional set of 14 controls with a range for normal values of 0.732-1.198 (mean values ± 3·SD), which has been consistently replicated in independent experiments using different control sets. In the presence of modest inter-experiment variability, a set of control samples
NIH-PA Author Manuscript
NIH-PA Author Manuscript
was always run in the same experiment. Pyrosequencing was used to confirm the range of normal ASE values in an independent set of 18 controls. Briefly, germline cDNA and germline DNA were PCR-amplified using the forward primer
(GAATTATTGCAAGTGGACTGTGAA) and the reverse biotinylated primer (GCCATTCCAGCATATCGTCTTA) to yield an 83 base-pair amplicon containing rs2229992. The PCR reaction mixture (25μL) contained 5ng of genomic DNA or 1μL of cDNA, 2.5μl of 10X PCR buffer (Applied Biosystems), 2μL of 25mM MgCl2 (Applied Biosystems), 1.25μL of 2.5mM dNTP (New England Biolabs), 0.5μL of each 10μM primer, and 0.75 U of AmpliTaq Gold DNA polymerase (Applied Biosystems). Cycling conditions were as follows: initial denaturation at 95°C for 3 min, 50 cycles of 95°C for 34 sec, 60°C for 45 sec, 72°C for 45 sec, and a final extension at 72°C for 10 min. 5μL of the resulting PCR product was used for pyrosequencing with the sequencing primer
(GCAAGTGGACTGTGAAAT) according to the standard Qiagen protocol. Normal ASE values were similar using this technique, ranging from 0.732 to 1.198 (mean values ± 3·SD).
Puromycin analysis
Frozen lymphocytes from a subset of patients and controls were short-cultured in RPMI 1640 + GlutaMAX medium (10% FBS, 1% penicillin-streptomycin) (Gibco) and
phytohemagglutinin (Sigma). After 6-9 days, two subcultures were derived: one was treated with 250 μg/mL puromycin (Sigma) for 5 hours, while the other was left untreated. RNA was extracted and ASE calculated as described above.
APC cDNA molecular analysis and promoter analyses
APC cDNA molecular analysis was performed in all APC(−)/MUTYH(−) families showing
ASE imbalance. Six overlapping primer pairs covering all exon-exon boundaries of the APC gene were designed to test for abnormal cDNA products in these families. Differential running patterns between test samples and controls were assessed visually using agarose gel electrophoresis and observed abnormal bands were sequenced. Sequencing of the 1A and 1B promoter regions of the APC gene was also performed. Finally, APC gene expression levels were analyzed in all ICO samples by qRT-PCR using a primer pair targeting exons 2 and 3. The primer sequences and experimental conditions for these analyses are detailed in Supplementary Table 1.
RESULTS
ASE analysis in APC(+) polyposis families
ASE was assessed in 52 individuals (34 FAP and 18 AFAP) APC(+) from 36 families (24 FAP and 12 AFAP) that tested heterozygous at rs2229992, in parallel with non-carrier individuals and controls. To categorize ASE, a cut-off range was calculated as described in Patients and Methods. ASE values <0.836 designated C-allele underexpression and values >1.168 designated C-allele overexpression, in both cases depicting allelic imbalance. The average and standard deviation (SD) ASE values for non-carriers (n=24) were 0.964±0.038 (Figure 2, A), with none outside the normal range. Twenty-two families (24 individuals) showed normal ASE values (range=0.876-1.155). The remaining 14 (39%) showed ASE imbalances: five families (8 individuals) showed C-allele overexpression
(range=1.214-8.706), eight families (18 individuals) showed C-allele underexpression (range=0.677-0.830), and one family showed the borderline value of 0.838. Another family, harboring a deletion from the promoter to exon 4, showed complete loss of T-allele
expression (F-UM-8) and was used as an internal control (Figure 2, A; Table 1).
In accordance with the canonical model of NMD, a strong correlation was observed between the location of the mutation outside exon 15 (leading to a premature termination codon
NIH-PA Author Manuscript
NIH-PA Author Manuscript
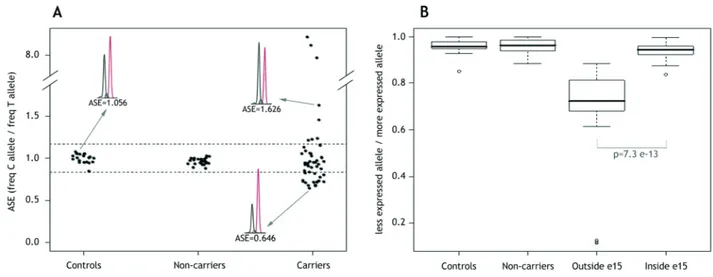
before the last exon of the gene) and the presence of ASE imbalance. Twelve of 14 (86%) families with mutations outside exon 15 showed abnormal ASE, whereas the proportion dropped to 2 of 22 (9%) for families with exon 15 mutations (p-value=7.3e-13, obtained from ASE values) (Table 1; Figure 2, B). Interestingly, the 4 cases that did not fit with the model showed borderline ASE values. Thus, the ASE values for the two families with mutations outside exon 15 and with no imbalance (F-UM-2 and F-UM-9) were 1.155 and 1.133 (upper cut-off value 1.168). The two cases with exon 15 mutations and classified as harboring putative imbalances (F-8 and F-9) showed ASE values of 0.830 and 0.838 (lower cut-off value 0.836). F-8 harbors a mutation at intron 14 that is predicted to alter intron-exon processing, leading to a truncated protein at exon 15. F-9 has a recurrent mutation,
p.Gln1062X, that was not associated with ASE in other cases in our series sharing the same alteration (F-13 and F-22). However, F-9 was classified as putatively abnormal because the imbalance essentially coincided with the diagnostic threshold value and was confirmed in cultured lymphocytes (Table 1).
Variations in ASE imbalance depending on the location of the mutation associate with different APC expression levels. Values of APC germ-line expression in 43 controls were 3.793±2.933. Expression levels in polyposis with exon 15 mutations were similar (3.647±0.911), while expression levels in polyposis with mutations outside exon 15 were lower (2.887±0.867; p=0.014).
More than one member (range=2-5) was analyzed in 8 FAP and AFAP families, and all carriers showed concordant ASE values in 7 of these families (Table 1). In one family (F-2), two of the three carriers analyzed showed abnormal ASE values (0.823 and 0.717) and the third carrier showed a normal borderline value (0.853), which probably reflects a degree of variability between individuals. ASE values were similar among families with the same mutation. For example, in families F-4 (FAP) and F-23 (AFAP), carriers of the same splicing mutation (c.834+1G>A), ASE values were similar, although they did not account for phenotype differences. Allelic imbalance cosegregated with the disease in all cases analyzed (data not shown).
In nine of the allelic imbalance cases, short-term lymphocyte cultures showed clearer ASE imbalance than observed in cDNA from peripheral blood lymphocytes. Puromycin treatment completely reverted imbalance in 8 of the 9 cases. In the remaining case, only partial reversion was achieved (Table 1). Cultured control lymphocytes showed normal ASE values that remained unchanged after puromycin treatment (data not shown).
ASE analysis in APC(−)/MUTYH(−) polyposis families
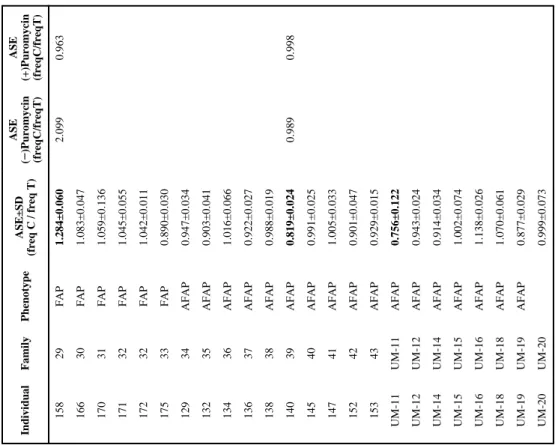
Twenty-three (5 FAP and 18 AFAP) APC(−)/MUTYH(−) families (6 and 18 individuals, respectively) were heterozygous for the SNP at exon 11 and were subsequently analyzed. Mean ASE values in controls were 1.001±0.047. Initially, three of the 23 families showed abnormal APC ASE values (F-29, F-39 and UM-11) (Figure 3 and Table 2). Puromycin treatment of short-term cultured lymphocytes was performed in the two families from whom lymphocytes were available (F-29 and F-39) (Table 2). In family F-29, the observed
imbalance was more intense in cultured cells than in PBL and was completely reverted by puromycin treatment, as expected. In F-39, with an ASE value of 0.819, the imbalance was no longer observed in cultured lymphocytes. Thus, two of the 23 (9%) APC(−)/MUTYH(−) families in our series (F-29 and UM-11) harbored ASE imbalance. In F-29, two point mutations in the promoter region were identified: g.[112043282C>G(+) 112072889C>T]. These changes were not detected in a small set of 9 controls. However, they were not located in a conserved sequence or a sequence consensus region for transcription factors, and were not associated with clear changes in APC expression levels as assessed by qRT-PCR. At the RNA level, the wt transcript coexisted with a second transcript containing a 60
NIH-PA Author Manuscript
NIH-PA Author Manuscript
bp insertion r.[=, 1408_1409ins1408+1315_1408+1369] in UM-11 RNA. These transcripts were also present in three of five additional samples consisting of either controls or FAP patients with no ASE imbalance. Interestingly, UM-11 family did not express a transcript skipping exon 11 that was present in other samples (data not shown). Finally, germline APC expression levels were lower in APC(−)/MUTYH(−) polyposis families (2.963±1.21) than in controls (p=0.04) or and APC(+) polyposis families with exon 15 mutations (p=0.01).
DISCUSSION
In this study we adapted the SNuPE (single nucleotide primer extension) methodology to perform a detailed allele-specific expression analysis of the APC gene in 59 FAP and AFAP families divided in two groups: those harboring a pathogenic mutation and those with no identified APC or MUTYH mutation.
In the presence of a detectable deleterious APC gene mutation, ASE imbalance was strongly associated with mutations located outside exon 15. Conversely, balanced ASE was common in cases with exon 15 mutations. Both observations fit, albeit imperfectly, with the nuclear scanning model of NMD in mammals10,12. Our observations are in disagreement with the findings of Renkonen and colleagues, who reported no ASE imbalance in a small series of 4 families harboring mutations in exons 6-9 of the APC gene, possibly due to differences in technique or sample processing20. To assess the contribution of NMD to the observed imbalance, lymphocytes were short-term cultured and treated with puromycin, a known inhibitor of NMD28. Similarly to previous observations, enhanced allelic expression imbalance was observed in vitro before puromycin treatment, pointing to higher degradation of nonsense transcripts associated with culture conditions29. Puromycin treatment
completely restored normal ASE in most of the cases analyzed. However, only partial reversion was achieved in the case showing the greatest imbalance prior to treatment (F-24, I-106), and it is unclear whether this can be attributed to the intensity of allelic imbalance, the limitations of the in vitro assay or other unknown causes.
As has been reported for MSH2, MLH1, BRCA1-2 and NF17-11, the nuclear scanning NMD model loosely fits with our observations for the APC gene. One of the exceptions is a mutation at intron 14 that creates a skipping of exon 14 and a PTC at the very beginning of exon 15 (data not shown) that associates with imbalanced ASE. This may be due to the special position of the PTC and its sequence context, both of which are factors known to influence the extent of NMD.
NMD can be considered a modifier of the phenotypic consequences of PTC and has contributed to our understanding of genotype-phenotype correlations in various genetic disorders30. In mutations outside exon 15, NMD may promote partial loss-of-function or haploinsufficiency. Of note, family 24, harboring a frameshift mutation at exon 12, showed the highest ASE imbalance and an attenuated phenotype. It can be speculated that, in this case, the mutant allele is degraded leading to a bigger proportion of wt APC homodimers and a milder phenotype. In mutations causing PTCs in exon 15, absence of NMD activity may enhance the dominant-negative effect. As such, it is notable that our preliminary observations indicate lower germline APC expression levels in polyposis with mutations outside exon 15. An exon-15-mutated allele is not amenable for degradation by NMD, so this mechanism cannot act as an additional regulatory mechanism. However, no clear phenotypic correlation between clinical features and location of the mutation was observed in our series.
Finally, imbalanced ASE was observed in the absence of a detectable mutation in a subset of
APC(−)/MUTYH(−) families assessed by conventional methods. A more detailed analysis of
NIH-PA Author Manuscript
NIH-PA Author Manuscript
cDNA and promoter regions revealed the presence of alterations in APC promoter that may be functionally relevant in one family, while in the other family a complex pattern of APC transcripts in the exon 11 region was of unknown significance. We cannot rule out the possibility that a genetic change deep within an intron may account for the observed ASE imbalance. In addition, cis-acting regulatory SNPs with an allele-specific effect on APC might also be responsible for the imbalance31. However, the failure to detect imbalances in most of the AFAP cases reflects a putative mechanism for their attenuated nature, which may be more closely related to subtle changes at the RNA level that could lead to delayed phenotypic expression of symptoms. In fact, germline expression of the APC allele is slightly lower in these APC(−)/MUTYH(−) and shows no apparent correlation with ASE imbalance.
Methodological issues should be taken into account in the interpretation of results and have both theoretical and practical implications. According to our own and others’ results, the SNaPshot approach is a suitable technique with excellent analytical sensitivity32-35. Importantly, pyrosequencing (a robust technique) yielded similar normal range values. In any case, the definition of cut-off values was improved by the inclusion of control set in every experimental run. The putative clinical relevance of borderline values emphasizes the importance of the controls. Sample processing is likely to influence the results. Aged blood has been shown to decrease NMD, thus precluding the detection of loss of allelic imbalance in the NF1 gene29. The balanced allelic expression of the two samples with mutations outside exon 15 may be due to differences in the isolation process of peripheral blood lymphocytes. Finally, the complex pattern of transcripts at exon 11 should be considered, as it might influence ASE results. Notably, we have identified the expression of transcripts with skipping of exon 11 in controls (data not shown).
Our results may have clinical implications. Allelic imbalances detected in a small proportion of APC(−)/MUTYH(−) families point to the presence of a pathogenic event in the APC gene. Although further studies are needed to elucidate the correlation between allelic imbalance and the disease in families with no detectable mutation, it could be used as a diagnostic marker of elusive mutations in the APC gene that might be otherwise only detected by the more costly conversion approach33 or by next-generation sequencing when implemented in the routine clinical setting. Based on our results, we propose a new molecular diagnostic algorithm for polyposis families that undergo APC mutation screening beginning with analysis of gross rearrangements (Figure 4). In samples with ASE imbalance, sequencing of exons 1-14 at the cDNA or gDNA level would be followed by analysis of the promoter region and, possibly, the 3′UTR region. This strategy would have made it unnecessary to sequence the largest exon of the gene (exon 15, 6574 bp) in approximately 21% of the families included in the present study (12/58). The pathogenic cause of the disease would remain unknown if sequencing of the whole coding region of APC and the promoter and 3′UTR regions, and cDNA transcript analyses targeting aberrant skipping or cryptic exons, revealed no functionally relevant changes. However, a processing protocol for preserving lymphocytes and RNA would be needed to incorporate this RNA-based assay into routine screening. Also, the addition of more polymorphisms as allele-specific markers would improve informativeness and dependability. We do not know whether missense or unclassified variants from introns 1-14 are associated with ASE imbalance. However, transcript-level analysis has shown that a significant proportion of these mutations can be classified as pathogenic and has revealed the presence of PTCs in some cases3.
Taken together, our results reinforce the importance of RNA-level studies not only for a better understanding of the disease but also for optimizing the molecular diagnostic algorithm for FAP.
NIH-PA Author Manuscript
NIH-PA Author Manuscript
Supplementary Material
Refer to Web version on PubMed Central for supplementary material.
Acknowledgments
Grant Support: - Spanish Ministry of Education and Science [AGL2004-07579-04, SAF 06-6084, SAF
2009-07319]
- Fundació “la Caixa” [BM 04-107-0]
- Fundació Gastroenterologia Dr. Francisco Vilardell [F05-01]
- Spanish Networks RTICCC [RD06/0020/1050, 1051], from the Carlos III Health Institute;
- Acción Transversal del Cáncer
- NIH/NCI R01, CA81488 and the University of Michigan Comprehensive Cancer Center grant P30 CA46592.
- Commission for Universities and Research of the Comissionat per a Universitats i Recerca del Departament d’Innovació, Universitats i Empresa Ministry of Universities, Research and the Information Society of the Catalan government and European Social Fund grant [2005FI-00809] to E.C.
Writing assistance: We thank Laura Valle for critical assessment and helpful comments on the manuscript.
Abbreviations
AFAP attenuated familial adenomatous polyposis
ASE allele-specific expression
FAP familial adenomatous polyposis
FISH fluorescent in-situ hybridization
MLPA multiplex ligation-dependent probe amplification
NMD nonsense-mediated decay
PTC premature termination codon
QMPSF quantitative multiplex PCR of short fluorescent fragments
SNuPE single nucleotide primer extension
REFERENCES
1. Lipton L, Tomlinson I. The genetics of FAP and FAP-like syndromes. Fam Cancer 2006;5:221–6. [PubMed: 16998667]
2. Heinimann K, Thompson A, Locher A, Furlanetto T, Bader E, Wolf A, Meier R, Walter K, Bauerfeind P, Marra G, Muller H, Foernzler D, Dobbie Z. Nontruncating APC germ-line mutations and mismatch repair deficiency play a minor role in APC mutation-negative polyposis. Cancer Res 2001;61:7616–22. [PubMed: 11606402]
3. Kaufmann A, Vogt S, Uhlhaas S, Stienen D, Kurth I, Hameister H, Mangold E, Kotting J, Kaminsky E, Propping P, Friedl W, Aretz S. Analysis of rare APC variants at the mRNA level: six pathogenic mutations and literature review. J Mol Diagn 2009;11:131–9. [PubMed: 19196998]
4. Aretz S, Stienen D, Friedrichs N, Stemmler S, Uhlhaas S, Rahner N, Propping P, Friedl W. Somatic APC mosaicism: a frequent cause of familial adenomatous polyposis (FAP). Hum Mutat
2007;28:985–92. [PubMed: 17486639]
NIH-PA Author Manuscript
NIH-PA Author Manuscript
5. Castellsague E, Gonzalez S, Nadal M, Campos O, Guino E, Urioste M, Blanco I, Frebourg T, Capella G. Detection of APC gene deletions using quantitative multiplex PCR of short fluorescent fragments. Clin Chem 2008;54:1132–40. [PubMed: 18487285]
6. Al-Tassan N, Chmiel NH, Maynard J, Fleming N, Livingston AL, Williams GT, Hodges AK, Davies DR, David SS, Sampson JR, Cheadle JP. Inherited variants of MYH associated with somatic G:C-->T:A mutations in colorectal tumors. Nat Genet 2002;30:227–32. [PubMed: 11818965] 7. Brinckmann A, Mischung C, Bassmann I, Kuhnisch J, Schuelke M, Tinschert S, Nurnberg P.
Detection of novel NF1 mutations and rapid mutation prescreening with Pyrosequencing. Electrophoresis 2007;28:4295–301. [PubMed: 18041031]
8. Chen X, Weaver J, Bove BA, Vanderveer LA, Weil SC, Miron A, Daly MB, Godwin AK. Allelic imbalance in BRCA1 and BRCA2 gene expression is associated with an increased breast cancer risk. Hum Mol Genet 2008;17:1336–48. [PubMed: 18204050]
9. Renkonen E, Zhang Y, Lohi H, Salovaara R, Abdel-Rahman WM, Nilbert M, Aittomaki K, Jarvinen HJ, Mecklin JP, Lindblom A, Peltomaki P. Altered expression of MLH1, MSH2, and MSH6 in predisposition to hereditary nonpolyposis colorectal cancer. J Clin Oncol 2003;21:3629–37. [PubMed: 14512394]
10. Tournier I, Raux G, Di Fiore F, Marechal I, Leclerc C, Martin C, Wang Q, Buisine MP, Stoppa-Lyonnet D, Olschwang S, Frebourg T, Tosi M. Analysis of the allele-specific expression of the mismatch repair gene MLH1 using a simple DHPLC-Based Method. Hum Mutat 2004;23:379–84. [PubMed: 15024732]
11. Perrin-Vidoz L, Sinilnikova OM, Stoppa-Lyonnet D, Lenoir GM, Mazoyer S. The nonsense-mediated mRNA decay pathway triggers degradation of most BRCA1 mRNAs bearing premature termination codons. Hum Mol Genet 2002;11:2805–14. [PubMed: 12393792]
12. Cartegni L, Chew SL, Krainer AR. Listening to silence and understanding nonsense: exonic mutations that affect splicing. Nat Rev Genet 2002;3:285–98. [PubMed: 11967553]
13. Aretz S, Uhlhaas S, Sun Y, Pagenstecher C, Mangold E, Caspari R, Moslein G, Schulmann K, Propping P, Friedl W. Familial adenomatous polyposis: aberrant splicing due to missense or silent mutations in the APC gene. Hum Mutat 2004;24:370–80. [PubMed: 15459959]
14. Yan H, Dobbie Z, Gruber SB, Markowitz S, Romans K, Giardiello FM, Kinzler KW, Vogelstein B. Small changes in expression affect predisposition to tumorigenesis. Nat Genet 2002;30:25–6. [PubMed: 11743581]
15. Powell SM, Petersen GM, Krush AJ, Booker S, Jen J, Giardiello FM, Hamilton SR, Vogelstein B, Kinzler KW. Molecular diagnosis of familial adenomatous polyposis. N Engl J Med
1993;329:1982–7. [PubMed: 8247073]
16. Venesio T, Balsamo A, Rondo-Spaudo M, Varesco L, Risio M, Ranzani GN. APC
haploinsufficiency, but not CTNNB1 or CDH1 gene mutations, accounts for a fraction of familial adenomatous polyposis patients without APC truncating mutations. Lab Invest 2003;83:1859–66. [PubMed: 14691304]
17. De Rosa M, Scarano MI, Panariello L, Carlomagno N, Rossi GB, Tempesta A, Borgheresi P, Renda A, Izzo P. Three submicroscopic deletions at the APC locus and their rapid detection by quantitative-PCR analysis. Eur J Hum Genet 1999;7:695–703. [PubMed: 10482959]
18. Kanter-Smoler G, Fritzell K, Rohlin A, Engwall Y, Hallberg B, Bergman A, Meuller J, Gronberg H, Karlsson P, Bjork J, Nordling M. Clinical characterization and the mutation spectrum in Swedish adenomatous polyposis families. BMC Med 2008;6:10. [PubMed: 18433509]
19. Venesio T, Balsamo A, Sfiligoi C, Fuso L, Molatore S, Ranzani GN, Risio M. Constitutional high expression of an APC mRNA isoform in a subset of attenuated familial adenomatous polyposis patients. J Mol Med 2007;85:305–12. [PubMed: 17143620]
20. Renkonen ET, Nieminen P, Abdel-Rahman WM, Moisio AL, Jarvela I, Arte S, Jarvinen HJ, Peltomaki P. Adenomatous polyposis families that screen APC mutation-negative by conventional methods are genetically heterogeneous. J Clin Oncol 2005;23:5651–9. [PubMed: 16110024] 21. Norton N, Williams NM, Williams HJ, Spurlock G, Kirov G, Morris DW, Hoogendoorn B, Owen
MJ, O’Donovan MC. Universal, robust, highly quantitative SNP allele frequency measurement in DNA pools. Hum Genet 2002;110:471–8. [PubMed: 12073018]
NIH-PA Author Manuscript
NIH-PA Author Manuscript
22. Groden J, Thliveris A, Samowitz W, Carlson M, Gelbert L, Albertsen H, Joslyn G, Stevens J, Spirio L, Robertson M, et al. Identification and characterization of the familial adenomatous polyposis coli gene. Cell 1991;66:589–600. [PubMed: 1651174]
23. Horii A, Nakatsuru S, Ichii S, Nagase H, Nakamura Y. Multiple forms of the APC gene transcripts and their tissue-specific expression. Hum Mol Genet 1993;2:283–7. [PubMed: 8388766]
24. Oshima M, Sugiyama H, Kitagawa K, Taketo M. APC gene messenger RNA: novel isoforms that lack exon 7. Cancer Res 1993;53:5589–91. [PubMed: 8242607]
25. Sulekova Z, Ballhausen WG. A novel coding exon of the human adenomatous polyposis coli gene. Hum Genet 1995;96:469–71. [PubMed: 7557972]
26. Sulekova Z, Reina-Sanchez J, Ballhausen WG. Multiple APC messenger RNA isoforms encoding exon 15 short open reading frames are expressed in the context of a novel exon 10A-derived sequence. Int J Cancer 1995;63:435–41. [PubMed: 7591245]
27. Thliveris A, Samowitz W, Matsunami N, Groden J, White R. Demonstration of promoter activity and alternative splicing in the region 5′ to exon 1 of the APC gene. Cancer Res 1994;54:2991–5. [PubMed: 8187087]
28. Andreutti-Zaugg C, Scott RJ, Iggo R. Inhibition of nonsense-mediated messenger RNA decay in clinical samples facilitates detection of human MSH2 mutations with an in vivo fusion protein assay and conventional techniques. Cancer Res 1997;57:3288–93. [PubMed: 9242462] 29. Pros E, Larriba S, Lopez E, Ravella A, Gili ML, Kruyer H, Valls J, Serra E, Lazaro C. NF1
mutation rather than individual genetic variability is the main determinant of the NF1-transcriptional profile of mutations affecting splicing. Hum Mutat 2006;27:1104–14. [PubMed: 16937374]
30. Khajavi M, Inoue K, Lupski JR. Nonsense-mediated mRNA decay modulates clinical outcome of genetic disease. Eur J Hum Genet 2006;14:1074–81. [PubMed: 16757948]
31. Milani L, Gupta M, Andersen M, Dhar S, Fryknas M, Isaksson A, Larsson R, Syvanen AC. Allelic imbalance in gene expression as a guide to cis-acting regulatory single nucleotide polymorphisms in cancer cells. Nucleic Acids Res 2007;35:e34. [PubMed: 17267408]
32. Bray NJ, Buckland PR, Owen MJ, O’Donovan MC. Cis-acting variation in the expression of a high proportion of genes in human brain. Hum Genet 2003;113:149–53. [PubMed: 12728311]
33. Valle L, Serena-Acedo T, Liyanarachchi S, Hampel H, Comeras I, Li Z, Zeng Q, Zhang HT, Pennison MJ, Sadim M, Pasche B, Tanner SM, de la Chapelle A. Germline allele-specific expression of TGFBR1 confers an increased risk of colorectal cancer. Science 2008;321:1361–5. [PubMed: 18703712]
34. Yan H, Yuan W, Velculescu VE, Vogelstein B, Kinzler KW. Allelic variation in human gene expression. Science 2002;297:1143. [PubMed: 12183620]
35. Zhang Y, Wang D, Johnson AD, Papp AC, Sadee W. Allelic expression imbalance of human mu opioid receptor (OPRM1) caused by variant A118G. J Biol Chem 2005;280:32618–24. [PubMed: 16046395]
36. Menendez M, Gonzalez S, Obrador-Hevia A, Dominguez A, Pujol MJ, Valls J, et al. Functional characterization of the novel APC N1026S variant associated with attenuated familial
adenomatous polyposis. Gastroenterology 2008;134:56–64. [PubMed: 18166348]
NIH-PA Author Manuscript
NIH-PA Author Manuscript
Figure 1. SNaPshot analysis of rs2229992 SNP as a quantitative test
Regression analysis of the amplification products of two homozygous control cDNAs mixed in different proportions and analyzed in triplicate by SNaPshot. Allele frequencies were calculated by the peak heights: freq. C = C/(C+kT), where the correction factor k is
determined from the mix simulating an actual allele frequency of 0.5 (5:5). Measured allele frequencies were plotted against the expected values. A near-linear relationship was observed across all data points (R2 = 0.9983).
NIH-PA Author Manuscript
NIH-PA Author Manuscript
Figure 2. Quantification of ASE in APC(+) polyposis patients
A. Distribution of APC ASE in controls, non-carriers and carriers of a pathogenic APC mutation from the ICO and UM subsets. ASE values are the proportion between the C and T allele frequencies of the APC coding SNP rs2229992. Each point represents the mean of the triplicate measurements, and each replicate was performed for all samples in each subset. Allelic ratios ranged from 0.646 to 8.706. The normal ASE cut-off range is indicated by dashed horizontal lines (at 1.168 and 0.836) and determined by control ASE values, as indicated in Patients and Methods. Three sample electropherograms obtained from the SNaPshot reaction, and their corresponding ASE values, are also shown. B. Box plots of ASE values for the location of the mutation in the APC gene. Patients were stratified into two groups by mutation site (“Outside e15”, mutation located from exons 1-14; and “Inside e15”, mutation located in exon 15). To give an overview of our results, ASE values are represented as the proportion of allelic frequencies between the underexpressed and the overexpressed allele in each sample, independently if whether it is C or T. The interquartile range includes 50% of the samples and is shown by white boxes. The interdecile range includes 90% of the patients and is shown as whiskers. Outliers are shown by empty dots. Mutated groups were compared using the non-parametric Mann-Whitney test.
NIH-PA Author Manuscript
NIH-PA Author Manuscript
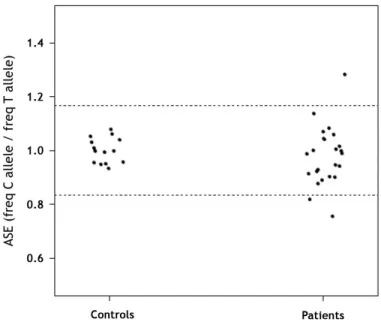
Figure 3. Quantification of ASE in APC(−)/MUTYH(−) polyposis patients
Distribution of APC ASE in controls and polyposis patients with no previously identified mutation. ASE values are the proportion between the C and T allele frequencies of the APC coding SNP rs2229992. Each point represents the mean of the triplicate measurements, and each replicate was performed for all samples in each subset. Allelic ratios ranged from 0.756 to 1.284. The normal ASE cut-off range is indicated by dashed horizontal lines (at 1.168 and 0.836).
NIH-PA Author Manuscript
NIH-PA Author Manuscript
Figure 4.
Proposed diagnostic algorithm for APC mutation screening including ASE measurement in polyposis families.
NIH-PA Author Manuscript
NIH-PA Author Manuscript
NIH-PA Author Manuscript
NIH-PA Author Manuscript
NIH-PA Author Manuscript
Table 1
Characteristics of the
APC
(+) polyposis families analyzed for ASE
Individual Family Phenotype Mutation * Exon or intron Type of mutation Reference ASE±SD (freq C/freq T) ASE (− )Puromycin (freqC/freqT) ASE (+)Puromycin (freqC/freqT) 41 8 FAP c.1958+3A>G i14 ^ Splicing 2 , 3 0.830±0.036 UM-6 UM-6 AFAP c.2004del; p.Leu669X e15 Frameshift This study 0.911±0.250 78 19 FAP c.2116del; p.Met706CysfsX12 e15 Frameshift This study 0.964±0.010 61 15 FAP c.2397T>A; p.Tyr799X e15 Nonsense 3 0.876±0.018 38 14 FAP c.2701C>T; pGln901X e15 Nonsense This study 1.062±0.025 39 14 FAP c.2701C>T; pGln901X e15 Nonsense This study 0.949±0.010 25 11 FAP c.2727del; p.Thr910LeufsX6 e15 Frameshift This study 0.964±0.032 127 27 AFAP c.3077A>G, p.Asn1026Ser e15 Missense [ 36 ] 0.974±0.049 97 9 FAP c.3183_3187del; p.Gln1062X e15 Frameshift 1 , 2 , 3 0.838±0.030 0.773 1.090 37 13 FAP c.3183_3187del; p.Gln1062X e15 Frameshift 1 , 2 , 3 1.055±0.093 100 22 FAP c.3183_3187del; p.Gln1062X e15 Frameshift 1 , 2 , 3 0.907±0.042 33 12 FAP c.3562del; p.Pro1188LeufsX77 e15 Frameshift This study 0.924±0.073 124 26 AFAP c.3631A>G; p.Met1211Val e15 Missense This study 0.892±0.050 UM-4 UM-4 FAP c.3688C>T; p.Gln1230X e15 Nonsense 1 , 2 , 3 1.015±0.121 66 16 FAP c.3838_3839del; p.Leu1280ValfsX4 e15 Frameshift This study 0.944±0.039 77 18 FAP c.3927_3931del; p.Glu1309AspfsX4 e15 Frameshift 1 , 2 , 3 0.950±0.023 76 17 FAP c.4189G>T; p.Glu1397X e15 Nonsense 1 , 3 0.943±0.013 81 20 FAP c.4393_4394del; p.Ser1465TrpfsX3 e15 Frameshift 1 , 2 , 3 0.932±0.045 96 21 FAP c.4393_4394del; p.Ser1465TrpfsX3 e15 Frameshift 1 , 2 , 3 0.951±0.039 23 10 FAP c.4608_4614del; p.Glu1536AspfsX27 e15 Frameshift This study 1.028±0.016 24 10 FAP c.4608_4614del; p.Glu1536AspfsX27 e15 Frameshift This study 1.009±0.049 UM-7 UM-7 AFAP c.4782_4785del; p.Ala1595ArgfsX54 e15 Frameshift This study 0.929±0.029 UM-1 UM-1 AFAP c.5936_5939del; p.Asn1979ThrfsX64 e15 Frameshift 1 1.054±0.039 UM-10 UM-10 AFAP c.5936_5939del; p.Asn1979ThrfsX64 e15 Frameshift 1 1.086±0.099 UM-8 UM-8 AFAP Deletion promoter-e4 ?-e4 Gross deletion This study loss of T
NIH-PA Author Manuscript
NIH-PA Author Manuscript
NIH-PA Author Manuscript
Individual Family Phenotype Mutation * Exon or intron Type of mutation Reference ASE±SD (freq C/freq T) ASE (− )Puromycin (freqC/freqT) ASE (+)Puromycin (freqC/freqT) 54 1 FAP c.423-2A>G i3 Splicing This study 0.738±0.031 0.621 0.997 161 2 FAP c.423-2A>G i3 Splicing This study 0.823±0.069 163 2 FAP c.423-2A>G i3 Splicing This study 0.853±0.028 165 2 FAP c.423-2A>G i3 Splicing This study 0.717±0.019 0.497 0.952 UM-2 UM-2 AFAP c.426_427del; p.Leu143AlafsX4 e4 Frameshift 2 1.155±0.061 UM-3 UM-3 AFAP c.426_427del; p.Leu143AlafsX4 e4 Frameshift 2 1.214±0.020 UM-9 UM-9 AFAP c.464_465del; p.Lys155ArgfsX12 e4 Frameshift This study 1.133±0.043 46 3 FAP c.607C>T; p.Gln203X e5 Nonsense 1 1.626±0.008 47 3 FAP c.607C>T; p.Gln203X e5 Nonsense 1 1.451±0.049 2.164 1.083 116 23 AFAP c.834+1G>A i7 Splicing 2 , 3 0.680±0.027 117 23 AFAP c.834+1G>A i7 Splicing 2 , 3 0.677±0.006 118 23 AFAP c.834+1G>A i7 Splicing 2 , 3 0.728±0.011 119 23 AFAP c.834+1G>A i7 Splicing 2 , 3 0.713±0.006 122 23 AFAP c.834+1G>A i7 Splicing 2 , 3 0.734±0.021 10 4 FAP c.834+1G>A i7 Splicing 2 , 3 0.682±0.029 11 4 FAP c.834+1G>A i7 Splicing 2 , 3 0.722±0.029 12 4 FAP c.834+1G>A i7 Splicing 2 , 3 0.646±0.024 13 4 FAP c.834+1G>A i7 Splicing 2 , 3 0.687±0.042 14 4 FAP c.834+1G>A i7 Splicing 2 , 3 0.725±0.014 18 5 FAP c.1262_1263delinsAA; p.Trp421X e9 Nonsense This study 0.779±0.022 21 5 FAP c.1262_1263delinsAA; p.Trp421X e9 Nonsense This study 0.721±0.024 0.525 1.069 106 24 AFAP c.1557_1561del; p.Cys520TyrfsX15 e12 Frameshift This study 7.911±0.337 13.800 6.353 107 24 AFAP c.1557_1561del; p.Cys520TyrfsX15 e12 Frameshift This study 8.706±0.468 108 24 AFAP c.1557_1561del; p.Cys520TyrfsX15 e12 Frameshift This study 8.387±0.882 105 25 AFAP c.1699G>T; p.Gly567X e13 Nonsense This study 0.804±0.022 0.692 1.090 63 6 FAP c.1660C>T; p.Arg554X e13 Nonsense 1 , 2 , 3 1.238±0.047 2.152 1.069 32 7 FAP c.1660C>T; p.Arg554X e13 Nonsense 1 , 2 , 3 1.223±0.039 2.255 1.153
NIH-PA Author Manuscript
NIH-PA Author Manuscript
NIH-PA Author Manuscript
SD
, standard deviation.
e, exon.
i, intron.
* Reference accession number: NM_000038. Imbalanced ASE values are depicted in bold letters. ^ Considered as exon 15-mutation because leads to a PTC in exon 15. For further details about the mutations reported we refer to three
APC
gene mutation databases: (1) the Universal Mutation Database
http://www.umd.be/APC/, (2) http://www.LOVD.nl/APC and .(3) http://www.hgmd.cf.ac.uk/ac/index.php
NIH-PA Author Manuscript
NIH-PA Author Manuscript
NIH-PA Author Manuscript
Table 2 Characteristics of the APC (− )/ MUTYH (−
) polyposis families analyzed for ASE
Individual Family Phenotype ASE±SD (freq C / freq T) ASE (− )Puromycin (freqC/freqT) ASE (+)Puromycin (freqC/freqT) 158 29 FAP 1.284±0.060 2.099 0.963 166 30 FAP 1.083±0.047 170 31 FAP 1.059±0.136 171 32 FAP 1.045±0.055 172 32 FAP 1.042±0.011 175 33 FAP 0.890±0.030 129 34 AFAP 0.947±0.034 132 35 AFAP 0.903±0.041 134 36 AFAP 1.016±0.066 136 37 AFAP 0.922±0.027 138 38 AFAP 0.988±0.019 140 39 AFAP 0.819±0.024 0.989 0.998 145 40 AFAP 0.991±0.025 147 41 AFAP 1.005±0.033 152 42 AFAP 0.901±0.047 153 43 AFAP 0.929±0.015 UM-11 UM-11 AFAP 0.756±0.122 UM-12 UM-12 AFAP 0.943±0.024 UM-14 UM-14 AFAP 0.914±0.034 UM-15 UM-15 AFAP 1.002±0.074 UM-16 UM-16 AFAP 1.138±0.026 UM-18 UM-18 AFAP 1.070±0.061 UM-19 UM-19 AFAP 0.877±0.029 UM-20 UM-20 0.999±0.073 SD