ALMA MATER STUDIORUM
UNIVERSITA’ DI BOLOGNA
SCUOLA DI SCIENZE
Corso di laurea magistrale in Biologia Marina
The ratio of plastic to plankton in the Mediterranean Sea
Tesi di laurea in Oceanografia Chimica
Relatore Presentata da Prof. Fabbri Daniele Fugagnoli Alice
Correlatore
Prof. Cózar Andrés
2
INDEX
1.
INTRODUCTION 31.1 PLASTIC 3
1.1.1 ORIGIN OF PLASTIC AND USES 3
1.1.2 TRANSPORT AND DEGRADATION 5
1.1.3 PLASTIC EVERYWHERE 10
1.1.4 PLASTIC ANALYSIS 21
1.1.5 EFFECTS OF MICROPLASTIC POLLUTION ON THE
ORGANISMS 23
1.2 PLANKTON 30
1.2.1 ZOOPLANKTON 31
1.2.2 PLASTIC AND ZOOPLANKTON 33
1.3 POSSIBLE SOLUTIONS 36
2.
PURPOSE OF THE RESEARCH 373.
MATERIALS AND METHODS 383.1 SAMPLING METHOD 38
3.2 PLASTIC ANALYSIS 44
3.3 PLANKTON ANALYSIS 48
3.4 DATA ANALYSIS 54
3.5 STATISTIC ANALYSIS 59
4.
RESULTS AND DISCUSSION 614.1 CONCLUSIONS 77
3
1 INTRODUCTION
1.1 PLASTICSince the beginning of the industrialization, the humankind is damaging the earth in a lot of different ways, but one of the major threat by now is the plastic pollution, started almost forty years ago, with mass plastic production, which impact has been only recently assessed. Plastic items are widely used because of their resistance and durability, and because plastic can be worked in such a way that can be useful in almost every area, but the features that make plastic items so useful, are the same that make them also very dangerous for the environment.
1.1.1 ORIGIN OF PLASTICS AND USES
Plastics are a family of hundreds of different materials, used for their different properties and designed to meet the needs of each application in the best way. Plastic material can be organic material bio based or fossil fuel based, both of them are recyclable and could also be bio-degradable. Currently the majority of the plastic materials are derived from fossil feedstocks such as coal, oil or natural gas. The two main categories of plastics are the thermoplastics and the thermosets.
Thermoplastics are a family of plastics that can be melted when heated and hardened when cooled and these characteristics are reversible, that means that the plastic item can be repeatedly reheated, reshaped and frozen. The most important types of that family of plastics are the Polyethylene Terephthalate (PET), Polypropylene (PP), Polystyrene (PS), Polyethylene (PE), Expanded Polystyrene (PS-E), Polyvinyl-Chloride (PVC), Polycarbonate (PC), Polyamide (PA), Poly Methyl Methacrylate (PMMA), Thermoplastic Elastomers (TPE), Polyarylsulfone (PSU) (figure 1.1.1.1).
Thermosets are a family of plastics that can chemically change when heated, creating a three dimensional network; after that process these plastics cannot be re-melted and reformed. The most important types of this family are: the Polyurethane (PUR), Epoxy resins, Unsaturated Polyester, Acrylic resins, Vinyl ester, Silicone and Phenolic resins.
4 Figure 1.1.1.1 Chemical structure of the mostly used plastic polymer, the Polyethylene Terephthalate (PET), Polypropylene (PP), Polystyrene (PS) and the Poly Methyl Methacrylate (PMMA) (Images from researchGate.net, AssignmentPoint.com and ResearchGate.net).
Globally, the world produced 335 million tons of plastic, in 2016, and in Europe 60 million of tons of it (PlasticsEurope2017). It is estimated that 10% of the worldwide plastic production ends up into the oceans polluting them ( Cole et al., 2011), and the ocean debris has been estimated to be made between 60% and 80% of plastic particles.
The most commonly polymers found as ocean pollutant are: Polyethylene that is mainly used for plastic bags, straws, bottles; the Polypropylene for ropes, bottles, nettings; the Polystirene is used for plastic utensils and food containers and there is also a wide use of the Nylon for netting and traps (Andrady, 2011) (Table 1.1.1.1).
Table 1.1.1.1 Classes of plastic that are commonly encountered in the marine environment (Table from Andrady, 2011).
5
Plastics, that are synthetic organic polymers, are very versatile and have been mass produced and moved into all aspects of everyday life. But, because of improper disposal, spillage from industrial plants, pollution by individuals, unloading of damaged nets at sea by fishing vessels and much more, the plastic items dumped in the sea are a real threat to all the marine ecosystem. This has been acknowledged just in the last few decades, since already in the seventies a member of the Council of British Plastic Federation and a Fellow of the Plastic Institute, stated that “plastics litter is a very small proportion of all litter and causes no harm to the environment except as an eyesore” (Derraik, 2002).
Since the seventies the plastic pollution problem has been widely acknowledged, and nowadays is considered one of the most important issues and a lot of studies are being made to have a better understanding of it, with the aim of solving this worldwide thread.
1.1.2 TRANSPORT AND DEGRADATION
There are two main categories of plastics: Macro and Micro plastics, that are classified by size. Microplastics have been attributed numerous size ranges, with diameters of < 10 mm, < 5 mm, 2-6 mm, < 2 m and < 1 mm, this inconsistency is a problem when comparing microplastics data from different studies (Cole et al., 2011). In this study, it will be considered microplastic when the item has a diameter < 10 mm. Macroplastics are generally bigger items, with diameter > 10 mm, and in recent years a lot of attention has been also focused upon the nanoplastics, tiny fragments about nanometric sizes. The microplastics items can be Primary or Secondary microplastics. The primary microplastics are manufactured to be of a microscopic size, as facial cleanser and cosmetics, as vectors for drugs in medicine and air blasting media. Since the eighties the natural components of the facial-cleansers have been substituted with microplastic spherules (figure 1.1.2.1), that have been found also in the environment, as white opaque polystyrene spherules of 0.2-1.17 mm diameter and translucent to clear of 0.9-2.5 mm diameter. These spherules could damage smaller fish causing an internal blockage and can also accumulate by adsorption, like other plastic litter, hydrophobic organic compounds such as PCB which can be, this way, delivered to the biota (Zitko et al., 1991).
6 Figure 1.1.2.1 Polystyrene particles isolated from a water-based cleaner (image taken from Zitko et al., 1991)
Primary microplastic has also been produced for the air blasting technology , that involve blasting acrylic polyester or melamine microplastic scrubbers at engines or machinery to remove paint and rust and, as these scrubbers are used repeatedly until their cutting power is still useful, they will often become contaminated with heavy metals.
Secondary microplastics are tiny fragments derived from the breakdown of bigger plastic items due to physical, chemical and biological processes that, with time, break down larger plastic debris. The increasingly abundance of the fragments has been demonstrated (Barnes et al., 2009) (Figure 1.1.2.2), and it’s leading to the pollution of the seas with smaller and smaller fragments, that is making the plastic problem harder to solve.
7 Figure 1.1.2.2 Microscopic plastic in surface waters, collected with continuous plankton recorder, show a clear evidence of the increasing of tiniest fractured plastic items (grey boxes are the number of plastic fibers, the dashed line is the plastic produced each year) (image taken from Barnes et al., 2009).
The fragmentation of plastic items happens especially in the main land, because of the higher oxygen, higher UV rays and abrasion. UV light and physical abrasion through wave action make plastic items fragile, causing the oxidation of the polymer matrix, leading to bond cleavage and fractures. Plastic litter on beaches is particularly subjected to very high temperatures, that, in summer, can rise up to 40 Celsius degrees; the light-initiated oxidative degradation is then accelerated at higher temperatures and, especially with opaque plastics, nearly all the initial oxidative breakdown occurs at the surface layers. Virgin pellets that does not contain UV stabilizers have a faster degradation, compared to that in plastic products. This model of oxidative degradation create a weak surface layer in the plastics leading to microcracks (figure 1.1.2.3). Therefore, the surface becomes to be susceptible to break down induced by temperature changes, humidity or abrasion against sand (Andrady, 2011).
8 Figure 1.1.2.3 From left to right: LDPE weathered in a weatherometer for 800h; PP exposed for one week under desert exposure conditions; PP exposed to a 600 watt xenon source for 6 weeks (image from Andrady 2011).
Plastic can release additives and chemical product added to the polymer to enhance durability and corrosion resistance, that could damage the biota. The loss of structural integrity due to the sunlight, and the consequent fragmentation due to the abrasion, is more difficult in the ocean, for this reason, if plastic items enter in the sea, they will be exposed to much lower temperatures, no abrasion and also the sunlight will be blocked by the water layers.
The biodegradable plastic could also be a source of microplastic pollutant, because it’s typically composed by synthetic polymers and starch, vegetable oil or other chemicals with the aim of accelerating the degradation time; but, this will happen only if properly disposed, in hot, humid and well aerated conditions, and still not all the plastic item will decompose. The starch and bio-degradable components will dissolve, but an abundance of synthetic polymers will be left behind. In the cold marine environment, without terrestrial microbes, decomposition times of biodegradable plastic will be prolonged too(Cole et al., 2011). Generally, the lifetime of plastic is hundreds to thousands years, but it is far longer in the deep sea and non-surface polar environments, even for the biodegradable one; this will make the plastic pollution one of the main problems for centuries.
A lot of studies demonstrated that the higher abundance of plastic is near the shore, where can be found plastic items less degraded by time and natural forces; this is because the mainland is the first and bigger source of plastic pollutant in the ocean. Land based sources, including beach litter, contributes to create the 80% of plastic litter. The global fishing fleet now use plastic gear an some can be lost or even discarded in the sea (not facing a lot of degradation and fragmentation because they directly go into the ocean); polyolefins (PE and PP) and nylon are primarily used in fishing gears
9
applications and 18% of the marine plastic debris its actually from the fishing industry. Another contributor to plastic pollution into the oceans is the aquaculture, for instance it has been found a lot of styrofoam (expanded polystyrene) near the sea-based activities, like mussels farms, that use Styrofoam as flotation device; or food sacks found in the area near salmon farms (Hinojosa et al., 2009). Into the marine plastic litter can also be found virgin resin pellets, due to incidental losses during ocean transport or through runoff from processing facilities. All of the other plastic marine litter come from the mainland, due to an incorrect disposal of the refuse, or lack of a proper filtration of waste waters and an irresponsible behavior of people, and due to the fact that the majority of the population worldwide is living near the coasts, that lead to millions of tons of plastic waste dumped into the oceans every year.
10
1.1.3 PLASTIC EVERYWHERE
Nowadays the marine litter is from 60 to 80% plastic litter, up to 90-95% in some areas (Moore, 2008). Although the main part of plastic pollution is coming from the mainland, nowadays it’ s possible to find plastic and microplastic pretty much everywhere in the sea, due to a number of reasons. First of all, driven by winds, currents, river outflow and drifts, plastic debris can be transported through vast distances, to remote and otherwise pristine locations such as the poles and tropical islands, where there is no population and no direct input of plastic litter, into the gyres and in ocean depths.
Coastlines receive plastic litter both from terrestrial and marine sources, it has been found out with beach sampling and analyzing the microplastics collected; it has been shown that there are some newer plastic fragments than others; it can be seen by the degradation level of the microplastic: yellow or darker color, caused by photo-oxidative damage, indicative of their longevity into the marine environment. The presence of a lot of microplastic fragments in the shore, can alter the physiochemical properties of the beach sediment, increasing its permeability and decreasing its heat absorbance. Such differences could affect marine biota as sea turtles, because temperature of the sand where they lay their eggs can affect sex determination in their offspring. The greater permeability affects the organisms that dwell into the sediment, driving them to desiccation (Cole et al., 2011).
Figure 1.1.3.1 Concentration of plastic debris in surface waters along the five subtropical gyres. The concentrations of microplastic fragments are higher into the orange and red spots (image from Cózar et al., 2014).
11
It has been assessed that plastic litter can be found globally on the surface of the oceans, mostly accumulating in the convergence zones of each of the five subtropical gyres (figure 1.1.3.1). The size distribution analyzed along the tropical gyres showed that there are important size-selective sinks, removing millimeter sized plastics from the floating debris, and transporting them deeper in the sea. These sinks could be driven by fast nano fragmentation of the microplastics into particles of microns or smaller, by the sinking of these particles due to the food webs and by ballasting processes.
After the Malaspina circumnavigation in 2010, samples of floating plastic litter have been collected from all over the world, confirming the major accumulation into the five subtropical gyres, with similar abundances. The gyre with more plastic fragments was the North Pacific Ocean’ s one, that alone contributes to the global plastic load with 33-35% of the plastic litter. This is due to the larger area of this Gyre and the higher density of population living on the eastern coast of the Asian continent, the most densely populated, with one-third of the global coastal population. Despite the growing quantity of plastic taken into the sea by storm-water runoff, the fact that at least 50% of the plastic litter is buoyant and the increasing fragmentation, it has been found a gap inside the size range sampled, especially near the 1 mm. This means that there is a loss of plastic from the oceans surfaces that could be due to a faster fragmentation of the smaller microplastics to a micrometer scale, with oceanic bacterial populations that might be contributing to this fragmentation process. Another explanation could be that, the smaller plastic particles have the highest surface to volume ratio, and the biggest one have a lot of surface and cavities, that can lead to the colonization of these plastic items by epiphytic organisms. This biofouled particles have a higher density and once that their density equals or is superior to the seawater one, they sink, therefore being removed from the floating debris, and could even accumulate into the seafloor. The biofouled microplastic rarely accumulates into the seafloor because, when submerged, it undergo at a rapid defouling process and return up to the surface. The defouling processes could happen due to the adverse conditions into the deep sea for epiphytic organisms as the decreasing solar irradiance, or due to the dissolution of the carbonates with the depth. Plastic fragments can enter into the water column also by ingestion by smaller organisms, mainly by zooplanktonic organisms as copepods, and zooplanktivorous fishes, entering this way also into the food chain. The microplastic ingested by these organisms can be secreted as fecal pellets and then sink (Cózar et al., 2014).
12
The Mediterranean sea, as a semi-closed sea, is a huge accumulation area for microplastic litter, as the gyres are (figure 1.1.3.2).
Figure 1.1.3.2 Comparing the Mediterranean and the Gyres: surface plastic concentration measured in the Mediterranean sea and in the inner accumulation zones for the Gyres (B) (Image from Cózar et al., 2015).
Mediterranean waters are dominated by millimeter-sized fragments, but showed a higher proportion of large plastic objects than that present into the oceanic gyres. This is easily explained by the nearest source of pollution, the Mediterranean coasts, and the shorter pathways that larger plastic objects need to travel in the basin. The Mediterranean is a particular accumulation site also because the water input from the Atlantic ocean travels in the upper layer of water when passing through the Gibraltar strait, and the flux of exiting water from the Mediterranean goes on the deeper layers in the Gibraltar strait, due to a density difference (due to different salinity), this water exchange is causing the entrance of plastic items that cannot go out from the Mediterranean because of their buoyancy and, then, accumulate into the Mediterranean sea.
13 Figure 1.1.3.3 Composition of the plastic litter collected in the Mediterranean sampling campaign and size distribution of the plastic items collected in the Mediterranean and in the oceanic gyres (image from Cózar et al., 2015).
The plastic items found in the Mediterranean sampling campaign (used for this research too) are pellets or granules, fishing threads, films, foams, fragments, with the majority of them being fragments of bigger items (87%). The distribution and shape of the plastic were similar to those found in the accumulation zones of the gyres, with a gradual increase in abundance of smaller fragments and a gap below 1 mm size (figure 1.1.3.3). And, as can be seen in the figure 1.1.3.4, there is a patchy distribution of the higher abundance of plastic items, due to the internal surface circulation of the Mediterranean.
14 Figure 1.1.3.4 Concentrations of plastic litter in the Mediterranean Sea basin, with the higher concentrations in red, orange and yellow, in decreasing order (image from Cózar et al., 2015).
The gap of smaller microplastics, around 1 mm size, can be explained by a particularly high removal rate from the surface waters in the Mediterranean, higher than the one in the gyres. This is due to a higher microplastic ingestion by zooplanktivorous fishes and higher ballasting by biofouling, because in the Mediterranean the ecosystem production is higher than in the subtropical gyres. The possible impact from the plastic pollution could be much higher in the Mediterranean than in other seas, because the Mediterranean one has an extremely high ecological and economical value, compared to its area that is only the 1% of the global oceans (Cózar et al., 2015).
Plastic sinks and plastic litter being present worldwide is proven also by the discover of plastic items in previously pristine environments, like the Arctic ocean (figure 1.1.3.5). In the Arctic ocean there isn’t as many coastal population as there could be in other coastal environments, this is one of the main reasons because the plastic litter found in the Arctic ocean is transported from other and distant sources. Another reason to explain that the plastic items aren’t local is that in the Arctic has been found a particular low density of bigger fragments, caused by the long transport and the accelerated fragmentation by the cycles of freezing and melting at high latitudes.
15 Figure 1.1.3.5 locations and concentrations of the plastic litter analyzed in the Arctic (image from Cózar et al., 2017).
The microplastic abundances in the Arctic are similar to the Mediterranean and gyres ones (figure 1.1.3.6). Arctic ocean is one of the major accumulation areas for plastic debris (Cózar et al., 2017)
16 Figure 1.1.3.6 typology and size distribution of the microplastic collected in the Arctic, compared to the ones from the Mediterranean and the subtropical gyres (image from Cózar et al., 2017).
Presence of microplastic debris has also been found worldwide, for instance in Portuguese waters, during a zooplankton sampling, in more than the half of the surface water samples (61%) microplastic has been found, with the major polymer being Polyethylene (PE), Polypropylene (PP) and Polyacrylates (PA) (Frias et al., 2014).
On the surface , plastic debris abundance and composition can vary, depending on the distance to coast, estuarine system or accumulation sinks. Water analysis near estruarine systems certified that they are the first source for plastic pollution, in fact, higher concentrations were found near them, with microplastic particles (0,5-5 mm) constituting more than the 90% of plastic debris analyzed, with the most frequent typology of plastic items as fibres, granules and films of transparent and colored plastics (Zhao et al., 2014). This is confirmed also by the annual variation of the abundance of microplastic, in fact, during the wet season, there are higher levels of plastic litter,
17
transported into the sea by the higher flux of water transported by the rivers during this season (Cheung et al., 2016). Regarding the distance to land it has been found that, in the Mediterranean sea, there is a higher concentration of plastic debris in the 1 km water strip adjacent to coast, ranging from 28000 to 578000 items on km2; then between 1 to 10 km to coast, the concentration is lower and then again reached high values in more distant waters. The higher abundance of microplastic near shore is due to the proximity of land-based sources and the most abundant type of plastics are PE, PP, PS and PA, with a higher abundance of the polyamides (PA) on the surface waters, as nylon, due to the higher density of the Mediterranean. The particular distribution pattern of the Mediterranean sea could be the result of the combined effect of wind, water current and faster fragmentation of plastic objects near shore and an efficient removal of small fragments from the surface (Pedrotti et al., 2016). Moreover it can be found also a deposition pattern of the coastal shallow plastic debris, with spatial variation and preferential grain size. In the Mediterranean Marine Protected Area’s coastal sediment a higher concentration of microplastic has been found, deriving from the nearest populated coast, and the plastic debris was always present into the grain size fraction of 2-1 mm and 1-0.5 mm (Alomar et al., 2016)
From a numerical modeling of floating debris in the world’s oceans it can be predicted where the major plastic accumulation areas will be. Considering both the terrestrial and maritime sources of microplastics, the highest abundance is predicted to be in five accumulation areas, in the subtropical latitudes of the major ocean basins. In the modeled previsions there will be a clear dominance in the accumulation zones of the northern hemisphere, due to the higher population density (Lebreton et al., 2012). The general design of this model was confirmed with the global study of plastic debris in the open ocean in 2014 by Cózar et al.
In order to analyze the distribution of plastic items through the water column, is necessary to understand some basic physical and dynamical properties of microplastics in the marine environment. Physical properties like the size, shape and density define the behavior and fate of the microplastics in the sea, their motion in turbulent and stratified marine environment, the residence time in different habitats and the biofouling celerity. For lighter microplastics floating at the surface as foamed polystyrene, the most important characteristic is the windage; light spherical particle can roll over the water surface, speeded up by the wind, and that is the reason why positively buoyant particles are widely dispersed across the oceans. For slightly buoyant particles like polyethylene
18
and polypropylene a key factor is the biofouling, that is more likely to happen for fibres and film particles, instead of spherical ones, due to the surface proportion. Polyethylene films stay in the euphotic zone for 6-8 months before sinking for the biofouling, spherical particles (with the same weight) instead can take 10 to 15 years to sink. For heavier particles there is a faster sinking, usually about a day (example with Baltic Sea depths) (Chubarenko et al., 2016).
There could also be a selective onshore transport of mesoplastic, leaving the smaller plastic items more distant from coast (figure 1.1.3.7). This is caused by a combination of buoyancy force, friction and Stroke drift. Polyethylene and Polypropylene, both lighter than seawater, if mixed by a turbulent flux, can lead to this selective transport because the bigger plastic fragments tends to move upward faster than the smaller one, due to their buoyancy. Meanwhile the wind waves in shallow coastal water can cause an onshore mass transport velocity, the Stroke drift, that is always faster in the upper layers than in the deeper ones, and for this reason the mesoplastics will be carried onshore faster than the microplastic (Isobe et al., 2014).
Figure 1.1.3.7 Schematic view of the mesoplastics selective transport on the coast (image from Isobe et al., 2014).
This can be seen also by a modeled vertical distribution regarding the size of plastic debris. It has been found that, for polyethylene (PE) plastic particles, exposed to a turbulent flux, similar to the marine condition, the vertical profile changes. There is a clear difference between the vertical dispersion of small and large microplastics, positive buoyant polymers like PE and PP of size > 1 mm are floating in a manner similar to the macroplastic one from which they have been fragmented. Half of the
19
microplastics about the size of 100 µm are expected to be found in the upper layer (< 24 m and nearly any particle under 56 m); smaller fragment, about 10 µm size, are expected to be found for the half of the concentration above 33 m, and nearly any particle under 80m of depth (figure1.1.3.8) (Enders et al., 2015).
Figure 1.1.3.8 Modelled vertical distribution of polyethylene (PE) in three sizes (10-100-1000 µm) (image from Enders et al., 2015).
Microplastic litter accumulates also in the sediment of the seafloor and with higher concentrations than the ones in the open ocean. A study in the Gulf of Mexico found microplastics in each sample collected (figure1.1.3.9), with PP and PE as the most abundant polymer, with polystyrene, polyester and aliphatic polyamide also present but with lower quantities. It has also been found a gradient in miroplastic abundance, with the areas that are more exposed to marine currents and tides, also have the higher abundance and diversity, as well as more dense polymers as polyester (Wessel et al., 2016).
20 Figure 1.1.3.9 Example of the microplastic fragment found in the Gulf of Mexico (image from Wessel et al., 2016)
In the Baltic bottom sediments have been found microplastic items too; in all of the samples, with fragments observed near the coastline and films far from it, the fibres instead were higher near the shore and slowly decreasing in abundance while moving away, this could be explained by the different physical properties of the microplastic and the different near-bottom current velocities. With this background spatial pattern could be explained. Concentration of microplastic particles increased with sediment sorting, that indicates that, plastic particles with a certain hydrodynamic characteristic tend to deposit in a similar way to sand grain of a similar size, and generally concentrate in areas with well-sorted sands. In areas without well-sorted sands, the currents can change their velocity and the plastic debris is resuspended (Zobkov et al., 2017).
21
1.1.4PLASTIC ANALYSIS
Microplastics suspensions can be identified using electron microscopy (that uses a beam of electrons to create an image of the specimen, with more accurate results than the optical microscopy), optical microscopy, FTIR spectroscopy (Fouries transform Infrared spectroscopy, used to obtain the infrared spectrum of the materials analyzed) and Raman spectroscopy (used to observe low-frequency modes in a system, based on the monochromatic electromagnetic radiation diffused by the sample analyzed).
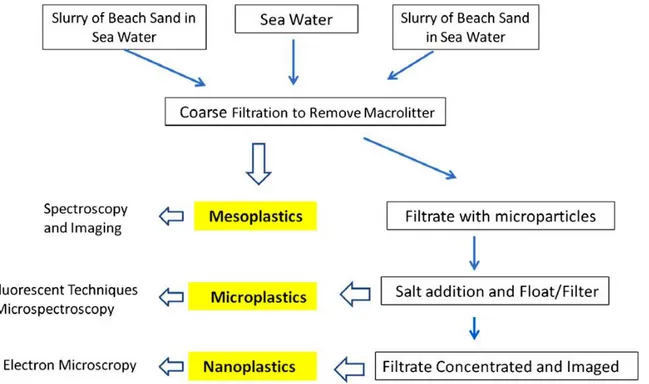
Figure 1.1.4.1 Proposed scheme for isolation of plastics from samples of water and sand (image from Andrady, 2011).
Regarding the isolation of plastic particles from the debris collected with them, Andrady proposed a scheme in 2011, in Figure 1.1.4.1. Usually, to separate microplastic particles from the sediment, with the principle of elutriation (figure 1.1.4.2), it has been used a density based separation, due to the much higher density of the sand, using a saturated sodium chloride solution. However, the plastic density can vary a lot, depending on the polymer, between 0.9 to 1.6 g cm-3, and the saturated sodium chloride solution usually used has a density of 1.2 g cm-3, that means that, denser plastic particles are not extracted. The results of that error is that, high density plastic type as PVC and PET are overlooked, resulting into an underestimation of the total amount of plastic in the sample. Instead of the conventional saturated NaCl solution, it
22
can be used a sodium iodide solution (NaI), that is more expensive but far more recyclable, that can lower the costs a lot (Claessens et al., 2013).
Figure 1.1.4.2 Elutriation: schematic representation of the elutriation column, used to separate microplastic items from the heavier sand particles (image from Claessens et al., 2013).
The extraction of microplastic items from the tissue of organisms is usually made by chemical digestion with acids. Wet acid destruction is usually made with the Avid mix Method (acid destruction with a mixture of nitric acid at 65% and perchloric acid at 68%) and Nitric acid Method (using a 69% solution of nitric acid). Both the methods are equally efficient in isolating plastic debris from soft tissues of marine organisms (Griet et al., 2015).
An innovative approach, to characterize plastic items, that has been used in this research too, is the hyperspectral imaging (HIS). This methodology can compare the spectrum of the virgin plastic polymers, with their specific wavelengths, taken as references, and the spectrum obtained analyzing environmental microplastics. This can give a higher accuracy and a confirmation of the plastic nature of the smaller debris, providing an extremely useful analysis instrument. A common automatic classification system was developed and can recognize polyethylene(PE), polypropylene (PP) and polystyrene (PS), the main types of plastic debris found in the oceans (Serranti et al., 2018).
23
1.1.5 EFFECTS OF MICROPLASTIC POLLUTION ON THE ORGANISMS
Microplastics and plastic debris have chemical additives to preserve them, that can be released into the environment, plastic can also absorb a lot of polluting substances and transfer them to the biota. Moreover, plastic is not only a thread for entanglement or ingestion, but can also transport alien species, contributing to the diversity loss of the local species.
Microplastic items are made with dangerous chemicals to enhance their durability and resistance, but with time and degradation of the items, these substances can be released into the environment or to the organism ingesting microplastics, being a risk for the biota. The basic polymer is incorporated into a mixture with additives and chemical compound to improve the performance, ageing and functionality properties of the polymer. The four main categories of additives are the functional additives (plasticizers, stabilizers, antistatic agents, lubricants, flame retardants, biocides), colorants, fillers (talk, mika, clay, barium sulphate) and reinforcements as glass or carbon fibers. The emission of these additives can happen during all the phases of the plastic item life cycle and affect the wildlife if the plastic waste is not properly disposed (Hahladakis et al., 2018).
Plastic polymers can also carry persistent organic pollutants (POPs) that can also be a thread to marine organisms (figure 1.1.5.1). Persistent organic pollutants are synthetic organic compounds, present all over the world on land and marine environment, and considered as the most persistent anthropogenic organic compound introduced into the environment. POPs are highly toxic and can have a lot of chronic effects like endocrine disruption and mutagenicity. These pollutants are chemically stable and not easily degraded in the environment or organisms, moreover, they are lipophilic and accumulate in the food chain. For instance the Polycyclic aromatic hydrocarbons (PAHs) are a group of chemicals formed during the incomplete burning of coal, oil and garbage, are toxic and tend to accumulate in aquatic organisms. These pollutant are accumulated by plastic items, because of the permeable lipophilic nature of plastic (Rios et al., 2007).
24 Figure 1.1.5.1 Plastic fragments where POPs were found, particularly the polycyclic aromatic hydrocarbons (PHA), polychlorobiphenyl (PCB) and dichlorodiphenyltrichloroethane (DDT) (image from Rios et al., 2007).
The PCB and DDT pollutant are found worldwide, carried by plastic polymers, that absorbed the pollutants in the mainland and then carry them into the sea. The absorption of DDT and PCB pollutant by plastic is higher if the plastic items have a longer residence period in contact with them; the combination of this factor, along with the time spent reaching the ocean and the residence period in the ocean, can vary the
25
pollutants concentration in different plastic debris. Anyway, the concentration of PCB and DDT was higher near the countries that still use these chemicals, or have been using them for a long time (figure 1.1.5.2) (Ogata et al., 2009).
Figure 1.1.5.2 Global median PCB and DDT concentrations, in beached plastic pellets (Ogata et
26
Plastic debris are also able to absorb heavy metals and other pollutants from the environment, which can be transferred to marine organisms. Filter feeders are one of the most susceptible categories to be impacted. They are not selective feeders and can inhale microplastic. Marine organisms do not have the specific enzymatic pathways to break down the synthetic polymer, that, if not expelled, can remain stuck inside the filter feeder. Fishes can ingest the microplastics confusing them with prey, or because they are already inside a lower trophic level prey. The pyrene (one of the additives), for instance, can cause an oxidative damage, significantly decreasing the predatory performances, with consequences for juvenile growth rate and survival of the species. Cetaceans are non-selective feeders too, and can ingest microplastic. Plastic debris has also been found in dolphins, whales and humpback whales, increasing the pollutants loads and resulting in pathology and mortality in cetaceans. Marine turtles are subjected to plastic ingestion too, often mistaking bigger plastic bags for jellyfish (turtles are visive predators), or ingesting already contaminated prey. Plastic ingestion in marine turtles can obstruct their stomach and gut, reducing the feeding stimulus, that can lead to malnutrition and death; moreover, if great amount of positively buoyant plastic are ingested, this can affect the turtle capacity to dive. Plastic ingestion in marine turtles can also alter their immune system functioning, making them more susceptible to diseases such as fibropapillomatosis.
There is also a huge risk of entanglement in discarded nets or bigger plastic debris for marine organisms, like fishes, cetaceans, turtle, seabirds and many others. The entanglement can lead to drowning and physical abrasions with lost of limbs due to necrosis (figure 1.1.5.3).
Microplastics can also damage microalgae, that can absorb nanoplastic particles with the result in photosynthesis inhibition and oxidative damage.
27 Figure 1.1.5.3 Images of marine animals in distress because of macroplastic debris. From up left: seabirds found dead because of the plastic ingested, baby seal entangled in a discarded net, marine turtle and whale entangled in plastic discarded nets (images from: professionalespcm.org, DeMilked.com, NationalGeographic.com, focusingonwildlife.com).
Comparisons with the IUCN Red List highlighted that, at least 17% of species affected by ingestion and entanglement, are listed as threatened or near threatened (Gall et al., 2015).
Microplastics can affect the totality of the environment, starting from key species as the polychaete lugworm, an important bioturbator that reworks the sediments where it lives, contributing to the distribution of ammonium (NH4 -), nitrite (NO2 -) and nitrate (NO3 -) between water column and sediments; with the ingestion of microplastic this lugworm has a reduction of primary productivity. Planktonic organism can ingest microplastic too, with negative impacts on single individuals and ecosystem (Guzzetti et al., 2018).
Planktivores, suspension feeders and filter feeders in the upper water column can ingest low-density microplastic such PE and excrete them with fecal pellet that tend to sink. This and the biofouling can make the microplastic sink at bigger depths, making it available for benthic organism ingestion. Through this process, plastic items can undergo a defouling process, that takes them in the upper layer of water again. This cyclic pattern can make microplastics available to organisms at different depths of the water column at different time, affecting all the environment (figure 1.1.5.4).
A lot of commercial fishes also mistakenly prey on microplastic instead of zooplankton, and it has been found that their larvae do it too, taking microplastic pollution up to the food web, up to us, bioaccumulating the pollutants (Wright et al., 2013).
28 Figure 1.1.5.4 Potential pathways for the transport of microplastic items and their biological interaction (image from Wright et al., 2013).
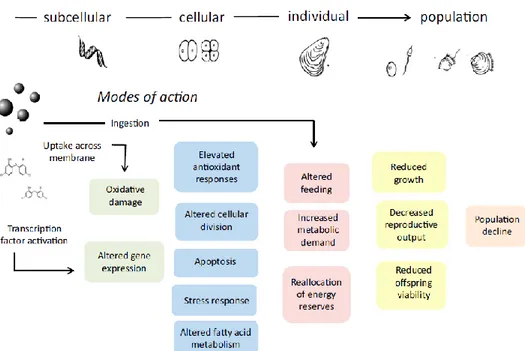
Microplastics fragments have also been found inside a lot of bivalves, suspension feeders cultured for human consumption, with potential damages for the marine organisms at many levels (subcellular as altered gene expression, cellular as apoptosis, individual as altered feeding and population level) (figure 1.1.5.5), and through translocation, nanoplastics can pass through the cells and accumulates into the soft tissues of the mussels, accumulating into the haemolymph and haemocytes (Galloway et al., 2016). As a result of this contamination, the annual dietary exposure for European shellfish consumers can amount to 11000 microplastics each year (Cauwenberghe et al., 2014).
29 Figure 1.1.5.5 Scheme of the consequences of microplastic ingestion by filter feeders, showing potential pathways like the uptake across the membranes and chemical release with adverse outcomes in growth inhibition and reproductive decline (image from Galloway et al., 2016).
There are many organisms affected by plastic pollution, from planktonic primary producers, to filter feeders, at all level of the food web (figure 1.1.5.6). Planktivorous fishes can directly ingest plastic or plastic-contaminated plankton, these small fishes are then eaten by bigger predators, up to the food chain, via biomagnification, to tunas and other top predators, up to us, polluting ourselves.
Figure 1.1.5.6 Microplastic contamination through the food chain, leading to the biomagnificaton of the pollutants that plastic debris contain (image from Wordpress.com).
30
1.2 PLANKTON
Plankton have virtually colonized all the types of marine habitats and depths, with many climatic parameters influencing planktonic composition. The plankton is composed by viroplankton, bacterioplankton, mycoplankton, phytoplankton, zooplankton (table 1.2.1). The planktonic composition depends most of all from temperature, but also atmospheric circulation has a strong effect on surface currents, upwelling and the structure of the water column, wind intensity, prey-predator encounter rates and nutrient supply rates. Wind direction can also affect benthic organisms by his control of the dispersal of meroplanktonic species. Incident solar radiation influence sea surface temperature and the structure of the water column. In addition to climatic factors, plankton distribution can also be influenced by marine environmental factors as dissolved oxygen that must remain high enough for respiration, mixed layer depth, bathymetry, pH, light penetration, salinity and sediment type, with macronutrients as limiting factor for primary production. All these conditions change around the globe and oceans are therefore highly heterogeneous at all spatial scales (Castellani et al., 2017).
Table 1.2.1 General composition and size range of the main planktonic groups, the nekton is also indicated for comparison (image from marinespecies.org).
31
1.2.1 ZOOPLANKTON
Zooplankton consist of heterotrophic plankton, including metazoans (multicellular animals) and single celled protozoa as flagellates and ciliates. The epipelagic zone is a habitat where there aren’t many places where to hide to avoid predation, this is why zooplanktonic organisms have evolved some strategies to avoid predation. Many different phyla have evolved body transparency, to avoid visual predators (which can be other zooplanktonic organisms or zooplanktivorous fishes). Another strategy is avoiding the epipelagic zone during the day, through daily migration to depth (diel vertical migration DVM). Zooplankton migrate to the surface in order to feed at night, avoiding sunlit surface waters when they can be more easily seed and preyed upon. Another distinct property of pelagic realm is that the zooplanktonic organisms can grow very fast, with almost a logarithmic increase during their juvenile stage.
The zooplankton is fundamental for the biochemical cycles; with his structure can profoundly affect chemical cycling nutrients and particle export and sequestration of organic material. Zooplankton is the bigger consumer of primary production across the oceans, and through the metabolism play a key role in recycling carbon, nitrogen and other elements. Microzooplankton (< 200 µm) are the principal grazers, and once that primary production is consumed, the organic matter goes through respiration, excration and egestion processes. Microzooplankton is the primary regenerator of ammonia (NH4+), and mesozooplankton is more important in vertical export in the biological pump with the sinking of fecal pellets. In this way the CO2, that is fixed by phytoplanktonic organisms in the euphotic zone, is transported to the deep ocean, regulating the air-sea CO2 exchange (figure 1.2.1.1) (Castellani et al., 2017).
32 Figure 1.2.1.1 Biological pump and importance of the zooplankton in the air-water CO2 cycle
33
1.2.2 PLASTIC AND ZOOPLANKTON
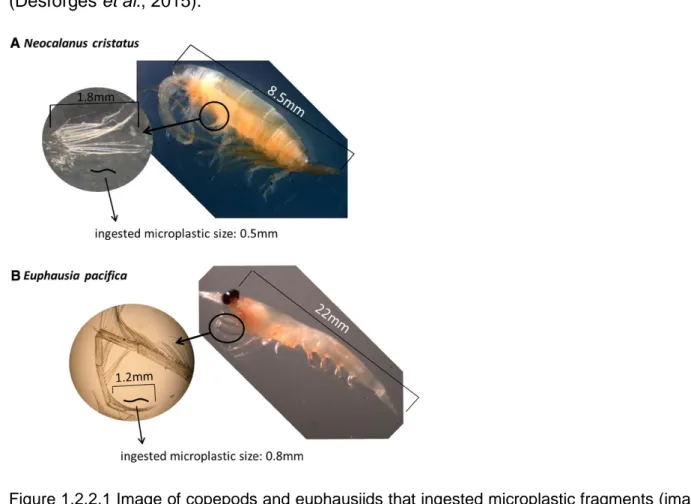
Zooplanktonic organisms have to feed collecting food particles in a very dilute suspension and have to clear daily a water volume that is 106 time their body volume. They are passive and active ambush feeders, current-feeders where the prey is intercepted directly, retained in a filter or individually perceived and extracted from the current. This means that they are non-selective feeders (they select only by size) and can mistake microplastic fragments for food and then ingest them (Kiorboe., 2011). Plastic ingestion by zooplanktonic organisms has been assessed by numerous studies. In the North Pacific Ocean have been found copepods, the main organism about zooplankton composition, and euphausiids that ingested microplastic fragments that are within the physical limits of mouth gape and handling capacity of setae (figure 1.2.2.1) (Desforges et al., 2015).
Figure 1.2.2.1 Image of copepods and euphausiids that ingested microplastic fragments (image from Desforges et al., 2015).
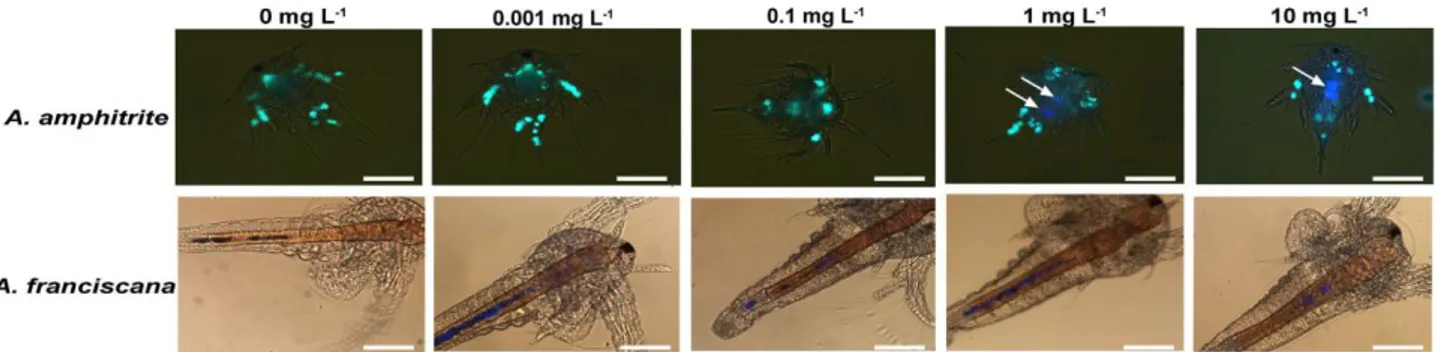
Polystyrene, one of the most abundant plastic polymer on the ocean surface, has been found to be lethal or sub-lethal if ingested for zooplanktonic crustaceans (figure 1.2.2.2). The ingested microplastic can cause significant swimming speed alteration, altered
34
enzyme activities, indicating that neurotoxic effects and oxidative stress are induced by microplastics, until getting to death (Gambardella et al., 2017).
Figure 1.2.2.2 Microscopy images of nauplii and larvae revealing polystyrene microplastic inside the invertebrates (image from Gambardella et al., 2017).
Studies focused on copepods have found that micro polystyrene particles (figure 1.2.2.3) (0.05, 0.5 and 6 µm size) are ingested, because of the copepods non selective feeding habits and can cause harm and mortality of nauplii and copepods, with a significant decrease in survival rates, with a size dependent effect (Lee et al., 2013).
Figure 1.2.2.3 Fluorescently labeled polystyrene beads ingested by nauplii and adult copepods (A1 and B1 are fecal pellets egested by the adults) (image from Lee et al., 2013).
Polyethylene terephthalate can have a toxic effect too on copepods if they ingest microplastic particles, it can affect mortality, productivity, population size and gene
35
expression. Because of the key position of copepods as link between primary producers and higher trophic marine organisms, the thread of microplastic for them is very important also at an environmental level. Calanoid copepods that have been found to have ingested microplastic fragments have a significantly decreased reproductive output and altering the feeding capacity, with a generally lower survival rate (Cole et al., 2015). Polyethylene can also have effect on the total number of eggs layed by the copepods, with a lower hatching rate and lower survival rate of the nauplii, because of the lack of energy assumed, due to the non assimilable nature of the plastics (Heindler et al., 2017).
Microplastic can be ingested by planktivorous fishes, also used for human consumption, too, that mistake the plastic particles for zooplankton (figure 1.2.2.4). The fragments can block the fishes guts, causing starvation and death and can also lead to an endocrine damage due to the chemicals in the plastic fragment (Tanaka et al., 2016).
Figure 1.2.2.4 Microplastic ingested by 77% of the sampled anchovy in Japan sea. Scale bar of 500µm (image from Tanaka et al., 2016).
Plastic ingestion by planktivorous fishes has been demonstrated also in the North Pacific Gyre, where it has been found that 35% of the fishes sampled had ingested microplastic (figure 1.2.2.5) (Boerger et al., 2010).
36 Figure 1.2.2.5 stomach of a zooplanktivorous fish under a dissecting microscope, with plankton and plastic (image from Boerger et al., 2010).
All these studies depict a worrying problem, with huge potential impact on wildlife all over the world. A lot of oceanographic campaigns were made, to measure zooplankton and plastic concentrations in the oceans: in the North Western Mediterranean Sea (Collignon et al., 2012), in the bay of Calvi (Mediterranean-Corsica) (Collignon et al., 2014), in the North Pacific Central Gyre (Moore et al., 2001), in the West United States (Lattin et al., 2004) and others. In all of them an impressively high number of plastic has been found, regarding buoyant plastic or in the water column and with a particularly abundance in the seafloor. This highlights a ubiquitous and real problem threatening everyday all the biota, us included (Miranda et al., 2016).
1.3 POSSIBLE SOLUTIONS
Unfortunately there are not many solutions regarding the already fragmented microplastics, due to a lack of tools to collect them without damaging other biota. Future plastic entries into the ocean should be prevented, using less plastic in the everyday life and optimizing their disposal. The macroplastic debris actually present in the oceans can be collected with nets or floating systems, as currently do nonprofit organizations. It has been also recently discovered a bacteria, Ideonella sakaiensis, able to digest PET polymers, but under very strictly environmental conditions. The problem must be studied as much as possible, to find more and better solutions.
37
2 PURPOSE OF THE RESEARCH
The present work aims to provide an analysis of the current state of the Mediterranean waters, regarding zooplankton community and plastic pollution, using the abundance ratio of plastic to plankton as ecological indicator about potential impact of this emerging kind if pollution on food chain. By the first time, the plastic : plankton ratio is used to assess the plastic pollution at wide spatial scale.
The results of this research will be incorporated into an international project at the global scale. At European level, the results will be used by the working group responsible for the elaboration of the ecological indicators to be included in the UE Marine Strategy Framework Directive in relation to the marine plastic pollution. The present work is intended to provide a better understanding of the main factors controlling the plastic : plankton ratio, suggesting to use it in an easy and comparable way as well as a first assessment for the Mediterranean basin. Specifically, we tried to define most suitable size range to determine plastic to plankton ratios, in order to outline a simple and efficient analysis method. To reach these aims, here we used samples collected during extensive samplings of the Mediterranean Sea and Gibraltar Strait.
38
3 MATERIALS AND METHODS
3.1 SAMPLING METHODSamples were collected during two oceanographic cruises. The first one around the Mediterranean Sea in 2013, collected 37 samples, 20 of them analyzed for this research. During the second one, 83 samples were collected in the Strait of Gibraltar in 2015, being 22 of them analyzed for this research.
The history of plankton sampling starts nearly 200 years ago, in 1828 a surgeon, Dr. J. Vaughan Thompson, made a plankton net to sample larger zooplankton organisms. On the Beagle, Darwin used a small net, and in 1844 Müller used a small-meshed conical net to catch minute creatures, his net was just a simple cone attached to a rigid ring, which could be operated by hand from a pole (Fraser et al.,1968).
During decades sampling design and techniques were developed and improved until reach the actual methodology. The most important features are mesh size, volume filtered, depth of sampling and speed of tow. Since plankton size vary between 2 µm and 1 m (Fraser et al., 1968), one difficulty has been that organism smaller than the mesh size go through the meshes in an unknown quantity, dependent on theirs shape and the degree of clogging. The material used must have clear-cut meshes of constant size, and the larger ratio possible of area of mesh aperture to the area of the strands used. Bolting silk was generally adopted in the past but it resulted to have two major faults: it can rot and it can shrink. Now synthetic fibres such as nylon and perlon are used because they are not susceptible to these faults. The gauze used in in plankton nets can influence the size of the catch, the filtration efficiency, mesh velocity drag, clogging, and the condition of the catch. For these reasons, the plankton gauze should have square meshes and with a uniform aperture, the material of the net should be strong enough to resist bending or stretching, but enough flexible too, to allow self-cleaning action.it should resist clogging and allow the complete removal of the material after use and should be strong enough to resist at sunlight degradation and cleaning processes with chemicals.
Regarding the volume of water filtered, it was one of the first essentials in quantitative plankton sampling, and this knowledge has vastly improved from the original simple calculations based on length of tow and area of mouth, however the answer was still a guess-work, because of the clogging, affecting the filtration efficiency in an unknown
39
measure. That is the reason why, during modern sampling, flowmeters are used; this particular instrument went through a lot of modifications since the first model, developed in 1915, the main lines of advance have been in reducing fragility without interfering with the free-running, and in recording depth together with volume filtered. The siting of the meter was very important, enclosing the whole sampling apparatus inside a container and measuring the outflow beyond the net, will probably give a more accurate register. However, the best site for the meter must be based on a study of the flow patterns, which may not be equally distributed, even in the tail.
Closing nets were an important innovation, allowing to sample at different depths without having a lot of bycatch. Because biologists wanted to sample the strata in which they were interested without getting the catches contaminated from other layers, they invented closing nets in all sort of patterns. The tail of a descending net should not collect plankton on the way down, it can be left open during the descent and closed only after reaching the required distance. The most widely accepted method was the Nansen’s one: the net was throttled a convenient distance from the mouth and hauled by a throttling line, because plankton in front of the throttle would be lost, that part was made of canvas or other impermeable material, or a very coarse netting. Lately, enclosing the net in a container with a reduced opening has permitted various kinds of opening and closing stoppers to be fitted.
Another important problem is how to find out that the nest has reached the desired depth and that has its own history of development. It’s easier to measure the length of wire out for vertical tows, but it could be a drift and the wire won’t be vertical. It could be done an allowance by the angle above the water measured, but the problem is that the angle of the wire below water could be very different and it only can be guessed. The modern solutions are: the depth flowmeter, which can give also a picture of the track of the net, with this information available only after the withdrawal of the net; a telemetering system which send the data to the ship through a cored cable or by sound impulses picked up, after being transmitted through water, by a towed microphone; or an apparatus that can open and close the gear at a predetermined depth.
The data used for this research were taken analyzing the samples collected during two oceanographic campaigns, the first one in the Mediterranean sea, in 2013, and the second one in the Gibraltar Strait in 2015.
40
During both the oceanographic campaigns, it has been used a neuston net with a 1x0.5m mouth size and 200 µm mesh size (figure 3.1.1); during the Gibraltar campaign it has been used also a second neuston net, near the first one, with 20 µm mesh size to collect smaller plankton and plastic debris (but these samples were not analyzed for this research).
Figure 3.1.1 Neuston net used during the Mediterranean oceanographic campaign. From this picture it can be seen that the net is collecting the first layer of water, thanks to the use of special floats (image taken by Marina Sanz-Martin)
During the Mediterranean oceanographic campaign it has been used the research vessel, from the Spanish Institute of Oceanography, Angeles Alvariño (figure 3.1.2) (46.7 m length). All the instruments of the onboard scientific equipment are cable-connected to the MDM 500 server, creating a system able to collect, share and store data. The research vessel is equipped with an EM710 Multibeam, TOPAS PS18, EA600, EK60; ME70 scientific multibeam echo sounder; a High Precision Acoustic Positioning and underwater navigation system HiPAP 500, Net sounder FS20/25 and Net monitoring ITI. VMADCP 150 kHz RD Instruments, Net monitoring SCANMAR; Met. Station AANDERAA 3660, CUFES 600 l/min, Termosalinographer SB21, Fluorometer TURNER 10AU, Hull mounted Video digital Camera OE14-122 (Eurofleets.eu).
41 Figure 3.1.2 Angeles Alvariño research vessel, used during the oceanographic campaign in the Mediterranean Sea in 2013 (image from eurovessel.eu).
During the sampling phase, the flowmeter was attached to the net, measuring the initial and final flow, and allowing the next calculation of the total amount of water analyzed. All of the other instruments used were on the boat and were used to take the data regarding the exact time of the start and end of the sampling, in both UTC and GMT system, the initial and final coordinated of longitude and latitude, taken both in Degrees and Radiant and the distance to coast. Permission for navigation and research operations in exclusive economic zones of the Mediterranean Sea was granted from the Governments of Spain, Greece, France, Italy and Cyprus. Sampling did not involve endangered or protected species. The aim of this oceanographic campaign was to extensively sample the Mediterranean area following a homogeneous coverage of the study area, regarding of sea and weather conditions. There was no problem of closing the net before putting it in the water because only the neustonic layer of water has been analyzed; the contamination risk from other layers has been avoided. The neuston net were towed at 2–3 knots for periods of ~15 min, sampling a total of 28 sites from 39 net tows.
On board, the material collected was carefully removed from the net, to the cod-end, with filtered seawater. All the material collected in each tow was preserved in a 4% formaldehyde solution, to prevent the planktonic organisms to degrade, only the jellyfish have been extracted, due to their bigger size and the problem that, gelatinous
42
organisms tend to degrade, all of the organisms were measured and photographed and all the information has been inserted in the excel file created during the sampling cruise. Each sample has been labeled and conserved in bottles with hermetic closure and then transported back to the Instituto Universitario de Investigacion Marina (INMAR) laboratories.
During the Gibraltar oceanographic campaign it has been used the Spanish research vessel Sarmiento de Gamboa (figure 3.1.3) (70.5x15.5 m), built in 2007 and still active. The sampling campaign lasted since 22-09-2015 to 10-10-2015 and covered the Strait of Gibraltar’s area.
Figure 3.1.3 Sarmiento de Gamboa research vessel used during the oceanographic campaign in Gibraltar in 2015 (Image from marinetraffic.com).
The aim of that particular oceanographic campaign was to verify if there could be any difference, in the same area, in plankton and plastic abundance from day to night time. The research vessel passed multiple times over the sampling area and the samples were collected to have an even distribution during all the 24h. All the measurements were taken by the instruments present in the research vessel (initial and final flowmeter data, latitude, longitude and time of the beginning and ending of sampling for each station, distance to coast calculated with the coordinates and the kind of the tide, that could be Nipe tide or Spring tide ).
43
It has been used a neuston net to collect the samples, similar to the one used in the Mediterranean campaign, but with a smaller net attached to the structure, this second net had smaller mesh, about 20 µm and could collect smaller organisms that could have been potentially lost in the bigger net. Anyway, the sample collected with the second and smaller net were not analyzed for this research but they will able to provide more information for future research if necessary. At the end of each sampling, all the organisms were collected in the cod-end, with the aid of a low-pressure spray with filtered seawater to remove the organisms stuck inside the meshes. When all the organisms have been removed from the net, they’ve been placed into bottles with hermetic closure in a 4% formaldehyde solution to prevent the degradation of the organisms, and then transported to the Instituto Universitario de Investigacion Marina (INMAR) laboratories.
44
3.2 PLASTIC ANALYSIS
Plastic and plankton analysis were the same for both the samples of Gibraltar and the Mediterranean. The samples have been conserved in rooms monitored and without natural light to prevent the samples degradation. Each sample has been washed with 20 µm filtered seawater into a 200 µm filter, under a hair extractor fume hood, to wash the sample from formaldehyde. The sample has been then put into a glass container with filtered seawater and analyzed by the operator with a dissecting stereomicroscope. All the plastic items were carefully picked up from the sample using density separation, and all the procedure was double checked to ensure the detection of all the smallest plastic particles. The extracted plastic particles were washed with deionized water and let out to dry at room temperature. Once completely dried the smaller plastic particles have been weighted with a semi-micro analytical balance (Figure 3.2.1) (Ohaus, Explorer, which provide information about five decimal places) placed into a tiny space, surrounded and closed by glass walls, to prevent the air flowing inside which can possibly alter the balance measurement, in order to have the highest accuracy possible (Figure 3.2.2). The bigger plastic fragments were weighted on a digital balance (Nahita 5041/200, with weight range from 200 g to 0,1 g).
Figure 3.2.1 Semi micro analytical balance used to weight smaller plastic fragments (image taken by Ohaus.com)
Figure 3.2.2 Isolation box for the semi micro analytical balance (Image taken by Alice Fugagnoli)
45
After being weighted, all the fragments were placed into petri dish of known diameter/length and photographed with a Nikon D800, placed 5 cm above the petri dish (knowing the distance and knowing the diameter of the petri dish allow us to precisely calculate the measurements of the fragments) (figure 3.2.3). All the fibers suspected of being of a textile origin were identified according to rigidness and shape. They typically range from hundreds of micros to centimeters in length and from one to few tens of microns in width, and they are easily distinguishable from pieces of fishing threads because these last are wider and generally straight in shape. However, they were excluded because they could be airborne contamination from the clothes of the researchers during the sampling or analyzing process.
Figure 3.2.3 Example of a picture taken with the Nikon D800 of a plastic item found in the MMTV14 Gibraltar station, with a piece of graph paper to have the measurement references (used if the petri dish was too big to be taken in the picture) (image taken by Alice Fugagnoli).
Plastic items were then assigned to five product type categories: industrial pellets (the raw from plastic), granules (likely derived from cosmetic and cleansing products); rigid fragments ( correspond to pieces from broken objects); foamed plastic; thin films (bags, wrappings, or pieces of them); and fishing threads (including fishing lines and plastic fibers released from fishing nets).
46
The maximum linear length of the smaller plastic items was measured using the image analysis software (ImageJ), and the larger items were measured with a ruler. Overall, a total of 3901 plastic items were measured and divided into 28 size classes to build a size distribution. Each plastic item has been also classified by color and transparency or opacity.
Some of the plastic items analyzed were then sent to the RawMa-Lab (Raw Materials Laboratory) of the Department of Chemical Engineering, Materials and Environment at the Sapienza University in Rome, Italy, to be analyzed with the technique of hyperspectral imaging system working in the SWIR (1000-2500 nm) range (figure 3.2.4).
Figure 3.2.4 Photo of plastic Items analyzed with the hyperspectral imaging system (image from Serranti et al., 2018)
During this analysis, the selected reference polymer samples, chosen for spectral features comparison with those of the “unknown” samples, as polyethylene (PE), polypropylene (PP) and polystyrene (PS), were characterized by a density lower than that of sea water, because the plastic particles collected were floating particles (figure 3.2.5).
Figure 3.2.5 Photo of the samples used as reference for the identification of the collected marine microplastic, virgin polypropylene (PP), polyethylene (PE) and polystyrene(PS) (image from Serranti et al., 2018)
The aim of this analysis was to confirm the typology of the polymers (PE or PP or PS) of the plastic items found during the sampling campaign, comparing the hyperspectral
47
images obtained from the analysis of the samples, with the spectra of the reference and known polymers (figure 3.2.6).
These three main polymers showed different spectral signatures (figure 3.2.7), according to their chemical structure, and a final classification of the plastic items into these main categories has been made possible and certain with the hyperspectral analysis (Serranti et al., 2018).
Figure 3.2.6 Part of the plastic items analyzed, with the source image and prediction maps image, with PS (yellow), PP (green), PE( blue) (image from Serranti et al., 2018).
Figure 3.2.7 Example of the raw spectra of PP, PS and PE reference samples (image from Serranti et al., 2018).
48
3.3 PLANKTON ANALYSIS
Plankton from Mediterranean Sea and Gibraltar Strait were analyzed at the laboratory from INMAR institute. Due to temporal limitation, a subset of samples were chosen (20/37 for the Mediterranean and 22/83 for the Strait of Gibraltar), maintaining spatial and temporal homogeneity.
Each sample, representing a sampling station, has been drained from the formaldehyde with a 200 µm filter, and put inside a 4% formaldehyde solution colored in pink with the rose Bengal tint, under the hair extractor fume hood, and left at least 24h to allow the color to impregnate the tissues of the organisms (figure 3.3.3.). After that period of time the sample has been drained from the colored formaldehyde and washed with water, in a 200 µm filter and under hair extractor fume hood.
Due to the high density of organisms, zooplankton samples were divided into N subsamples using a plankton splitter (figure 3.3.1). Thus, sample was split into ½, ¼, 1/8, 1/16, 1/32, 1/64 depending on zooplankton abundance. In just one case the sample had so few organisms that was not split at all.
Figure 3.3.1 Plankton splitter used to fractionate the plankton sampling by making it tilt to mix the plankton and water and have an even distribution before split it, to maintain its representativeness (image from aquaticresearch.com).