Università di Pisa
Facoltà di Medicina e Chirurgia
Scuola di Specializzazione in Radiodiagnostica
Direttore: Prof. Carlo Bartolozzi
Tesi di Specializzazione
Modified RECIST criteria after transarterial
chemoembolization of hepatocellular carcinoma:
CT-pathologic correlation in 178 liver explants
Relatore:
Chiar.mo Prof. Carlo Bartolozzi
Abstract
Aims: To retrospectively evaluate agreement between modified RECIST criteria
(mRECIST) assessed at Computed Tomography (CT) and pathology in a large series of patients with hepatocellular carcinoma (HCC) who were transplanted after transarterial chemoembolization (TACE).
Materials and Methods: From January 1996 to December 2010, 178 patients
(M/F=155/23; mean age 55.8±6.3 years) with HCC underwent TACE followed by liver transplantation (LT). Two blinded independent readers retrospectively reviewed CT examinations, performed in the interval between TACE and LT, to assess tumor response to TACE according to mRECIST. On the explanted livers, percentage of tumor necrosis was pathologically classified as 100%, 90-99%, 50-90%, <50% and 0%.
Results: At latest CT examination, the objective response rate was 77.5% (138/178),
with 86 cases (48.3%) of complete response (CR). A good intra- (k=0.75 and 0.86) and inter-observer (k=0.81) agreement was obtained. Out of 302 nodules, sensitivity and specificity of CT in detecting complete necrosis were 87.5% and 68.9%, respectively. On a per-patient basis, agreement between mRECIST and pathology was obtained in 119 patients (66.9%), with 20 cases (11.2%) of underestimation and 39 cases (21.9%) of overestimation of tumor response at CT. The majority of overestimations (26/39,
66.7%) consisted of patients with CR and 90-99% necrosis. CT sensitivity and specificity in differentiating between responders and non-responders were 92.3% and 82.9%, respectively.
Conclusions: CT can overestimate tumor response, by missing minimal residual viable
tumor. Nonetheless, mRECIST criteria assessed at CT after TACE are reproducible and reliable, with high accuracy in differentiating responders and non-responders.
Introduction
Hepatocellular carcinoma (HCC) is the fifth most common cancer in the world and its incidence is increasing worldwide [1]. Liver transplantation (LT) represents the only curative option for both tumor and underlying cirrhosis in properly selected patients [2,3]; however, limited organ availability and late diagnosis reduce the chances for LT. Loco-regional therapies, such as percutaneous ablation and transarterial
chemoembolization (TACE), represent valid options to improve survival in non-surgical patients [2,4,5], as well as to bridge the patients or to downstage the tumor allowing transplantation [6-8]. The increased use of loco-regional therapies in the treatment of HCC has raised the issue of the best modality to measure response rate. In fact, the World Health Organization (WHO) criteria (which measure change in tumor size) underestimate the actual response rate [9]; thus, they were amended in year 2000 by a panel of experts convened by the European Association for the Study of the Liver (EASL) to take into account treatment-induced tumor necrosis [10]. More recently, the Response Evaluation Criteria in Solid Tumors (RECIST) guideline was proposed as a method for measuring treatment response based on tumor shrinkage [11-12]. However, RECIST criteria can be misleading when applied to molecular-targeted therapies or loco-regional therapies in HCC [13]. Therefore, recent guidelines proposed the EASL criteria, also called modified RECIST (mRECIST) criteria, as valid means to assess HCC response to treatment, by recognizing residual viable tumor [14,15]. However, so far, there are only few data regarding the accuracy of mRECIST compared to the gold standard, represented by pathologic studies of explanted livers.
Purpose of this retrospective, single-center study was to evaluate agreement between mRECIST and pathologic results in a large series of HCC patients who were
Materials and methods
This is a single-institution retrospective study of consecutive HCC patients who were treated by TACE followed by LT from January 1996 to December 2010. The study protocol conformed to the ethical guidelines of the 1975 Declaration of Helsinki; informed written consent was obtained from each patient.
We searched our database collecting all the patients who were transplanted for HCC after TACE from January 1996 to December 2010 (220 patients). We excluded patients who did not perform Computed Tomography (CT) examination of the abdomen in the time interval between TACE and LT. Our final study population included 178 patients (M/F=155/23; mean age 55.8±6.3 years, range 36-68 years). The mean tumor nodules number was 2±1.3 (range 1-6) with a mean size of 46.3±27.1 mm (range 10-130 mm).
TACE protocol
Digital Subtraction Angiography (Multistar, Siemens, Erlangen, Germany) of hepatic and mesenteric arteries was performed immediately before TACE to map vascular liver anatomy, to evaluate the presence of arterio-venous shunts and to identify arterial feeders of the tumor. All procedures were performed under local analgesia, antibiotic prophylaxis (ceftriaxone, 1g/die at day 0, +1 and +2) and antiemetic drugs. TACE was performed by selective catheterization of the hepatic segmental arteries supplying the lesions, using either 5-F catheters or 3-F coaxial microcatheters.
In patients treated by Lipiodol-TACE, a mixture of iodized oil (Lipiodol UltraFluid; Laboratories Guerbet, Aulnay-sous-Bois, France) and doxorubicin hydrochloride (Adriblastina; Pfizer Italia srl, Borgo San Michele, Italy) was injected, followed by selective arterial embolization using an emulsion of grated gelatin sponge particles (Spongostan Standard; Johnson and Johnson Medical Limited, Gargrave, Skipton, UK).
The amount of administered iodized oil (10-20 mL; mean 17 mL) and doxorubicin (50-75 mg; mean 55.0 mg) was decided on the basis of number and diameter of lesions. The drug-eluting beads (DEB)-TACE protocol consisted in the superselective injection of 2-4 ml of DC Beads 100-300 µm (Biocompatibles UK, Farnham, Surrey, UK) loaded with doxorubicin (50 mg per vial; range 25-100 mg; mean 55 mg). The beads were mixed with a volume of non-ionic contrast medium prior to delivery, using a ratio of 1:3.
TACE was considered technically successful when the target lesions were fully embolized, as demonstrated by selective angiography performed at completion of the procedure.
CT follow-up
After TACE, CT was scheduled at 1 month and every 3 months thereafter.
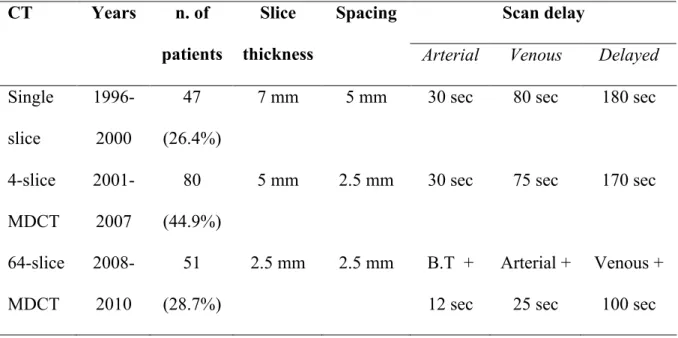
CT protocol included a non-enhanced acquisition followed by triphasic (arterial, venous and delayed phases) acquisition after intravenous injection of iodized contrast medium (120-130 mL) at a flow rate of 3-4mL/sec. The protocol varied according to the CT equipment available at the time of the procedure (Table 1).
Image analysis
CT examinations performed after TACE were collected; if patients underwent multiple CT examinations in the interval between TACE and LT, the examination performed at the time point closest to the time of transplantation was reviewed.
Two independent radiologists (6 and 12 years of experience, respectively), blinded to the histopathology findings, were asked to review preprocedural and post-TACE CT images and assess tumor response according to mRECIST [14,15]. Complete response (CR) was defined as the disappearance of any intratumoral arterial enhancement in all
target lesions; partial response (PR) was defined as ≥30% decrease in the sum of diameters of viable portion of the target lesions, with the baseline sum of the diameters of target lesions as a reference. Progressive disease (PD) was considered as a ≥20% increase in the sum of the diameters of viable target lesions, with the lowest sum of the diameters of viable target lesions recorded since the treatment started as a reference. PD also included the presence of new lesions, at least 1 cm in size, with the typical
enhancement pattern for HCC. Finally, stable disease (SD) was defined as any cases that did not qualify for CR, PR or PD.
Viable tumor was defined as contrast uptake in the arterial phase and washout in portal venous and/or late venous phases. After Lipiodol-TACE, comparison of the
non-enhanced and the arterial phase images was required to discriminate between iodized oil and contrast uptake. Any area of absent Lipiodol uptake was regarded as suspicious for the presence of viable tumor. In those areas quantitative measurements were obtained placing a Region-of-interest (ROI) in all phase images and using the criteria proposed by Kim et al [16]: a difference in attenuation value of at least 20 HU between the unenhanced phase and at least one of the contrast-enhanced phases was considered indicative for viable tumor.
Each reader performed the image evaluation twice, after an interval of at least 7 days, to assess intra-observer variability.
Reference standard: Histopathology Analysis
After LT, gross and fine histological analysis of the explanted livers was performed by two experienced pathologists (20 and 15 years of experience, respectively). Gross examination of the livers was performed after cutting the liver into thin slices (5-10 mm
thickness) in parallel to the plane of the round ligament; routine hematoxylin and eosin staining was used to prepare the slides. The precise location and size of any intrahepatic nodule were recorded. Each macroscopically identified nodule was microscopically analyzed and classified. The treated lesions were examined for the presence of viable tumor tissue, and percentage of necrosis was classified as: 100% (absence of any viable tissue); 90-99% (persistence of minimal viable tissue); 50-90% (significant necrosis); <50% (minimal necrosis); 0% (absent necrosis).
Statistical analysis
Statistical analysis was performed with SAS software (SAS Institute, Cary, NC). Data were analyzed via descriptive statistics (mean and standard deviation, SD) and compared by the Chi-square or Fisher exact tests (categorical data), as appropriate, and paired t test (continuous data).
Intra- and inter-observer agreement was calculated by the weighted kappa (k) test. A nodule-by-nodule analysis was conducted to assess sensitivity, specificity, positive predictive value (PPV), negative predictive value (NPV), and accuracy of CT in the prediction of complete necrosis.
On a patient-by-patient analysis, agreement between mRECIST and histopathology findings was evaluated by the weighted kappa (k) test, assuming the correspondence between 100% necrosis and CR, 50-99% necrosis and PR, <50% necrosis and SD/PD. A P value of less than 0.05 was considered as statistically significant.
Results
Out of the entire series, 156 patients (87.6%) underwent Lipiodol-TACE, whereas 22 cases (12.4%) were treated by DEB-TACE; the latter group had a significantly lower number of tumor nodules (mean 1.4 versus 2.1, P=.03).
The mean interval between TACE and LT was 168 ± 120 days (range, 32-802), whereas the mean interval between CT and LT was 65 ± 57.4 days (range, 1-468).
Histopathology findings
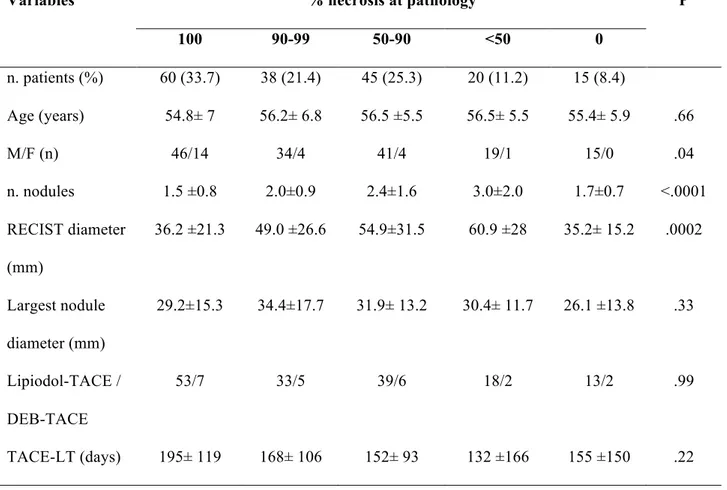
The analysis of the explanted livers revealed the presence of complete necrosis in 60 patients (33.7%), whereas minimal residual viable tumor was depicted in 38 livers (21.4%) (Table 2).
The extent of necrosis was significantly affected by the tumor nodules’ number and size, while it was not related to other variables, such as the interval between TACE and LT or the TACE protocol.
CT findings
Intra-observer agreement was good (k=0.75 for Observer 1 and k=0.86 for Observer 2); inter-observer agreement was rated as good to excellent (k=0.81).
The objective response rate at CT was 77.5%, with 48.3% CR (86/178 patients), 29.2% PR (52/178 patients), 12.9% SD (23/178 patients) and 9.6% PD (17/178 patients). Mean tumor size and number of nodules were significantly lower in the CR group (P=.01 and P=.0007, respectively).
Nodule-by-nodule analysis
Forty-eight nodules (in 34 patients) diagnosed as HCC at CT were not confirmed at pathology; conversely, 24 nodules (in 16 patients) identified on the explants were missed at CT examination.
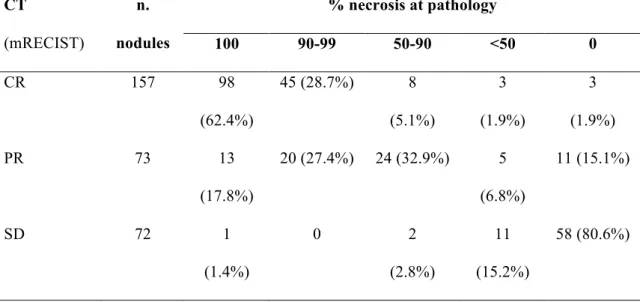
Out of a total of 302 nodules (mean size 24.6 ±14.5 mm, range 10-80mm) detected at CT and confirmed at pathology, 157 lesions (52%) were considered completely necrotic at CT (Table 3). Sensitivity, specificity, PPV and NPV in detecting complete necrosis at CT were 87.5%, 68.9%, 62.4%, 90.3%, respectively, with 75.8% diagnostic accuracy (Figure 1).
The agreement between CT and pathologic findings was not significantly affected by variables, such as nodules’ size, TACE protocol, CT equipment, TACE-LT interval and CT-LT interval.
Patient-by-patient analysis
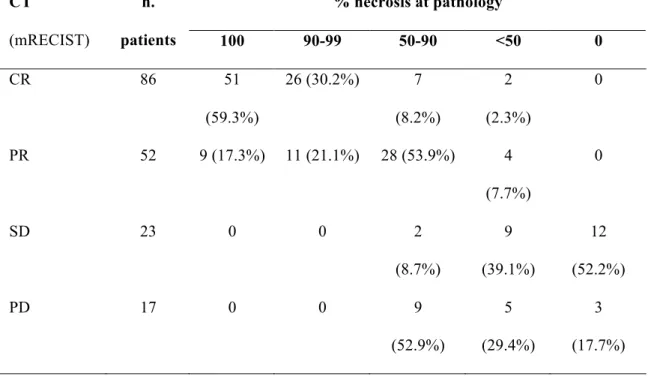
Comparison between mRECIST and tumor necrosis is presented in Table 4. Overall agreement was obtained in 119 patients (66.9%), with 20 cases (11.2%) of
underestimation and 39 cases (21.9%) of overestimation of tumor response at CT. These results were not significantly influenced by variables such as TACE-LT interval, CT-LT interval, TACE protocol and CT equipment.
The majority of overestimations (26/39, 66.7%) consisted of patients classified as CR, who presented minimal residual viable tumor (>90% necrosis) at pathology (Figure 2). When comparing responders with non-responders (Table 5), CT accuracy reached 90.4%, with 92.3% sensitivity, 82.9% specificity, 95.7% PPV and 72.5% NPV. PD was due to the detection of new lesions in 9/17 patients. All of these patients were classified as having 50-90% necrosis at pathology (Figure 2). When excluding these patients from the analysis of the results, CT accuracy resulted to be 95.3%, with 98.5% sensitivity, 82.9% specificity, 95.7% PPV and 93.5% NPV.
Discussion
Measurement of tumor response after treatment is of major importance for patients’ management in clinical practice, as well as for evaluating the outcomes of clinical trials [14].
The development of loco-regional therapies in HCC has raised the issue on how to assess radiological tumor response. In fact, the limitations of WHO and RECIST criteria, which are based on tumor shrinkage, have been widely demonstrated [13]. Thus, mRECIST criteria have been introduced to standardize radiological assessment of tumor response in HCC, based on estimation of tumor necrosis [10,14,15].
There are only few studies evaluating the accuracy of mRECIST compared to
pathologic data, which pointed out the limitations of mRECIST in terms of specificity in detecting tumor necrosis [17-19]. Riaz et al proposed the use of the product of WHO and EASL (mRECIST) criteria to increase diagnostic accuracy [19]. However, this type of evaluation seems to be a little more complex and its widespread application may have some limitations.
The present study reports the results of large cohort of patients who were transplanted after TACE from 1996 to 2010.
In our series, complete necrosis was achieved in 33.7% of the patients and 37% of the nodules, whereas 58% of the treated nodules showed >90% necrosis. This was
comparable to previous reports on chemoembolization [8,17,20]. As expected, pathologic necrosis was significantly higher when the tumor extension was more limited. On the other hand, necrosis was not influenced by the time elapsed between TACE and LT [17]; also, TACE protocol did not influence tumor necrosis [21],
although the number of patients treated by DEB-TACE was more limited compared to the number of patients who underwent Lipiodol-TACE.
The estimation of tumor necrosis and the recognition of residual viable enhancing tumor can be troublesome, particularly after Lipiodol-TACE. Previous studies [22] have demonstrated the relatively low accuracy of CT in recognizing residual viable tumor after Lipiodol-TACE, due to the artifacts created by the dense accumulation of
Lipiodol. In a series of 20 patients, Kloeckner et al. showed that, compared to Magnetic Resonance (MR), CT overestimated the extension of necrosis in 4/13 (30.8%) patients after Lipiodol-TACE, whereas the results were comparable after DEB-TACE [23]. Thus, MR has been proposed as a more accurate way to evaluate tumor response after TACE, with the potential added value of functional imaging and image post-processing [24-26]. On the other hand, MR has some drawbacks: costs, availability, duration and complexity of the examination, patient’s compliance and possible contraindications. Because of these drawbacks, in our department CT is used as first-line imaging modality after HCC treatment, performing MR in case of unconfident findings. Our results, based on over 300 nodules, confirm that CT may overestimate tumor necrosis, with a relatively low specificity (62%), yet a high sensitivity (over 87%) and an acceptable overall accuracy (75%). In a previous study carried out by Riaz et al. on 35 lesions treated by Lipiodol-TACE, specificity raised up to 82% when using MR for follow-up [17]. Of interest, we could not find any significant difference in CT accuracy when comparing Lipiodol-TACE to DEB-TACE, although disparity in numbers has to be taken into consideration.
CT accuracy in detecting tumor necrosis seems not to be influenced by some possible variables, such as tumor extension, interval between CT and LT and, most of all, CT
equipment. The latter result needs further interpretation. In fact, the improvement in CT technology over the last decades should have played a role in improving CT accuracy. However, this is not the case, probably because the operators’ training and specific experience play a more important role than the adopted technology. Indeed, intra-observer variability was a little lower for Observer 2 (12 years of experience) compared to Observer 1 (6 years of experience). Nonetheless, mRECIST criteria are reproducible, with good intra- and inter-observer agreements.
On a per-patient basis, the agreement between CT and pathology was acceptable (almost 70% of patients). We observed cases of both overestimation and
underestimation of tumor response. The underestimation was mostly due to the presence of inhomogeneous Lipiodol uptake and apparent arterial enhancement; in fact, all the areas of inhomogeneous Lipiodol accumulation were regarded as possible areas of residual viable tumor [27]. To reduce response underestimation, viable tumor should be defined on the basis of arterial enhancement (wash-in) associated to wash-out in the portal or delayed phase, as for the pre-procedural diagnostic work-up for HCC. In fact, in our experience, arterial enhancement alone can be caused by several conditions other than HCC, for instance arterio-portal shunts, leading to false positive results.
Overestimation of tumor response was mainly due to minimal residual tumor cells within the treated nodules. In fact, almost 30% of the nodules that were classified as CR showed 90-99% necrosis at pathology. Whether MR could detect this minimal residual viable tumor has to be demonstrated. Accordingly, further studies are required to evaluate the clinical impact of 90-99% necrosis, in terms of post-LT survival and tumor recurrence, as well as in terms of need for further treatments in non-surgical patients.
Previous studies have demonstrated that response to loco-regional therapies may be a strong prognostic indicator in surgical and non-surgical patients [28-30]. In a series of patients unfit for LT, Riaz A et al. showed that survival is significantly higher after partial or complete response compared to progressive disease or stable disease,
following either TACE or radioembolization [30]. Thus, the accuracy of a radiological method should be focused on its ability in differentiating between responders and non-responders. In this setting, CT accuracy in our series was 90%, with high sensitivity and specificity. Specificity and NPV further increased when excluding those patients who were classified as PD for the presence of new untreated lesions (n=9). All of these patients had over 50% necrosis at pathology, since the treated nodules were completely or almost completely necrotic, associated with smaller new untreated and non-necrotic lesions.
Our study has some limitations. We included patients treated over a wide period of time, with modifications in the technical approach as well as in the imaging procedures. In fact, different CT equipments and protocols were used over the years, although this seems not to have affected our results. The comparison between CT and pathology is retrospective; we could not precisely quantify percentage of necrosis in each nodule and we classified patients in a less accurate way.
Despite these limitations, our results, drawn from a relatively large population, show that mRECIST criteria after TACE are reproducible and reliable, even by CT. MR can be reserved to patients with unconfident or inconclusive CT findings, thus reducing the costs of follow up. Operators’ training is demanding to accurately assess tumor response and reduce the rate of CT overestimation. Despite this overestimation, CT accurately
discriminates between responders and non-responders, which plays a major role in defining patients’ prognosis and clinical management.
Table 1 – Acquisition protocol according to CT equipment Scan delay CT Years n. of patients Slice thickness Spacing
Arterial Venous Delayed
Single slice 1996- 2000 47 (26.4%)
7 mm 5 mm 30 sec 80 sec 180 sec
4-slice MDCT 2001- 2007 80 (44.9%)
5 mm 2.5 mm 30 sec 75 sec 170 sec
64-slice MDCT 2008-2010 51 (28.7%) 2.5 mm 2.5 mm B.T + 12 sec Arterial + 25 sec Venous + 100 sec Legend:
MDCT: multidetector Computer tomography B.T: bolus tracking
Single slice CT: Hi Speed (GE Medical Systems; Milwaukee, WI) 4-slice MDCT: Light Speed Plus (GE Medical Systems)
64-slice MDCT: Light Speed VCT 64 (GE Medical Systems)
Table 2 – Percentage of tumor necrosis at pathology % necrosis at pathology Variables 100 90-99 50-90 <50 0 P n. patients (%) 60 (33.7) 38 (21.4) 45 (25.3) 20 (11.2) 15 (8.4) Age (years) 54.8± 7 56.2± 6.8 56.5 ±5.5 56.5± 5.5 55.4± 5.9 .66 M/F (n) 46/14 34/4 41/4 19/1 15/0 .04 n. nodules 1.5 ±0.8 2.0±0.9 2.4±1.6 3.0±2.0 1.7±0.7 <.0001 RECIST diameter (mm) 36.2 ±21.3 49.0 ±26.6 54.9±31.5 60.9 ±28 35.2± 15.2 .0002 Largest nodule diameter (mm) 29.2±15.3 34.4±17.7 31.9± 13.2 30.4± 11.7 26.1 ±13.8 .33 Lipiodol-TACE / DEB-TACE 53/7 33/5 39/6 18/2 13/2 .99 TACE-LT (days) 195± 119 168± 106 152± 93 132 ±166 155 ±150 .22
Table 3 – CT-pathology correlation: nodule-by-nodule analysis. % necrosis at pathology CT (mRECIST) n. nodules 100 90-99 50-90 <50 0 CR 157 98 (62.4%) 45 (28.7%) 8 (5.1%) 3 (1.9%) 3 (1.9%) PR 73 13 (17.8%) 20 (27.4%) 24 (32.9%) 5 (6.8%) 11 (15.1%) SD 72 1 (1.4%) 0 2 (2.8%) 11 (15.2%) 58 (80.6%)
Table 4 – CT-pathology correlation: patient-by-patient analysis
The overall agreement was 69.9% (119/178 patients, k=0.44).
% necrosis at pathology CT (mRECIST) n. patients 100 90-99 50-90 <50 0 CR 86 51 (59.3%) 26 (30.2%) 7 (8.2%) 2 (2.3%) 0 PR 52 9 (17.3%) 11 (21.1%) 28 (53.9%) 4 (7.7%) 0 SD 23 0 0 2 (8.7%) 9 (39.1%) 12 (52.2%) PD 17 0 0 9 (52.9%) 5 (29.4%) 3 (17.7%)
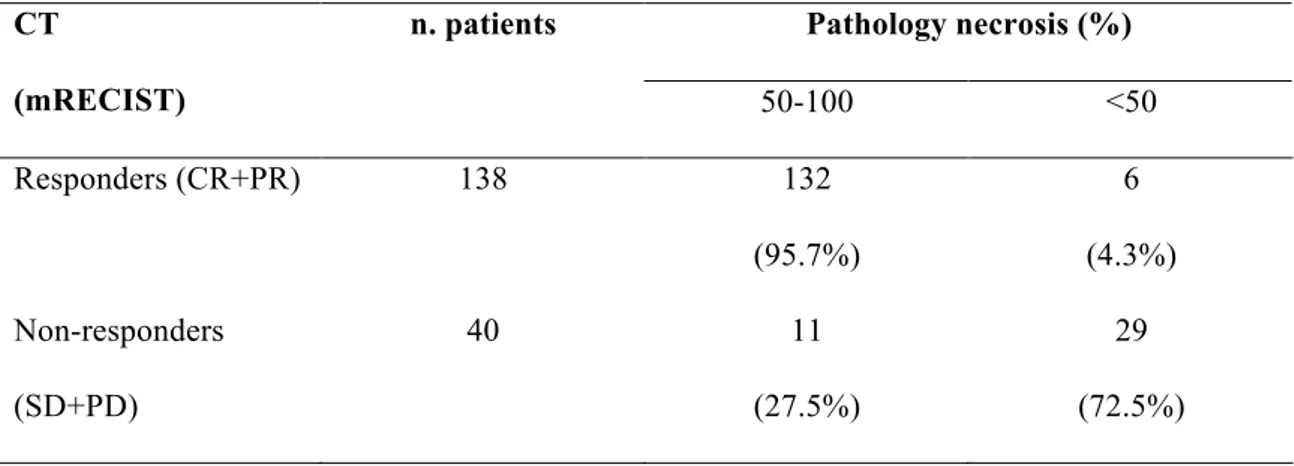
Table 5 – CT-pathology correlation: responders versus non-responders Pathology necrosis (%) CT (mRECIST) n. patients 50-100 <50 Responders (CR+PR) 138 132 (95.7%) 6 (4.3%) Non-responders (SD+PD) 40 11 (27.5%) 29 (72.5%)
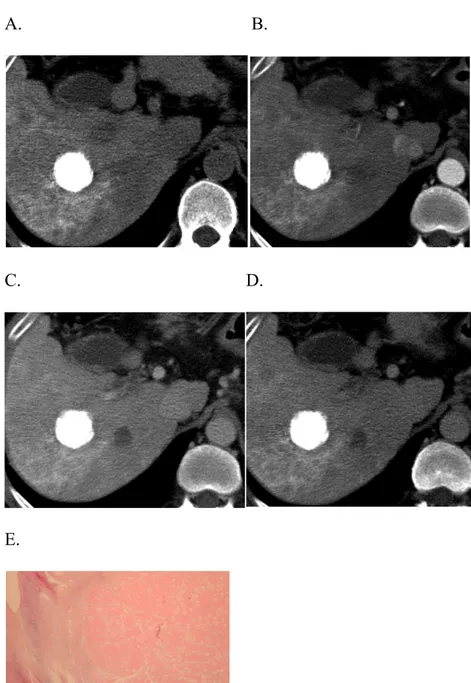
Fig. 1: complete response after Lipiodol-TACE
CT examination performed one month after Lipiodol-TACE in a cirrhotic patient with a single HCC nodule in the right liver lobe demonstrates the dense and homogeneous accumulation of Lipiodol in the nodule (A), with no evidence of arterial enhancement (B) or wash-out in the portal (C) and delayed (D) phases. The finding was interpreted as complete response according to mRECIST. Patient was transplanted two months after TACE. At pathology, 100% necrosis was found (E).
A. B.
C. D.
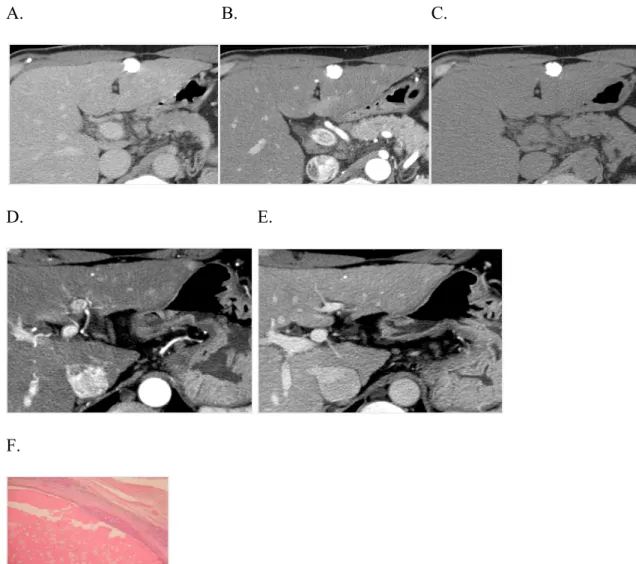
Fig. 2: progressive disease after Lipiodol-TACE
CT examination performed six months after Lipiodol-TACE of a single nodule in the left liver lobe demonstrates dense and homogeneous accumulation of Lipiodol in the nodule (A), with no evidence of arterial enhancement (B) or wash-out in the delayed (C) phases. The finding was interpreted as complete response according to mRECIST. However, a new 1 cm lesion was found in segment 2 with typical enhancement pattern for HCC (wash-in the arterial phase, D, wash-out in the portal phase, E). At pathology, minimal residual viable tumor (90-99% necrosis) was present peripherally to the treated nodule (F) and the new 1 cm lesion was classified as HCC. Thus progressive disease, according to mRECIST, was associated to an estimated 50-90% necr osis at pathology. A. B. C.
D. E.
References
[1] Nordenstedt H, White DL, El-Serag HB. The changing pattern of epidemiology in hepatocellular carcinoma. Dig Liver Dis 2010; 42(Suppl 3): S206-214.
[2] Forner A, Reig ME, de Lope CR, Bruix J. Current strategy for staging and treatment: the BCLC update and future prospects. Semin Liver Dis 2010; 30: 61-74. [3] Mazzaferro V, Regalia E, Doci R, Andreola S, Pulvirenti A, Bozzetti F, et al. Liver transplantation for the treatment of small hepatocellular carcinomas in patients with cirrhosis. N Engl J Med 1996; 334: 693-699.
[4] Lo CM, Ngan H, Tso WK, Liu CL, Lam CM, Poon RT, et al. Randomized Controlled Trial of Transarterial Lipiodol Chemoembolization for Unresectable Hepatocellular Carcinoma. Hepatology 2002; 35: 1164-1171.
[5] Llovet JM, Real MI, Montaña X, Planas R, Coll S, Aponte J, et al; Barcelona Liver Cancer Group. Arterial embolisation or chemoembolisation versus symptomatic treatment in patients with unresectable hepatocellular carcinoma: a randomised controlled trial. Lancet 2002; 359: 1734-1739.
[6] Lewandowski RJ, Kulik LM, Riaz A, Senthilnathan S, Mulcahy MF, Ryu RK, et al. A comparative analysis of transarterial downstaging for hepatocellular carcinoma: chemoembolization versus radioembolization. Am J Transplant 2009; 9(8): 1920-1928. [7] Graziadei IW, Sandmueller H, Waldenberger P, Koenigsrainer A, Nachbaur K, Jaschke W, et al. Chemoembolization followed by liver transplantation for
hepatocellular carcinoma impedes tumor progression while on the waiting list and leads to excellent outcome. Liver Transpl 2003; 9(6): 557-563.
[8] Yao FY, Kerlan RK Jr, Hirose R, Davern TJ 3rd, Bass NM, Feng S, et al. Excellent outcome following down-staging of hepatocellular carcinoma prior to liver
transplantation: an intention-to-treat analysis. Hepatology 2008; 48(3): 819-827. [9] World Health Organization. WHO Handbook for Reporting Results of Cancer Treatment. Offset Publication 48. Geneva Switzerland: World Health Organization; 1979.
[10] Bruix J, Sherman M, Llovet JM, Beaugrand M, Lencioni R, Burroughs AK, et al; EASL Panel of Experts on HCC. Clinical management of hepatocellular carcinoma. Conclusions of the Barcelona-2000 EASL conference. European Association for the Study of the Liver. J Hepatol 2001; 35: 421-430.
[11] Therasse P, Arbuck SG, Eisenhauer EA, Wanders J, Kaplan RS, Rubinstein L, et al. New guidelines to evaluate the response to treatment in solid tumors. European Organization for Research and Treatment of Cancer, National Cancer Institute of the United States, National Cancer Institute of Canada. J Natl Cancer Inst 2000; 92: 205-216.
[12] Eisenhauer EA, Therasse P, Bogaerts J, Schwartz LH, Sargent D, Ford R, et al. New response evaluation criteria in solid tumours: Revised RECIST guideline (version 1.1). Eur J Cancer 2009; 45: 228-247.
[13] Forner A, Ayuso C, Varela M, Rimola J, Hessheimer AJ, de Lope CR, et al. Evaluation of tumor response after locoregional therapies in hepatocellular carcinoma: are response evaluation criteria in solid tumors reliable? Cancer 2009; 115: 616-623. [14] Llovet JM, Di Bisceglie AM, Bruix J, Kramer BS, Lencioni R, Zhu AX, et al; Panel of Experts in HCC-Design Clinical Trials. Design and end-points of clinical trials in hepatocellular carcinoma. J Natl Cancer Inst 2008; 100: 698-711.
[15] Lencioni R, Llovet JM. Modified RECIST (mRECIST) assessment for hepatocellular carcinoma. Semin Liver Dis 2010; 30: 52-60.
[16] Kim SH, Lee WJ, Lim HK, Lim JH. Prediction of viable tumor in hepatocellular carcinoma treated with transcatheter arterial chemoembolization: usefulness of attenuation value measurement at quadruple-phase helical computed tomography. J Comput Assist Tomogr 2007; 31: 198-203.
[17] Riaz A, Lewandowski RJ, Kulik L, Ryu RK, Mulcahy MF, Baker T, et al. Radiologic-pathologic correlation of hepatocellular carcinoma treated with chemoembolization. Cardiovasc Intervent Radiol 2010; 33(6): 1143-1152.
[18] Riaz A, Kulik L, Lewandowski RJ, Ryu RK, Giakoumis Spear G, Mulcahy MF, et al. Radiologic-pathologic correlation of hepatocellular carcinoma treated with internal radiation using yttrium-90 microspheres. Hepatology 2009; 49(4): 1185-1193.
[19] Riaz A, Memon K, Miller FH, Nikolaidis P, Kulik LM, Lewandowski RJ, et al. Role of the EASL, RECIST, and WHO response guidelines alone or in combination for hepatocellular carcinoma: Radiologic-pathologic correlation. J Hepatol 2011; 54: 695-704.
[20] Golfieri R, Cappelli A, Cucchetti A, Piscaglia F, Carpenzano M, Peri E et al. Efficacy of selective transarterial chemoembolization in obtaining tumor necrosis in small (<5 cm) hepatocellular carcinomas. Hepatology 2011; 53(5): 1580-1589. [21] Lammer J, Malagari K, Vogl T, Pilleul F, Denys A, Watkinson A, et al;
PRECISION V Investigators. Prospective Randomized Study of Doxorubicin-Eluting-Bead Embolization in the Treatment of Hepatocellular Carcinoma: Results of the PRECISION V Study. Cardiovasc Intervent Radiol 2010; 33: 41-52.
[22] Kim YS, Rhim H, Lim HK, Park CK, Lee WJ, Do YS, et al. Completeness of treatment in hepatocellular carcinomas treated with image-guided tumour therapies: Evaluation of positive predictive value of contrast-enhanced CT with histopathologic
correlation in the explanted liver specimen. J Comput Assist Tomogr 2006; 30: 578-582.
[23] Kloeckner R, Otto G, Biesterfeld S, Oberholzer K, Dueber C, Pitton MB. MDCT versus MRI assessment of tumor response after transarterial chemoembolization for the treatment of hepatocellular carcinoma. Cardiovasc Intervent Radiol 2010; 33(3): 532-540.
[24] Kim S, Mannelli L, Hajdu CH, Babb JS, Clark TW, Hecht EM, et al.
Hepatocellular carcinoma: assessment of response to transarterial chemoembolization with image subtraction. J Magn Reson Imaging 2010; 31(2): 348-355.
[25] Kamel IR, Bluemke DA, Eng J, Liapi E, Messersmith W, Reyes DK, et al. The role of functional MR imaging in the assessment of tumor response after chemoembolization in patients with hepatocellular carcinoma. J Vasc Interv Radiol 2006; 17: 505-512. [26] Mannelli L, Kim S, Hajdu CH, Babb JS, Clark TW, Taouli B. Assessment of tumor necrosis of hepatocellular carcinoma after chemoembolization: diffusion-weighted and contrast-enhanced MRI with histopathologic correlation of the explanted liver. AJR Am J Roentgenol 2009; 193: 1044-1052.
[27] Herber S, Biesterfeld S, Franz U, Schneider J, Thies J, Schuchmann M, et al. Correlation of multislice CT and histomorphology in HCC following TACE: predictors of outcome. Cardiovasc Intervent Radiol 2008; 31(4): 768-777.
[28] Otto G, Herber S, Heise M, Lohse AW, Mönch C, Bittinger F, et al. Response to transarterial chemoembolization as a biological selection criterion for liver
transplantation in hepatocellular carcinoma. Liver Transpl 2006; 12: 1260-1267. [29] Bargellini I, Vignali C, Cioni R, Petruzzi P, Cicorelli A, Campani D, et al.
in patients exceeding Milan criteria--selection parameter for liver transplantation. Radiology 2010; 255: 289-300.
[30] Riaz A, Miller FH, Kulik LM, Nikolaidis P, Yaghmai V, Lewandowski RJ, et al. Imaging response in the primary index lesion and clinical outcomes following
transarterial locoregional therapy for hepatocellular carcinoma. JAMA 2010; 303(11): 1062-1069.