AGRARIA Department Doctoral course in
APPLIED BIOLOGY TO AGRICULTURAL, FOOD AND FORESTRY SYSTEMS
Curriculum
Suistainable management of systems agricultural and forestry in the Mediterranean environment
SSD-AGR13 Agricultural Chemistry -XXVII Ph.D cycle -
R
R
OOOOTTP
P
LLAASSTTIICCIITTYYI
I
NNT
T
WWOOC
C
OONNTTRRAASSTTIINNGGB
B
OORROONNT
T
OOLLEERRAANNTTT
T
OOMMAATTOOG
G
EENNOOTTYYPPEESSU
U
NNDDEERRB
B
OORROONNEEXXCCEESSSS DOCTORAL DISSERTATIONby
M
ARIAP
OLSIAP
RINCI Submitted for the Degree ofDOCTOR OF PHILOSOPHY
Supervisor
Prof.ssa Maria Rosa Abenavoli
Coordinator of Doctoral Course Prof.ssa Maria Rosa Abenavoli
Co-Supervisor
Prof. Francesco Sunseri
Università degli Studi
Mediterranea di Reggio Calabria
Regione Calabria Assessorato Cultura, Istruzione
e Ricerca Dipartimento 11 Repubblica
Italiana European Comminsion
“Although nature commences with reason and ends in
experience it is necessary for us to do the opposite that is to
commence with experience and from this to proceed to
investigate the reason.”
Leonardo da Vinci
(15th April 1452 – 2nd May 1519)
A Pietro, mio marito…
Per l’incoscienza, l’allegria, la testardaggine e l’Amore
CONTENTS
SINTESI ... I LIST OF FIGURES ... VIII LIST OF TABLES ... XI CHAPTER 1
General Background: ecophysiology of Boron and plant
nutrition
... 11.1 Boron Chemistry ... 1
1.2 Boron source and distribution ... 2
1.3 Boron in soil ... 5
1.4 Boron in plants ... 8
1.4.1 Boron in the cell wall and membranes ... 9
1.4.2 Boron and plasma membrane H+-ATPase interaction ... 11
1.4.3 Boron as signal ... 12
1.4.4 Boron uptake by roots: passive and active mechanisms ... 14
1.4.4.1 Facilitated B transport system: the role of aquaporin-like channels ... 17
1.4.4.2 Boron transporters ... 18
1.4.4.3 Boron movement in plants... 20
1.5 Boron toxicity in plants: causes and consequences ... 22
1.5.1 Simptoms of Boron Toxicity ... 22
1.5.2 Effects of Boron excess in plants ... 23
1.5.2.1 Boron and root system ... 24
1.5.2.2 Boron and photosynthesis process... 24
1.5.2.3 Boron and antioxidant pathways ... 25
1.5.2.4 Boron and carbohydrate metabolism ... 26
1.6 Boron tolerance ... 27
1.6.1 Early considerations ... 27
1.6.2 Tolerance mechanisms revisited ... 27
1.6.3 Tolerance mechanisms revisited ... 29
1.6.4 Quantitative trait loci (QTL) and isolating genes involved in B tolerance 31 1.7 Boron and Nitrogen metabolism: a focus on nitrate ... 32
1.7.1 Nitrate: signal and nutrient ... 32
1.7.2 Nitrate uptake, assimilation and remobilization ... 35
1.8 Tomato crop ... 40
1.8.1 Boron and nitrogen metabolism ... 41
1.8.2 Boron role on tomato growth, yield and nutrient contents ... 43
1.8.3 Boron toxic effects on tomato plants ... 44
AIMS AND OBJECTIVES OF RESEARCH ...46
CHAPTER 2 Boron excess on two tomato hybrids: Long- and Short term effects on root form and function ... 48
2.1 Materials and methods ... 48
2.1.1 Plant material and growth condition ... 48
2.1.2 Long and short term boron experiments ... 48
2.1.3 Morphological analysis ... 48
2.1.4 Chlorophyll content ... 49
2.1.5 Boron content ... 49
2.1.6 Net NO3- uptake assay ... 49
2.1.7 H+-ATPase assay... 50
2.1.7.1 Isolation of plasma membrane vesicles ... 50
2.1.7.2 pmH+-ATPase activity ... 50
2.1.7.3 Protein assay ... 51
2.1.8 Membrane potential measurements ... 51
2.1.9 Gene expression analysis ... 52
2.1.9.1 RNA extraction ... 52
2.1.9.2 Reverse Transcript-PCR ... 52
2.1.9.3 Quantitative RT-PCR ... 53
2.1.10Statistical analysis ... 54
2.2 Results ... 55
2.2.1 Long- and short term boron toxic treatments ... 55
2.2.2 Boron Content ... 57
2.2.3 Net nitrate uptake ... 58
2.2.4 pmH+-ATPase activity ... 60
2.2.5 Membrane potential measurements ... 61
2.2.6 Gene expression analysis ... 62
CHAPTER 3
Short-term antioxidant responses of two tomato root
systems with different sensitivity to B toxicity
... 733.1 Materials and Methods ... 73
3.1.1 Plant material and growth condition ... 73
3.1.2 Determination of malondialdehyde ... 73
3.1.3 Determination of hydrogen peroxide ... 73
3.1.4 Antioxidant enzyme assays ... 74
3.1.4.1 Enzymes extraction ... 74
3.1.4.2 Peroxidase activity ... 74
3.1.4.3 Superoxide dismutase activity ... 75
3.1.4.4 Protein assay ... 75
3.1.5 Statistical analyses ... 76
3.2 Results and discussions ... 76
CHAPTER 4
Tomato response to boronexcess: the role of graftingand
root morphology
... 864.1 Materials and methods ... 86
4.1.1 Plant material and growth conditions ... 86
4.1.2 Boron treatments ... 87
4.1.3 Chlorophyll content, root and shoot growth analysis ... 87
4.1.4 Root morphological analysis ... 87
4.1.5 Statistical analysis ... 88
4.2 Results and discussion ... 88
GENERAL CONCLUSIONS AND REMARKS ... 105
ACKNOWLEDGEMENTS ... 109
SINTESI
Il boro (B) è un micro-elemento essenziale per la crescita delle piante, e l'importanza della sua applicazione in sistemi colturali intensivi è ben riconosciuta. Esso è infatti fondamentale nella costituzione della parete cellulare delle piante e quindi nei processi di formazione ed allungamento delle radici e dei germogli, nonché di distensione delle foglie. Appare altresì ormai certa la sua funzione nel garantire l’integrità delle membrane cellulari.
Ciò nonostante, il B risulta tossico se presente a concentrazioni elevate in suoli ricchi di B o a causa di un’eccessiva concimazione e/o irrigazione con acqua ricca di
questo elemento. In alcune regioni del Mediterraneo, la contaminazione dei terreni e
delle acque irrigue da B (con concentrazioni circa 15 mg/L) rappresenta una seria minaccia per le colture e per la salute umana.
Il B viene assorbito dalle radici come acido borico e tende ad accumularsi nelle foglie mature, specialmente ai loro margini, in quanto è trasportato lungo il sistema di traspirazione e si accumula alla fine del flusso traspirazionale. Il tipico sintomo di tossicità da B è la necrosi marginale fogliare. Tuttavia, in altre specie (ad esempio mela, pesca e mandorla), il B può essere rimobilizzato attraverso il floema da zuccheri quali mannitolo e sorbitolo, in grado di legare l'acido borico.
La tolleranza della pianta alla tossicità da B è specie-specifica ed è generalmente associata alla capacità di limitare il suo assorbimento e/o trasporto attraverso meccanismi di esclusione e/o di efflusso attivo dalle radici. In Arabidopsis, la tolleranza al B è associata alla presenza di canali BOR, che sono responsabili della sua estrusione dal citoplasma. Due famiglie geniche sembrano regolare l’assorbimento ed il trasporto del B nelle piante: i) BOR1, un trasportatore efflux-type coinvolto nel caricamento del B nello xilema; e ii) NIP, le proteine intrinseche nodulin-like, canali candidati per il trasporto di membrana. Recenti lavori hanno dimostrato che entrambi questi canali, BOR 1 e NIP, hanno un ruolo fondamentale in condizione di carenza di B nelle piante mentre BOR4, un trasportatore B efflux dalle radici al terreno, è considerato il maggiore responsabile nel conferire tolleranza al B.
Sebbene i tipici sintomi della tossicità da B si manifestano a carico delle foglie, anche la radice appare un bersaglio altamente sensibile all’eccesso di B in quanto la sua crescita risulta notevolmente ridotta. E’ stata inoltre recentemente evidenziata l’importanza della morfologia radicale nel conferire tolleranza al B in diverse specie quali frumento, orzo, riso e pomodoro, sottolineando il ruolo chiave della radice in risposta alla tossicità da B.
In tale ottica, il lavoro di tesi di dottorato ha posto particolare attenzione all’apparato radicale, nella sua forma e funzione, focalizzando l’attenzione sulle risposte morfo-fisiologiche e molecolari ad elevate concentrazioni di B in pomodoro. Il pomodoro è una delle specie ortive più importanti nel bacino del Mediterraneo sia per superficie coltivata sia per produttività.
L’attività di ricerca si è prefissata 3 obiettivi fondamentali:
1) Effetti morfologici, fisiologici e molecolari di lunghe e brevi esposizioni ad elevate concentrazioni di B sulla forma e funzione dell’apparato radicale di due genotipi di pomodoro con diversa sensibilità ad eccesso di B;
2) Risposte antiossidanti a brevi esposizioni ad eccesso di B in due genotipi di pomodoro con diversa sensibilità ad eccesso di B;
3) Risposte all’eccesso di B in pomordoro: il ruolo dell’innesto e della morfologia radicale.
Il primo obiettivo è stato quindi quello di studiare le risposte morfo-fisiologiche e molecolari di due ibridi di pomodoro, Ikram e Losna, caratterizzati da diversa sensibilità all’eccesso di B, dopo lunga e breve esposizione ad elevate concentrazioni di questo elemento. In particolare, è stato realizzato uno studio integrato delle risposte di forma e funzione della radice valutando altresì le interazioni di questo stress con il nitrato, nutriente essenziale per la crescita e lo sviluppo delle piante.
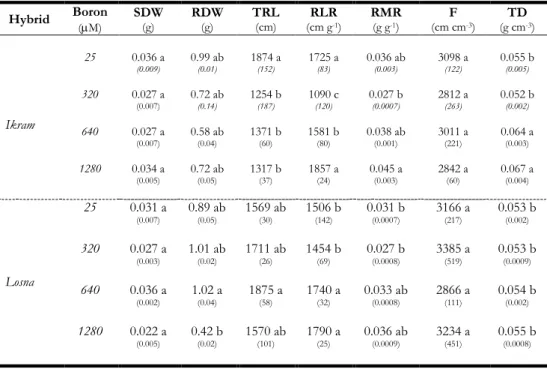
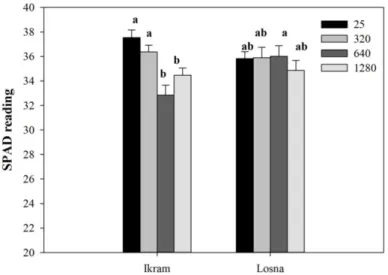
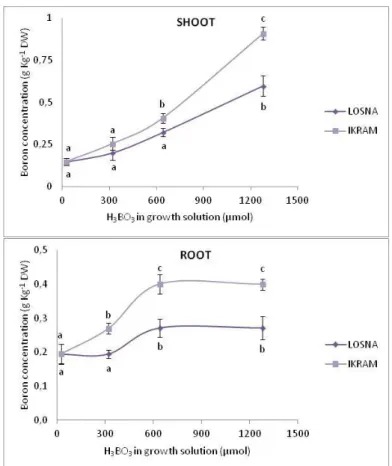
È stato inizialmente condotto uno screening fenotipico per la tolleranza al B esponendo i due genotipi ad elevate concentrazioni di B per 7 giorni (trattamento a lungo-termine). Sul materiale vegetale è stata valutata l’espressione dei sintomi di tossicità a livello fogliare ed il contenuto di clorofilla. E’ stata inoltre analizzata la morfologia radicale ed infine è stato determinato il contenuto in B nei tessuti radicali e fogliari. I risultati hanno permesso di evidenziare una maggiore tolleranza di Losna all’eccesso di B, rispetto ad Ikram. In particolare, Ikram mostrava evidenti sintomi di tossicità fogliare, confermati da un ridotto contenuto in clorofilla e maggiore concentrazione interna di B rispetto a Losna, in entrambe gli organi fogliare e radicale. Ancora più interessanti sono stati i risultati sulla morfologia radicale, che hanno confermato una maggiore capacità di adattamento di Losna rispetto ad Ikram all’eccesso di B. Infatti, Losna, oltre a mantenere inalterata la lunghezza radicale in presenza di alte concentrazioni di B, mostrava un aumento del rapporto di lunghezza radicale (RLR), importante indice di potenzialità della radice per l’acquisizione delle risorse. È stata inoltre effettuata l’analisi delle componenti di ‘allocazione’ e ‘strutturali’ dell’RLR quali il rapporto di massa radicale (RMR), la finezza e la densità di tessuto. I risultati hanno evidenziato che Losna è in grado di investire sull’apparato
radicale mantenendo elevata la sua crescita anche in presenza di elevate concentrazioni di B mentre Ikram mostrava una maggiore densità di tessuto, componente strutturale strettamente correlata al processo di lignificazione della radice.
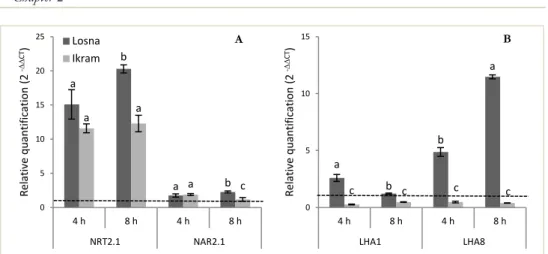
Successivamente, è stato valutato se il diverso comportamento osservato nei due genotipi dopo lunga esposizione all’eccesso di B (0, 320 e 640 µM) fosse confermato anche dopo brevi esposizioni (48 h). Inoltre, poiché è noto che cambiamenti nella forma (morfologia radicale) sono generalmente accompagnati da cambiamenti funzionali della radice (assorbimento dei nutrienti) sono stai studiati gli effetti fisiologici e molecolari dell’eccesso di B sull’assorbimento del nitrato. I risultati hanno evidenziato che tutti i trattamenti con B inibivano significativamente l’assorbimento del nitrato in Ikram, mentre in Losna tale inibizione si osservava solo alla concentrazione più elevata. Simile pattern mostrava anche l’attività della pompa H+-ATPasica, enzima strettamente funzionale alle attività di assorbimento del
nitrato, in entrambe i genotipi. L’analisi dei geni relativi all’assorbimento del nitrato (NTR2.1, NAR2.1) ed alla pompa protonica (LHA1, LHA8) erano in linea con i dati biochimici e fisiologici ottenuti, evidenziando una maggiore inibizione di espressione in Ikram rispetto a Losna.
Successivamente, sono state effettuate nei due genotipi analisi di espressione dei geni in grado di conferire tolleranza a tale stress, dopo breve esposizione all’eccesso B. Questo avrebbe permesso di capire quanto precoce fosse l’espressione della tolleranza in Losna e quali geni ne fossero responsabili. E’ noto infatti che la tolleranza delle piante alla tossicità del B è essenzialmente legata alla loro capacità di ridurre l’assorbimento radicale del B grazie a meccanismi di esclusione e di efflusso attivo dalle cellule radicali. In tale ottica, sono state valutate le espressioni dei geni codificanti per i trasportatori trans-membrana dell’acido borico nelle piante (BOR4, BOR1, NIP5;1).
I risultati ottenuti hanno evidenziato una maggiore espressione del gene BOR4, responsabile dell’efflusso del B da parte delle cellule radicali nel mezzo esterno in Losna rispetto a Ikram. Al contrario, i geni BOR1 e NIP5;1 mostrano un espressione ridotta in entrambi i genotipi, confermando il loro ruolo fondamentale in condizione di carenza da boro ma non di eccesso.
Questi risultati suggeriscono che uno dei possibili meccanismi in grado di conferire tolleranza al B in Losna implica un efflusso dell’anione borato da parte delle cellule radicali. Questo potrebbe supportare i dati di minore contenuto di B riscontrati in Losna rispetto ad Ikram. Recentemente, è stato postulato che l’efflusso attivo di B attraverso i trasportatori BOR-type necessita di un input di energia che guida il gradiente concentrazione attraverso la membrane. Poiché lo ione che guida i
sistemi di co-trasporto attraverso la membrana plasmatica è solitamente lo ione H+,
semplici esperimenti elettrofisiologici in presenza di stimolatori o inibitori della pompa H+-ATPasi sono stati eseguiti in radici di entrambe i genotipi per meglio
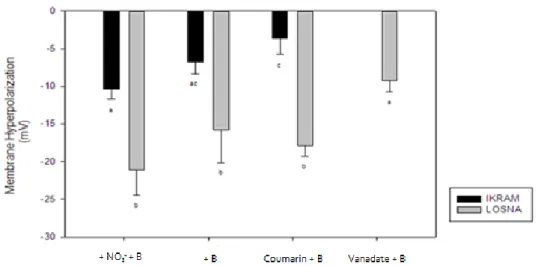
comprendere il meccanismo di tolleranza. I risultati hanno fortemente suggerito il coinvolgimento di un efflusso elettrogenico di protoni che avviene dopo trattamento con lo ione borato. In particolare, Losna mostrava una maggiore iperpolarizzazione di membrana (potenziale di membrana più negativo) rispetto ad Ikram in risposta ad alte concentrazioni di B. Tale effetto era evidente anche quando le radici di pomodoro erano esposte contemporaneamente a B e nitrato o cumarina, sostanze in grado di determinare un’iperpolarizzazione della membrana plasmatica. Questi dati suggerivano che la tolleranza al B in pomodoro era dovuta ad un efflusso borato guidato da efflusso di protoni. Tuttavia, per comprendere se questo efflusso di ioni H+ fosse H+-ATPasi dipendente, è stato utilizzato il vanadato, un forte inibitore
dell’attività della pompa H+-ATPAsi dipendente. I risultati hanno evidenziato che in
Losna la tolleranza all’eccesso di B è dovuta ad un efflusso di B accompagnato da un contemporaneo efflusso di ioni H+, non solo imputabile ad una maggiore attività
dell’enzima pmH+-ATPasi ma probabilmente ad una funzione di sistemi H+-ATPasi
indipendenti o sistemi redox a livello di membrana.
Il secondo obiettivo ha rappresentato un primo approccio per esplorare gli effetti che interessano lo stato antiossidante della radice dei due genotipi di pomodoro, dopo brevi esposizioni a livelli tossici di tale elemento (0, 320 e 640 µM). In particolare, è stato valutato se l’accumulo di perossido d’idrogeno (H2O2) nei
tessuti radicali, evento solitamente riscontrato come risposta all’eccesso di B in diverse specie vegetali, potesse essere associato con i livelli di malondialdeide (MDA), uno dei prodotti di accumulo di perossidazione lipidica delle membrane cellulari, e con l’induzione di meccanismi di scavenger mediati da enzimi antiossidanti quali l’enzima superossido dismutasi (SOD). Infine, è stata valutato l'attività dell’enzima perossidasi (POD) quale possibile responsabile del processo di lignificazione a livello radicale in risposta all’eccesso di B. I risultati ottenuti confermano che l’eccesso di B viene prontamente percepito a livello radicale, dove è in grado di causare un repentino e improvviso incremento dei livelli di H2O2 e un
concomitante aumento dei prodotti di degradazione della membrana (MDA) nei tessuti radicali. Tale comportamento interesserebbe maggiormente l’ibrido Ikram, nel quale, infatti, a partire dall’ottava ora di esposizione a 320 µM B si riscontra un brusco e progressivo aumento dei livelli di H2O2 e MDA, mentre solo la
concentrazione massima di B (640 µM) è in grado di provocare l'accumulo di tali prodotti nelle radici dell’ibrido Losna. I risultati ottenuti sembrerebbero confermare e giustificare in parte la diversa sensibilità dei due ibridi all’eccesso di B, come
riportato nel primo lavoro della presente tesi. Tenendo comunque presente la duplice natura di alcune specie reattive dell’ossigeno (ROS) e dei prodotti della perossidazione lipidica, resta da comprendere se il loro accumulo all’interno di radici esposte per breve tempo ad eccesso di B possa essere considerato semplicemente un inizio dello sviluppo di un danno ossidativo, e/o avere la funzione di allertare i sistemi di difesa antiossidante. A tal proposito, poiché l’attività svolta dalla SOD costituisce il primo sistema di difesa antiossidante contro i danni causati dai radicali derivanti dall’ossigeno, è stato eseguito un saggio di attività di tale enzima in radici di entrambe i genotipi. I risultati hanno mostrato il coinvolgimento di questo enzima in risposta a concentrazioni tossiche di B. In particolare, l’ibrido Ikram, oltre a manifestare un’attività insita maggiore della SOD rispetto a Losna, presenta anche un importante incremento di tale attività in presenza della più elevata concentrazione di B. Tuttavia, non è possibile stabilire un chiaro effetto dell’eccesso di B sull'attività della SOD nelle radici di entrambe i genotipi di pomodoro a causa della elevata variabilità riscontrata nel breve periodo considerato. È possibile comunque affermare che l’attività di tale enzima non rappresenti un fattore critico nel meccanismo di tolleranza alla tossicità da B. L’eccesso di B nel mezzo di crescita induce anche un sostanziale incremento dell'attività della POD, apparentemente corrispondente con l'accumulo del suo substrato ossidante, ovvero H2O2. Poiché tra i composti fenolici
derivanti dai processi di catalisi operati dalla POD sono compresi alcuni precursori delle molecole di lignina, è possibile supporre che l’attività di tale enzima si concentri principalmente nelle radici incidendo sul processo di lignificazione dei tessuti radicali in risposta a eccesso di B. Tuttavia, nonostante l'attività della POD fosse superiore di circa il 40% in Ikram rispetto a Losna dopo 48 ore di trattamento, non sussistono differenze statisticamente significative che consentono di ipotizzare un differente comportamento di tale enzima nei due genotipi di pomodoro. Quindi, come precedentemente riportato per la SOD, nessun coinvolgimento specifico può essere attribuito all’attività della POD nello sviluppo di tolleranza al B.
Il terzo obiettivo è stato quello di valutare gli effetti dell’innesto erbaceo sulla crescita e la morfologia radicale di piantine di pomodoro allevate in condizioni di eccesso di B. L’interesse per il pomodoro innestato nasce dal fatto che questa tecnica è sempre più utilizzata in Italia e in molti altri Paesi come strumento di difesa nei confronti di numerosi agenti patogeni presenti nel terreno e per aumentare la resistenza alla salinità. Tale studio mirava principalmente ad accertare la plasticità morfologica sia dell’intero apparato radicale sia intra-radicale nel determinare la maggiore tolleranza allo stress da eccesso di B delle piante innestate rispetto a quelle non innestate. In particolare, il lavoro è stato eseguito su tre tipologie di piante di pomodoro: Ungrafted (ibrido Ikram non innestato), Self-Grafted (ibrido Ikram
innestato su Ikram) e Grafted (ibrido Ikram innestato su Arnold – portainnesto resistente alla salinità). Tali piante sono state sottoposte a trattamenti con 0 - 5 - 10 - 15 mg/L di B, per 0, 7, 14, 21 giorni. Su tale materiale vegetale è stata inizialmente valutata la crescita del germoglio, attraverso la misura del peso secco, ed il contenuto di clorofilla delle foglie; infine, è stata condotta un approfondita analisi della morfologia radicale. I risultati hanno permesso di evidenziare una maggiore tolleranza delle piante grafted all’eccesso di B, rispetto alle self-grafted e ungrafted. In particolare, sia il peso secco del germoglio sia il contenuto in clorofilla delle foglie delle piante grafted esposte a dosi eccessive di B subivano una riduzione inferiore rispetto le piante self-grafted, le quali mostravano comunque una minore diminuzione di tali parametri rispetto le ungrafted. La riduzione del peso secco del germoglio, così come del contenuto in clorofilla delle foglie, iniziava a manifestarsi dal 14° giorno di trattamento ed interessava maggiormente lo stelo rispetto le foglie di tutte le tipologie di piante considerate. Inoltre, da un’analisi della distribuzione spaziale del contenuto in clorofilla lungo i palchi del germoglio, le piante grafted continuavano a mostrare una risposta migliore ai differenti trattamenti di B poiché subivano una riduzione di tale parametro solo a livello della prima foglia, ovvero la foglia più vecchia presente nella pianta, generalmente considerata il primo bersaglio in condizioni di eccesso di B. Contrariamente, nelle piante self-grafted e ungrafted un contenuto inferiore in clorofilla era registrato anche nella quarta e nella quinta foglia, ovvero nelle foglie più giovani, lasciando ipotizzare che in presenza di eccesso di B tale elemento continuava ad essere assorbito e trasportato lungo il flusso traspiratorio raggiungendo e accumulandosi nelle foglie più giovani dove provocava il danno. Anche l’analisi della morfologia radicale confermava che le piante grafted presentavano una migliore risposta alle elevate concentrazioni di B, mostrando un apparato radicale più lungo e sottile rispetto le self-grafted e ungrafted. Inoltre, la lunghezza radicale era ridotta sensibilmente dalle elevate concentrazioni di B, in maniera sensibile nelle piante self-grafted ma ancora di più in quelle ungrafted. Tale diminuzione di lunghezza radicale è causata soprattutto dalla ridotta biomassa allocata nell’apparato radicale ma non da effetti sui parametri strutturali della radice, finezza e densità di tessuto radicale. Ancora più interessanti sono stati i risultati ottenuti attraverso l’analisi intra-radicale, nel quale sono state prese in considerazione le variazioni (in termini di lunghezza) delle differenti classi di diametro presenti nella radice. I risultati ottenuti mostrano un influenza dell’eccesso di B e della tipologia d’innesto sulla composizione delle differenti classi di diametro radicale. In particolare, le piante grafted oltre a mostrare una maggiore lunghezza per la classe di diametro ‘very fine’ (0-0.5 mm) rispetto le self-grafted ed ungrafted, erano le uniche a non mostrare alcuna modifica di tale parametro al variare dei trattamenti di B utilizzati.
Diversamente la lunghezza radicale per le classi di diametro ‘fine’ e ‘large’ non era differente tra le tre tipologie di piante ma era modificata dalla presenza di boro, riducendosi sensibilmente. Quindi, è possibile sostenere che l’apparato radicale svolga un ruolo strategico nella tolleranza della pianta all’eccesso di B ed è possibile affermare che, almeno nel caso del pomodoro, l’uso di specifici portainnesti potrebbe costituire una strategia alternativa per superare le problematiche legate a tale stress.
LIST OF FIGURES
Figure 1. Boron targets ... 9
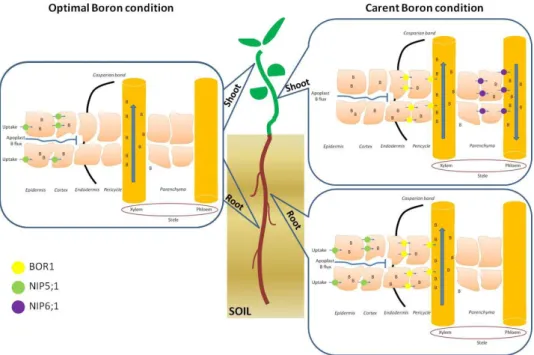
Figure 2. Model illustrating the different function of boron transporters in whole plant under optimal and deficient B conditions... 16
Figure 3. Gene expression by N supply. ... 34
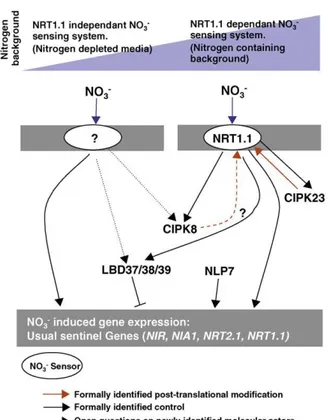
Figure 4. Model of the signaling molecules acting in nitrate supply ... 35
Figure 5. NRT transporters involved in nitrate uptake by roots ... 37
Figura 6. SPAD reading of two tomato genotypes exposed to 25, 320, 640 or 1280 µM B for 7 days. ... 56
Figure 7. Boron concentration in shoot and root of two tomato genotypes exposed to different boron concentrations for 7 days. ... 58
Figure 8. Time-course of net nitrate uptake rates (µmol NO3-hr-1 g-1 FW) in tomato hybrids (Ikram, A; Losna, B) exposed for 0, 4, 8, 24 and 48 hours to 200 µM nitrate and different boron concentrations... 59
Figure 9. H+-ATPase activity (nmol Pi µg-1 prot. hr-1) of plasma membrane vesicles isolated from root tomato hybrids (Ikram, A; Losna, B) exposed to 200 µM nitrate and different B concentrations for 0, 4, 8 and 24 hours.. ... 60
Figure 10. Membrane potential at steady-state in primary root cells of two tomato hybrids different treated. ... 61
Figure 11. Membrane hyperpolarization after 30 min of exposure to 200 µM nitrate and 320µM Boron (+NO3- +B), or 320 µM Boron (+B), or 320 µM Boron and 10µM Coumarin (Coumarin +B), or 320 µM Boron and 2mM Vanadate of two tomato genotypes ... 62
Figure 12. Gene expression pattern of nitrate transporter family NRT2.1, NAR2.1 and H+-ATPase isoforms LHA1, LHA8 in two tomato hybrids after 4 and 8 h of nitrate (200 µM) supply ... 64
Figure 13. Gene expression pattern of nitrate transporter family (NRT2.1, NAR2.1) and H+ATPase isoforms (LHA1, LHA8) in two tomato hybrids after 4 and 8 h of B (320, 640 µM) supply ... 64
Figure 14. Gene expression pattern of boron transporter family (BOR1, BOR4) and aquaporin B-channels (NIP5;1) in two tomato hybrids after 4 and 8 h of B (320, 640 µM) supply ... 66
Figure 15. Boron toxicity symptoms on leaves of tomato hybrids (Losna, Ikram) at 7 days of exposure to different boron levels (25; 320, 640 and 1280 µM). ... 67
Figure 16. Effect of 25M B (control) and B toxicity (320 and 640 M) after 0, 4, 8, 24 and 48 hours of treatments on SOD activity in root of two tomato hybrids: Ikram and Losna. ... 79 Figure 17. Effect of 25 M B (control) and B toxicity (320 and 640 M) after 0, 4, 8, 24 and 48 hours of treatments on H2O2 concentration in root of two tomato
hybrids: Ikram and Losna ... 80 Figure 18. Effect of 25 M B (control) and B toxicity (320 and 640 M) after 0, 4, 8, 24 and 48 hours of treatments on MDA concentration in root of two tomato hybrids: Ikram and Losna ... 81 Figure 19. Effect of 25 M B (control) and B toxicity (320 and 640 M) after 0, 4, 8, 24 and 48 hours of treatments on POD activity in root of two tomato hybrids: Ikram and Losna. ... 83 Figure 20. Shoot dry weight of different tomato grafting combinations (Grafted, Self-grafted and Ungrafted) exposed to different increasing boron levels (0, 5, 10 and 15 mg L-1) at diverse time of exposure (0, 7, 14 and 21 days). ... 89
Figure 21. Leaf dry weight of different tomato grafting combinations (Grafted, Self-grafted and UnSelf-grafted) exposed to increasing boron levels (0, 5, 10 and 15 mg L-1) at diverse time of exposure (0, 7, 14 and 21 days) ... 90
Figure 22. Stem dry weight of different tomato grafting combinations (Grafted, Self-grafted and Ungrafted) exposed to increasing boron levels (0, 5, 10 and 15 mg L-1) at diverse time of exposure (0, 7, 14 and 21 days). ... 90
Figure 23. Boron toxicity symptoms on leaves of different tomato grafting combinations (Grafted, Self-grafted and Ungrafted) exposed to increasing boron levels (0, 5, 10 and 15 mg L-1) after 21 days of exposure. ... 91
Figure 24. Chlorophyll content of different tomato grafting combinations (Grafted, Self-grafted and Ungrafted) exposed to increasing boron levels(0, 5, 10 and 15 mg L-1) at diverse time of exposure (0, 7, 14 and 21 days). ... 92
Figure 25. Chlorophyll content in different leaf position of diverse tomato grafting combinations (Grafted; Self-Grafted; Ungrafted) ... 93 Figure 26. Chlorophyll content in leaves at diverse position of different tomato grafting combinations (Grafted; Self-grafted; Ungrafted) exposed to increasing boron levels (0, 5, 10 and 15 mg L-1) for 21 days ... 94
Figure 27. Root length of different tomato grafting combinations (Grafted, Self-grafted and UnSelf-grafted) exposed to different increasing boron levels (0, 5, 10 and 15 mg L-1) at diverse time of exposure (0, 7, 14 and 21 days). ... 96
Figure 28. Root dry weight of different tomato grafting combinations (Grafted, Self-grafted and UnSelf-grafted) exposed to increasing boron levels (0, 5, 10 and 15 mg L-1) at diverse time of exposure (0, 7, 14 and 21 days). ... 97
Figure 29. Root fineness of different tomato grafting combinations (Grafted, Self-grafted and UnSelf-grafted) exposed to increasing boron levels (0, 5, 10 and 15 mg L-1) at diverse time of exposure (0, 7, 14 and 21 days). ... 97
Figure 30. Root tissue density of different tomato grafting combinations (Grafted, Self-grafted and Ungrafted) exposed to increasing boron levels (0, 5, 10 and 15 mg L-1) at diverse time of exposure (0, 7, 14 and 21 days). ... 98
Figure 31. Multiple regressions between root length and root dry weight, root fineness and root tissue density of different tomato grafting combinations exposed to increasing boron levels at diverse days of exposure ... 99 Figure 32. Multiple regressions between root length and root dry weight, root fineness and root tissue density of different tomato grafting combinations to increasing boron levels (0, 5, 10 and 15 mg L-1) at 21 days of exposure. ... 100
Figure 33. Multiple regressions between root length and root dry weight, root fineness and root tissue density of different tomato grafting combinations (Grafted; Self-grafted; Ungrafted) exposed to different boron levels at 21 days of exposure. ... 101 Figure 34. Length of very fine roots (0-0.5 mm) of different tomato grafting combinations (Grafted, Self-grafted and Ungrafted) exposed to increasing boron levels (0, 5, 10 and 15 mg L-1) at diverse time of exposure (0, 7, 14 and 21
days). ... 102 Figure 35. Length of fine roots (0.5-1 mm) of different tomato grafting combinations (Grafted, Self-grafted and Ungrafted) exposed to increasing boron levels (0, 5, 10 and 15 mg L-1) at diverse time of exposure (0, 7, 14 and 21
days) ... 103 Figure 36. Length of large roots (>1 mm) of different tomato grafting combinations (Grafted, Self-grafted and Ungrafted) exposed to increasing boron levels (0, 5, 10 and 15 mg L-1) at diverse time of exposure (0, 7, 14 and 21 days). ... 103
LIST OF TABLES
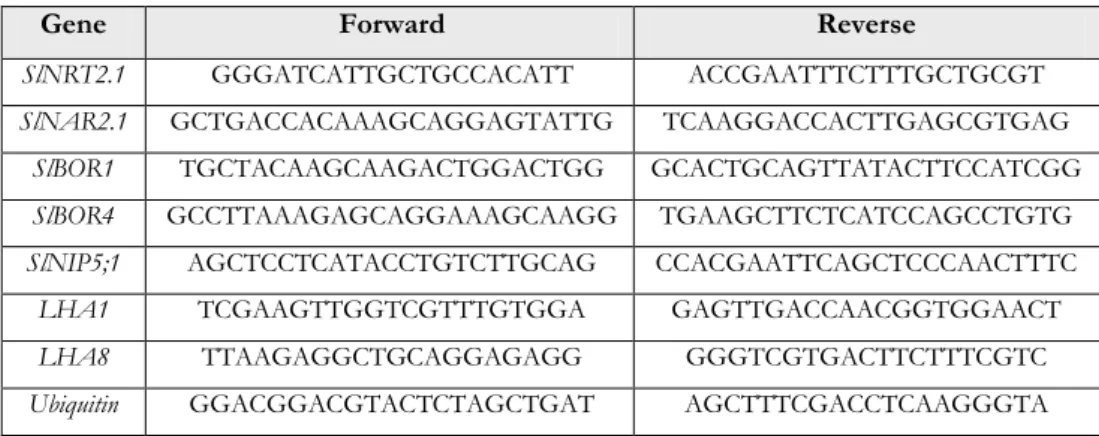
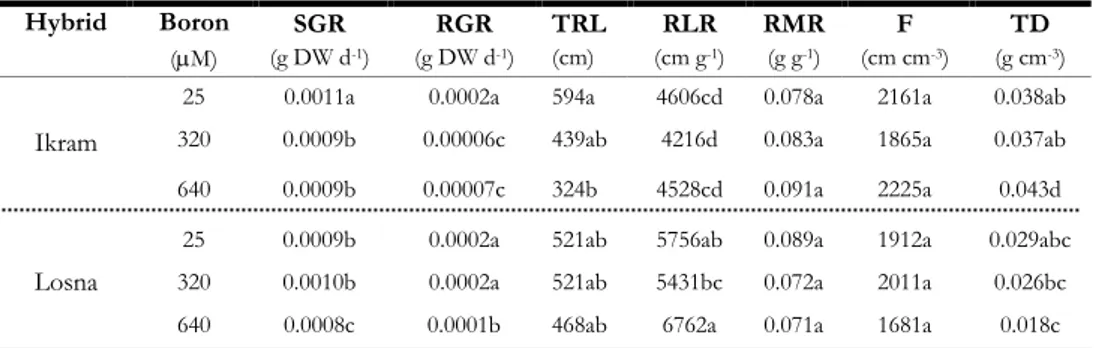
Table 1. Boron major reservoirs in the biosphere ... 3 Table 2. Boron-toxicity tolerant lines or cultivars in different crop species. ... 30 Table 3. Specific forward and reverse primer sequences (5′-3′ oriented) used in semiquantitative PCR expression analysis of the genes under investigation ... 53 Table 4. Morphological parameters of two tomato hybrids exposed to different boron level for 7 days. ... 55 Table 5. Morphological parameters of two tomato hybrids exposed to different boron level for 48 h. ... 57 Table 6. Three-way ANOVA analysis (P-value) for the shoot growth and root morphological parameters of different grafting combinations of tomato plants exposed to different boron levels at diverse time of exposure ... 89 Table 7. Coefficient correlation among root length and root dry weight, root fineness and root tissue density of different tomato grafting combinations
CHAPTER 1 GENERAL BACKGROUND: ECOPHYSIOLOGY OF
BORON AND PLANT NUTRITION
1.1 BORON CHEMISTRY
Belonging to third group in the periodic table (Tariq and Mott, 2007), boron (B) is considered as a typical metalloid element such as silicon (Si), arsenic (As) and germanium (Ge) (Nable et al., 1997), having properties intermediate between the metals and the non-metals (Argust, 1998). The small atom size (4,62 cm3mol-1)
together with three valence electrons and a high ionization energy defined its unique and complex chemical properties (Greenwood and Earnshaw, 1984). Boron is electron-deficient, possessing a vacant p-orbital and it is normally found in B3+ state.
However, B chemistry is of covalent stable B compounds and not of B3+ because of
its very high ionization potentials. It is usually assigned a +3 valence because it combines with more electronegative elements. Furthermore, it has tendency to form anionic rather than cationic complexes.
Boron is not present on Earth in its elemental form, it occurs in nature in combination with oxygen as borates such as the borax (Na2B4O7•10H2O), less
frequently as boric acid [B(OH)3 or H3BO3] and very rarely associated with fluorine,
as anion BF-4 (Power et al., 1997). On the contrary, in plant and animal cells, at pH about 7.5, in the citoplasmatic compartment more than 99.95% of the B exists in the H3BO3 form while the remaining part is present as borate [B(OH)-4].
Boron occurs in aqueous solution as H3BO3, hydrolyzing reversibly to the
borate ion [B(HO)-4] according to the reaction by Baes and Menders (1976):
B(OH)3 + H2O = B(OH)4 + H+ pKa = 9.2
In accordance with electronic B configuration, at a pH < 7, H3BO3 acts as a
very weak Lewis acid, and its activity seems to be related to the acceptance of OH
-rather than the donation of H+. Therefore, in neutral or slightly acid soils, B is
located mainly in the form of un-dissociated boric acid (Raven, 1980).
Both boric acid and borate can quickly react with many different types of molecules (Brown et al., 2002). In particular, they are able to form esters and complexes with a wide variety of mono- di- and poly-hydroxy compounds. The boric acid binds to a lot of sugars containing a furanoid rather than a piranoid ring as ribose, the main constituent of the RNA, (Loomis and Durst, 1992; Goldbach, 1997) and to apiose, mannitol, mannan and polymannuronic acid, essential constituents in plant cell wall. O’Neill et al. (2001, 2004) demonstrated that borate forms a cross-link
with apiose residues of rhamnogalacturonans II (RG-II), important components of plant cell wall, which is essential for normal leaf expansion in Arabidopsis thaliana. Although, Loomis and Durst (1992) sustained that the B complexes formation with ribonucleotides was a probable cause of boron toxicity, recently the ability of B to stabilize ribose and to form borate ester nucleotides, makes it a “prebiotic element” which provides an essential contribution to the “pre-RNA world” (Scorei, 2012; Grew et al., 2011).
Furthermore, the boric acid has a greater affinity to the organic cis-diols (Boeseken, 1949), and consequently some o-diphenols such as caffeic and hydroxiferulic acids, important precursors for the lignin biosynthesis in dicots, are able to form stable borates (McClure, 1976).
Both these B complexes with sugars and organic cis-diols could be considered fundamental in the living world. Indeed, the stabilization of these molecules could represent a most probable defense mechanism of genetic material, providing its thermal and chemical stability in hostile environments, throughout the evolution of life (Scorei, 2012; Grew et al., 2011).
In addition, the ubiquitous presence of OH groups within biological molecules allows the formation/dissociation of many B complexes (Power and Wood, 1997) which generally occur spontaneously through rapid kinetics mainly influenced by pH (Woods, 1996). Furthermore, the stability depends on the nature of the constitutive molecular groups of B complexes. For example, the presence of nitrate would increase the steadiness of B complexes since it is able to bond hydrogen molecules which confer greater electrostatic stability to them (Woods, 1996). The same behavior was observed with the coenzyme NAD+ which shows a
greater ability to form more stable borates complexes than its reduced form NADH (Brown et al., 2002). This could indirectly affect some enzymatic activities depending on NAD+ coenzyme causing significant metabolic disorders (Wimmer et al., 2003).
1.2 BORON SOURCE AND DISTRIBUTION
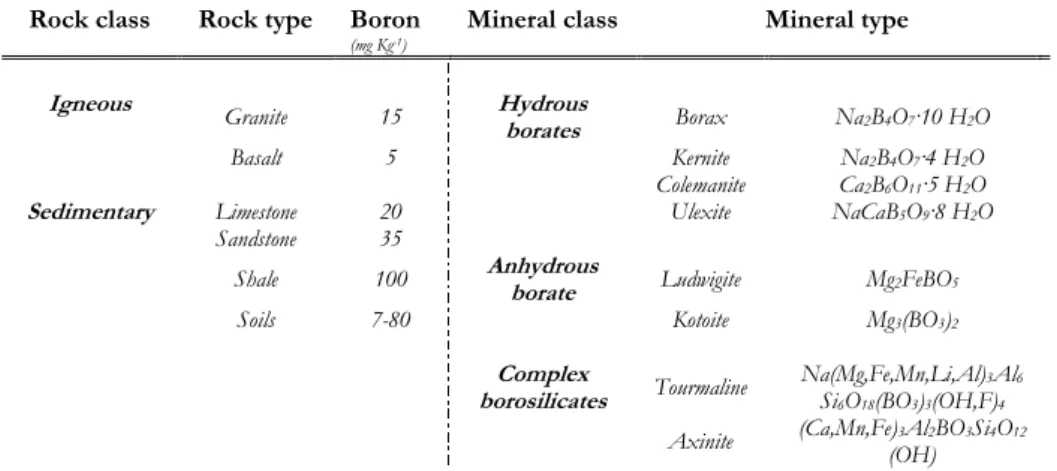
Boron is widely distributed in nature and its major reservoirs in the biosphere are shown in Table 1 (Kot, 2008). Its turnover and the extent of flows through which B moves among the different environmental compartments seem to be less clear. The B inorganic forms, usually found in water, soil, and atmosphere, originate from both natural and anthropogenic sources. Boron occurs mainly in silicate minerals at approximately 10 mg kg-1 concentration in the Earth’s
crust. It can be found as borosilicates in igneous, metamorphic and sedimentary rocks and its distribution among rock classes and types proposed by Krauskopf
(1972) has reported in Table 1. Natural weathering of sedimentary rocks is thought to be the primary source of boron compounds in water and soil (Butterwick et al., 1989) while it is predominantly released to the atmosphere from oceans (65-85%), volcanoes, and geothermal steam (Graedel, 1978). Global releases of elemental boron through these processes are estimated at approximately 360,000 metric tons annually (Moore, 1991). B-rich deposits around the globe are located in California, Australia, China, Russia, Argentina, although Turkey is ranked top with its share of almost 73% in the global boron reserve. In particular, the western Turkey contains 60% of B deposits causing a significant problem for agriculture and water resources (Ozkurt, 2000).
The B level in atmosphere averages ~ 20 ng m-3 with a range of 0.5 - 80 ng
m-3. Because borates exhibit low volatility, B would not be expected to be present
to a significant degree as a vapor in the atmosphere. Atmospheric emissions of borates and boric acid in a particulate (<1–45 μm in size) or vapor form occur as a result of volatilization of boric acid from the sea, volcanic activity, mining operations, glass and ceramic manufacturing, the application of agricultural chemicals, and coal-fired power plants.
Rock class Rock type Boron
(mg Kg-1)
Mineral class Mineral type
Igneous Granite 15 Hydrous
borates Borax Na2B4O7·10 H2O
Basalt 5 Kernite Na2B4O7·4 H2O Colemanite Ca2B6O11·5 H2O
Sedimentary Limestone 20 Ulexite NaCaB5O9·8 H2O
Sandstone 35
Shale 100 Anhydrous borate Ludwigite Mg2FeBO5
Soils 7-80 Kotoite Mg3(BO3)2
Complex
borosilicates Tourmaline Na(Mg,Fe,Mn,Li,Al)Si6O18(BO3)3(OH,F)3Al46
Axinite (Ca,Mn,Fe)3Al2BO3Si4O12 (OH)
Table 1 Boron major reservoirs in the biosphere
Boron is found in soils, from 10 to 300 mg kg-1, typically ranging from 0.1 to
0.5 mg L-1 (Howe, 1998) and in plants (10% of the total soil B content), but both
these issues will be deeply discussed in the following chapter sections.
In seawater, the concentration of boron ranges from 0.5 to 9.6 mg kg-1 with
an average of 4.6 mg kg-1 (Power and Woods, 1997). High levels of boron are also
e.g. in Mediterranean countries, approximately 8 mg L-1). These values can
significantly increase near areas with geothermal activity because of its high concentration in thermal waters (0.2 to 72 mg L-1). For example, the B concentration
in water supplies can reach values of 3-13 mg L-1 in exposed areas of Cornia Valley
(Italy) (EU research project BOREMED, http://boremed.brgm.fr/). This project showed that the presence of B in groundwater contamination is not caused by human activity due to urban agricultural and/or industrial residues (release of detergents, fertilizers, etc.), but by the Pleistocene geothermal area.
The B level in fresh water surface ranged from 0.001 to 2 mg L-1 in Europe
(mean value 0.6 mg L-1), Pakistan, Russia, reaching instead highest B values (4-26)
mg L-1 in South America. Consistent with B values observed in ground- and
surface-waters, B concentrations are also found in drinking-water (0.01 - 15 mg L-1) due to
the leaching from surrounding geology and wastewater discharges and the difficulty to remove it by conventional drinking-water treatment methods. Finally, boron is also present in irrigation water where it causes a serious problem for domestic and agriculture utilizations (Polat et al., 2004), affecting at B level higher than 1 mg L-1
yield of sensitive crops. Several examples have been reported in in Spain (Salinas et al.., 1981), Arizona (Ryan et al., 1977), northern Greece (Sotiropoulos, 1997) and Philippines (Dobermann and Fairhurst, 2000).
Boron is also found in foods and vegetables. In human health, diets rich in fruits, vegetables, legumes and nuts may provide the B amount needed to guarantee the function or composition of several body systems, including the brain, the skeleton and the immune system (Nielsen, 2008). An intake of over 1 mg day-1 is
desirable but probably not more than 13 mg day-1 (Nielsen, 1997). Neurological
effects, weight loss, testicular atrophy and skeleton malformation have been reported in animals with excessive boron intake (Yazbeck et al., 2005). It is an essential element also for diatoms, cyanobacteria, other marine algal flagellate (Loomis and Durst, 1992) and animal species. Although, the B function in animals is not completely understood (Devirian and Volpe, 2003).
Anthropogenic sources of boron are considered to contribute a lesser amount to the environment (7-18%) than natural processes. They include releases to atmosphere from power and chemical plants, and manufacturing facilities (Nable et al., 1997). On the contrary, fertilizers, herbicides, and industrial wastes are among the soil contamination sources. The occurrence of B contamination in water can come directly from industrial wastewater and municipal sewage, as well as indirectly from air deposition and soil runoff. For example, coal fly ash represents an important B source in both soil and water environments being easily leached from coal ash nearby coal-ash wastes dump (Wood and Nicholson, 1998) or coal-fired power station
(Hermann, 1994). Further, municipal and wastewater used for irrigation may contribute to high boron concentrations in agriculture systems (Tsadilis, 1997). Borates in detergents, soaps and personal care products, in pharmaceuticals (as pH buffers), can also contribute to the presence of boron in water (WHO, 1998).
1.3 BORON IN SOIL
Boron occurs in soils as H3BO3 and partially as B(HO)4 distributed unevenly
in the circulating solution and in the organic and mineral fractions. In particular, the un-dissociated form H3BO3 prevails in the soil solution, and only at pH > 9.2, the
H2BO3 form becomes predominant. In soils, B is considered the more mobile
element and often deficient among all the trace elements. In a study conducted by FAO on the micronutrients status in soils, the B deficiency was the most common micronutrient problem, affecting at least 8 million hectares worldwide (Sillanpaa, 1982; Tariq and Mott, 2007). Boron deficiency is found primarily in humid regions with well-drained soils or in sand soils as reported in some regions of China, Japan and USA (Tanaka and Fujiwara, 2008). High rainfall of these countries together with high boron solubility in soil solution may be the major reasons of B deficiency (Shorrocks, 1997). However, at slightly high concentrations, B may become toxic for plants as a range between B deficiency and toxicity is relatively narrow (Gupta, 1993), making difficult the B management in plant-soil system. Both B deficiency and toxicity are associated with plant disorders and reduction of crop yield and quality. Soils excessively B fertilized, irrigated with sewage debris or salt water may contain toxic B concentrations. Boron toxicity generally occurs when soils contain greater than 12 mg B Kg-1 (Hall, 2010) and it is usually confined to areas with less than 550
mm annual rainfall. Low rainfall in dry regions also means little soluble boron is leached from the root zone and soil profile (McDonald et al., 2010).The amount of water required to leach boron is approximately three times that required for sodium chloride leaching (Moore, 2004). The B toxic soils occur in Australia (Western Australia, South Australia and Victoria), Jordan, Malaysia, Peru, Chile (North), India, Israel, Mediterranean areas (Turkey, Morocco), and USA (California), (Nable et al., 1997; Brennan and Adcock 2004; Kot, 2008; Tanaka and Fujiwara, 2008).
Based on climatic zones, the concentrations and the chemical pool of B in soils vary. The boreal, tropical and temperate regions have low B concentrations ranging from 1 to 2 µg g-1. Conversely, the soils of arid and semiarid regions contain
rather high B concentrations between 10-40 µg g-1 (Evans and Sparks, 1983).
The main sources of B in most soils are B-containing primary minerals such as tourmaline [Na (Al, Fe, Li, Mg, Mn)3Al6 Si6O18 (BO3)3 (OH, F)4] and the volatile
emanations of volcanoes (Chesworth, 1991). Other more common B-containing minerals are: the ulexite, Na Ca[B5O6(OH)6]*5H2O; the borax, Na2 [B4O5 (OH) 4]*8H2O; the colemanite, Ca2[B3O4 (OH)3]*2H2O, a less soluble mineral, and the
kernite, Na2[B4O5(OH)4]*2H2O, a less hydrated borax. Because of the limited
solubility of such B-containing minerals in soils and their resistance to weathering, B is not readily available to plants (Nable, 1997; Zerrari et al., 1999). The B adsorbed on the surfaces of the colloidal soils does not affect the amount of B responsible of toxicity to plants (Ryan et al., 1977; Keren et al., 1985a; Keren et al., 1985b). Groundwater, for the addition of artificial residues mining processes, fertilizers or residues of fossil fuels (Nable, 1997), contributes to raise the B level in soils. However, the major source of B in soils is probably the irrigation water (Chauhan and Power, 1978; Keles et al., 2004). The threshold B concentration in water irrigation has been established for sensitive (0.3 mg L-1) and tolerant (2 mg L-1)crops,
taking into account the physical-chemical properties of the soil and the B soil interaction (Keren, 1996).
Total, acid soluble and water soluble are the three B pools present in soils. The total B content has little bearing on the status of available B to plants which results to be about 10% of the total content of B in the soils (Power et al., 1997). The water soluble B content frequently ranged from 7 to 80 µg g-1 in soils (Krauskopf,
1972) providing a general indication of B supply to plants. In relation to water-soluble B concentrations in soils, Fleming (1980) defines three categories: insufficient (<1µg mL-1), sufficient (1-5µg mL-1) and toxic (> 5µg mL-1) boron for
normal plant development. This classification has been later reviewed by Sillanpaa (1982) and Shorrocks (1993) with some modifications which show however that water soluble B in soils > 0.5 µg g-1 is sufficient for plant growth of many crops.
However, water soluble boron depends on soil system, crop species, lime application and irrigation management and environmental conditions (Tariq and Mott, 2007).
Boron sorption-desorption processes regulate the water-soluble B availability acting as source-sink for plant uptake in soils solution which in turn is influenced by soil physical-chemical properties (Keren and Bingham, 1985; Chen et al., 2002; Arora and Chahal, 2005). Among these, the soil pH has been reported as the main factor affecting the B adsorption in agricultural soils (Keren and Bingham, 1985; Saltali et al., 2005; Soares et al., 2008), together with soil texture, soil moisture, clay content, Al and Fe (hydr)oxides, clay minerals, calcium carbonate and organic matter (Goldberg, 1997; Arora et al., 2002; Goldberg et al., 2005; Arora and Chahal, 2007; Goldberg et al., 2008; Shafiq et al., 2008; Arora and Chahal, 2010).
A positive correlation between B adsorption on clay minerals, hydroxyl- Al and the increase of pH values in soils has been reported (Gupta, 1993; Keren, 1996;
Goldberg, 1997). Indeed, at pH below 7.0, the predominant form H3BO3 shows a
relatively low affinity to the clay, while, in alkaline pH range, B(HO)-4 species increased rapidly reaching the maximum of adsorption around pH 9.0 (Bingham et al., 1971; Elrashidi and O'Connor, 1982). Different empirical models have been applied to describe adsorption reactions such as Langmuir and Freundlich adsorption isotherm equations (Goldberg, 2003). Recently, Steiner and Lana (2013), analyzing some soils of Paraná (Brazil) confirmed that B adsorption was dependent on soil pH, increasing as a function of pH, but was also affected by soil properties such as the organic matter, clay and aluminum oxide content.
Excessive moisture in the soil can cause significant loss of B related to the phenomena of leaching (Kot, 2008), while in clay soils the B is more easily retained partly because of the strong capacity of the clays to form stable complexes with this microelement (Mattigod et al., 1985). On weight basis, illite is the most reactive among the common clay minerals whereas kaolinite is the least reactive (Keren, 1996). The presence of organic matter in the soil provides an important reserve of B due to the presence of this element in many organic compounds. Boron can be absorbed on organic matter and sesquioxides by ligand exchange mechanism (Yermiyahu et al., 1988). Some authors have shown not only that the presence of B in the soil organic matter can be higher than that in the mineral fraction (Yermiyahu et al., 2001; Lemarchand et al., 2005), but also that the absorption of B is positively influenced through fertilization with organic materials (Yermiyahu et al., 2001). Coarse textured soils often contain less boron than fine textured soils (Sarkar et al., 2008).
In arid or semiarid areas, B toxicity is frequently associated with salt stress (Goldberg, 1997) as observed in the Lluta valley (Northern Chile) and in the San Joaquin Valley (California) (Bastías et al., 2004; Wimmer et al., 2003). Interactive effects on stress responses have been clearly established, but the results are often contrasting indicating antagonistic or synergistic interactions even within the same plant species (Mittler, 2006; Yermiyahu et al., 2008). Bingham et al. (1987) found that plant response to boron was independent of salinity levels in the soil. On the other hand, salinity seemed to alleviate B toxicity decreasing total shoot B concentrations (Alpaslan and Gunes, 2001; Ismail, 2003; Diaz and Grattan, 2009). Wimmer et al. (2003) found that salinity can aggravate boron toxicity symptoms in several plant species because of combined stresses significantly increased soluble boron concentrations at intra and intercellular level. So far, conclusive considerations on mutual relationship between salt stress and B toxicity are lacking yet (Yermiyahu et al., 2008; Grieve et al., 2010).
1.4 BORON IN PLANTS
The presence of B in plants was reported for the first time in 1910, but only later Katherine Warington (1923) claimed the importance of B for growth and development in broad beans and other legumes. In the same period, the B requirement for six non-leguminous dicots and one graminaceous plant was also demonstrated (Sommer and Lipman, 1926). Currently, based on the B requirement for their growth and development, plants can be divided into four classes: i) lactifers (latex-forming species); ii) legumes; and subsequently iii) the remaining dicots and rather all monocots families leaving out; and iv) graminacous plants, considered to be the less-demanding (Bonilla et al., 2009). Excluding lactifers, the higher B requirement in all other plants was presumably due to a higher content of cis-diols configuration compounds within the cell wall, such as pectins and polygalatturans (Loomis and Durst, 1992). This hypothesis was based on diverse content of molecules capable of creating B complexes in the cell wall radicals which was equal to 3-5 g g-1 dry weight in grasses increasing up to 30 g g-1 in dicotyledonous species
(Tanaka et al., 1967). Therefore, such differences could support the diversity in the B-requirement among plant species for reaching an optimal growth (Marschner, 1995).
By now, B is considered an essential micro-nutrient for normal plant growth (Emebiri et al., 2009), unevenly distributed within plants and especially found in tissues of reproductive structures (Saleem et al., 2011). Crop species and cultivars show varying ranges at which B is considered adequate. For example, in monocots, B concentrations range from 1 to 6 mg kg-1 while in most dicots from 20 to 70 mg kg-1.
However, the required B range necessary for optimal plant growth is very narrow (Moore, 2004; Bingham et al., 1987; Grieve and Poss, 2000). For example, in rice B concentration between 6-15 mg kg-1 is considered adequate while just below and
above these values, B becomes deficient or toxic, respectively (Dobberman and Fairhurst, 2000). Both deficient and toxic B levels caused plant disorders reducing the yield and quality of final products.
Boron is involved in many important processes in higher plants such as: i) the transport of sugars and carbohydrate metabolism; ii) the cell wall synthesis and the lignification process; iii) the maintenance of the integrity of the plasma membrane and of its function; iv) the stimulation of the nucleic acids metabolism; v) the indoleacetic acid metabolism; vi) the ascorbate/glutathione cycle; vii) the phenolic compounds metabolism; vii) the pollen tube formation; viii) the nitrogen metabolism; ix) the photosynthesis and also x) several enzymatic activities (Figure 1) (Paull, 1990; Moore, 2004; Rehman et al. 2006; Reid, 2010).
However, its primary role, widely recognized, is in the cell wall and the plasma membrane where it is required as structural component conferring stability (as already reported by Warington, 1923).
1.4.1 BORON IN THE CELL WALL AND MEMBRANES
Ninety percent of B content in plant cells is localized in the cell wall fraction (Blewins and Lukaszewski, 1998; Loomis and Durst, 1992; Hu and Brown, 1994). Such evidence highlighted strong influence of B in the organization of cells wall proteins, pectins and/or precursors during plant growth and development (Torosell, 1956; Spurr, 1957). Indeed, in B deficient plants, the structural abnormalities in the composition of cell wall and middle lamella (Matoh et al., 1992) caused a growth block on the apical meristems of root and stem (Brown et al., 2002), on the pollen tubes (Schmucker, 1933), as well as the fragility in developing leaves and petioles (Loomis and Durst, 1992; Shorrocks, 1997; Goldbach, 1997).
The B functional role in cell wall organization has been firstly demonstrated after the isolation of a B-polysaccharide complex from radish root cell walls (Matoh et al.,1993) on which a rhamnogalacturonan II (RGII) polysaccharide was later characterized (Kobayashi et al., 1996; O 'Neil et al., 1996). In particular, RGII was
cross-linked by 1:2 borate- diol diester to form the dimeric RGII via cis-diol groups of two apiose residues forming a stable three-dimensional network (O' Neil et al., 1996). In the same period, the presence of RGII-B complex in cell wall of other 22 species has been demonstrated (Matoh et al., 1996). In absence of B, Fleischer et al. (1999) observed a wider formation of cell wall holes than normal inside the three-dimensional structure’ due to a lack of dB-RGII, suggesting a new B functional role in cell wall. The presence of improper pore, in B deficient cells, may affect physiological important processes such as the incorporation and transport of polymers into the wall. In this respect, Dannel et al. (2002) stated that the B- RGII complexes contributed to the porosity and strength of the cell wall. Moreover, O’ Neil et al. (2001, 2004), using the mur1 mutant in Arabidopsis thaliana characterized by abnormal sugar composition of RGII, defined at molecular basis the importance of B-RGII for the normal leaf expansion. Hence, the B requirement was strongly associated to the RGII content of the cell walls in different plant species (Reid et al., 2004) and a reduced production of pectic substances or precursors of the cell wall in plants exposed to B deficiency has been reported (Bonilla et al., 2009), although there is no convincing evidence to suggesting a direct involvement of B in the process of cell wall synthesis.
Boron effects on organisms lacking in cell walls underlined the B essentiality in plant growth and development beyond its role in cell wall structure (Bennett et al., 1999; Läuchli, 2002). Many authors have speculated that B plays a structural role inside the plasma membrane which may explain the large number of B effects on it. Cakmak et al. (1995) sustained that B stabilizes the plasma membrane structure by forming complexes with its components. They observed that the loss of potassium, glucose, phenols and amino acids in sunflower leaves subjected to shortage of B underlined the B role in the integrity of plasma membranes. Several studies have shown that B affects the structure and function of membrane and especially of plasma membrane (Blevin and Lukaszweski, 1998). A B adequate supply in plants triggered a multitude of events including the membrane hyperpolarization of cell radicals (Schon et al., 1990), the stimulation of ferricyanide-dependent H+ release
(Goldbach et al., 1990) and of H+-ATPase and NADH oxidase activities (Barr et al.,
1993) and finally of ion uptake (Blevin and Lukaszweski, 1998). On the contrary, B deficiency reduced rubidium (Rb+) and phosphorus (P) uptake in Vicia faba,
sunflower and maize roots which was restored after B addition (Robertson and Loghman, 1974; Goldbach, 1984). Boron deficiency and toxicity also inhibited ATP-dependent H+ pumping and vanadate-sensitive ATPase activity (Pollard et al., 1977;
Ferrol et al., 1993). In cell suspension of carrot and tomato cells, B reduced the ferricyanide-induced proton release mediated by vanadate suppression, suggesting
the involvement of plasma membrane proton pump in this process (Golgbach et al., 1990). Therefore, B not only stabilized the membrane-molecules with cis-diol groups (Bolanos et al., 2004) but also regulated its function. Recently, in tobacco plants boron deficiency caused a nitrate content decrease due to the lower net nitrate uptake rate as a consequence of root plasma membrane H+-ATPase (PMA2)
transcript reductions (Camacho-Cristobal et al., 2007, 2008).
Moreover, it has been hypothesized that B may be involved in the structure of so-called "membrane rafts" particularly “lipid rafts”, physiologically active membrane fractions with relevant functions in signal transduction and useful as binding sites for glucosilfosfatil-inositol (GPI) proteins (Brown et al., 2002). They are characterized by high concentrations of glycolipids and glycoproteins, providing a significant number of B complexing sites. In addition, these fractions also contain either sugars such as galactose, mannose or amino acids such as serine and tyrosine able to link with the B. For this reason, B seemed to play a specific function in membrane stability, integrity and function of membrane rafts. Recently, Voxeur and Fry (2014) characterized, in rose cell cultures, a glycosylinositol phosphorylceramides (GIPCs), the major sphingolipids in lipid rafts able to form a GIPC-B-RGII complex (Borner et al., 2005),. using a thin-layer chromatography (TLC) and mass spectrometry (MS) approach. They concluded that: i) B played a structural role in plasma membrane; ii) high B level disrupting the membrane components was responsible for membrane phytotoxic effect; iii) GIPCs facilitatedvored B-dependent RGII dimerization process; and finally iv) GIPC-B-RGII gave for the first time, the molecular explanation of the wall-membrane attachment sites (Voxeur and Fry, 2014).
1.4.2 BORON AND PLASMA MEMBRANE H+-ATPASE INTERACTION
The plasma membrane (pm)H+-ATPase is an important functional protein
which plays a central role in plant physiology. The pmH+-ATPase is involved in ATP
hydrolysis to transport protons out of the cytosol into the apoplast establishing an electrochemical gradient across the plasma membrane (Duby and Boutry 2009). This gradient generates a proton-motive force which drives the secondary ion transport (Briskin and Hanson 1992; Morsomme and Boutry 2000; Palmgren 2001) such as nitrate (Santi et al., 1995; 2003; Sorgonà et al., 2010; 2011), phosphorus (Yan et al., 2002), potassium (Schachtman and Schroeder 1994), and iron (Schmidt 2003; Dell’Orto et al., 2000). In this way, this enzyme controls root nutrient uptake and xylem or phloem loading. Moreover, pmH+-ATPase is involved in other important
physiological processes, such as stomata opening, expansion growth, and cytosolic pH regulation. According to the acid-growth theory, auxin activates H+-ATPase that
extrudes protons which in turn decreasing the apoplastic pH activates enzymes involved in cell-wall loosening (Hager 2003). A higher concentration of H+ in the
apoplast may also activate cell-wall proteins such as expansins (Cosgrove 2000) contributing to increase the cell-wall extensibility by breaking the load bearing bonds (Keller and Cosgrove 1995; Purugganan et al., 1997).
The pmH+-ATPase is encoded by a multigene family showing several
isoforms of which 9-12 have been already identified in different plant species. Several isoforms related to nutrient transport and cell growth are widely expressed in most plant tissues (Arango et al., 2003; Gaxiola et al., 2007). They may have different features, such as substrate affinity, Vmax, and pumping efficiency (Luo et al., 1999). The pmH+-ATPase activity is controlled by an auto-inhibitory domain at the
C-terminus (Palmgren et al,. 1991) whose modifications can change the pumping efficiency of the enzyme (H+ transport /ATP coupling).
Several reports demonstrated that the presence of B in the root medium increased plant growth. Since B is mainly localized in the cell wall (Hu and Brown, 1994; Hu et al,. 1996) and cross-linked with rhamnogalacturonan II (O’Neill et al., 2004), it can be considered to be an important factor in cell wall extensibility and plant growth stimulation (Hu and Brown 1994; Findeklee and Goldbach 1996). The B-stimulated activity of plasma membrane NADH oxidase and H+ secretion has
been reported in cultured carrot cells (Barr and Crane., 1993). In sunflower root cells and leaved elodea (Elodea densa) leaf cells, a significant membrane depolarization after cells movement from B containing to B-free solution was observed, confirming the micronutrient effects on proton secretion and electrical potential gradient generation across the membrane (Blaser-Grill et al., 1989). It has been assumed that the B-induced stimulation of plant growth is caused by changes in pmH+-ATPase activity
(O’Neill et al., 2004).
Further, the pmH+-ATPase activity is a crucial factor in the plant survival
under a variety of environmental stresses, such as salt (Vitart et al., 2001) and aluminum (Ahn et al., 2001) treatments. Thus, it is reasonable to hypothesize that the root pmH+-ATPase could be involved in the B stress adaptation. However, the
evidence for its possible involvement under B excess is still lacking. 1.4.3 BORON AS SIGNAL
Although signal transduction pathways and plant sensing for mineral deficiencies are well known for macronutrients (Schachtman and Shin, 2007), the knowledge of most of micronutrients, especially B, is more limited. None of the proposed hypothesis fully explains how so many decisive pathways for plant development respond in short-term to B deficiency.