Tissue: An Ex Vivo Study
Annunziato Mangiola1., Nathalie Saulnier2., Pasquale De Bonis1*.
, Daniela Orteschi5., Gigliola Sica4., Gina Lama4., Benedetta Ludovica Pettorini1, Giovanni Sabatino1, Marcella Zollino5, Libero Lauriola3, Anna Colabianchi4, Gabriella Proietti4, Gyula Kovacs6, Giulio Maira1, Carmelo Anile1
1 Institute of Neurosurgery, Faculty of Medicine, Catholic University of Rome, Rome, Italy, 2 Institute of Human Anatomy, Faculty of Medicine, Catholic University of Rome,
Rome, Italy,3 Institute of Pathology, Faculty of Medicine, Catholic University of Rome, Rome, Italy, 4 Institute of Histology and Embryology, Faculty of Medicine, Catholic
University of Rome, Rome, Italy,5 Institute of Genetics, Faculty of Medicine, Catholic University of Rome, Rome, Italy, 6 Medical Faculty, Ruprecht Karls University,
Heidelberg, Germany
Abstract
The gene expression pattern of glioblastoma (GBM) is well documented but the expression profile of brain adjacent to tumor is not yet analysed. This may help to understand the oncogenic pathway of GBM development. We have established the genome-wide expression profiles of samples isolated from GBM tumor mass, white matter adjacent to tumor (apparently free of tumor cells), and white matter controls by using the Affymetrix HG-U133 arrays. Array-CGH (aCGH) was also performed to detect genomic alterations. Among genes dysregulated in peritumoral white matter, 15 were over-expressed, while 42 were down-regulated when compared to white matter controls. A similar expression profile was detected in GBM cells. Growth, proliferation and cell motility/adhesion-associated genes were up-regulated while genes involved in neurogenesis were down-regulated. Furthermore, several tumor suppressor genes along with the KLRC1 (a member of natural killer receptor) were also down-regulated in the peritumoral brain tissue. Several mosaic genomic lesions were detected by aCGH, mostly in tumor samples and several GBM-associated mosaic genomic lesions were also present in the peritumoral brain tissue, with a similar mosaicism pattern. Our data could be explained by a dilution of genes expressed from tumor cells infiltrating the peritumour tissue. Alternatively, these findings could be substained by a relevant amount of ‘‘apparently normal’’ cells presenting a gene profile compatible with a precancerous state or even ‘‘quiescent’’ cancer cells. Otherwise, the recurrent tumor may arise from both infiltrating tumor cells and from an interaction and recruitment of apparently normal cells in the peritumor tissue by infiltrating tumor cells.
Citation: Mangiola A, Saulnier N, De Bonis P, Orteschi D, Sica G, et al. (2013) Gene Expression Profile of Glioblastoma Peritumoral Tissue: An Ex Vivo Study. PLoS ONE 8(3): e57145. doi:10.1371/journal.pone.0057145
Editor: Giovambattista Pani, Catholic University Medical School, Italy
Received September 13, 2012; Accepted January 18, 2013; Published March 5, 2013
Copyright: ß 2013 Mangiola et al. This is an open-access article distributed under the terms of the Creative Commons Attribution License, which permits unrestricted use, distribution, and reproduction in any medium, provided the original author and source are credited.
Funding: This study was supported by grants FIRB (Fondo per Investimenti Ricerca di Base-Funding for Basic Research, by Ministry of University and Research), PRIN (Programma di Ricerca Scientifica di Rilevante Interesse Nazionale-Scientific Research Program with high national interest-by Ministry of University and Research), Atena-Onlus. The funders had no role in study design, data collection and analysis, decision to publish, or preparation of the manuscript. Competing Interests: The authors have declared that no competing interests exist.
* E-mail: [email protected]
.These authors contributed equally to this work.
Introduction
Glioblastoma (GBM) is the most common malignant tumor of the brain. GBM rapidly proliferates and invades the central nervous system. Due to his invasive characteristics, the prognosis of GBM patients is very poor, despite of the treatment that currently consists of surgical resection followed by radiotherapy plus concomitant and adjuvant temozolomide [1]. Targeted therapies have been introduced, based on information obtained from molecular studies of the tumor tissue (usually shown at MRI as an enhanced lesion, ET) [2]. However, no clear survival benefit has been demonstrated, probably because tumor tissue represents the last step of tumorigenesis, involving some alterations allowing tumor-cells to survive. Since recurrence in peritumoral tissue occurs in about 95% of patients [3], getting a deeper insight into the biology of the brain adjacent to-tumor (BAT) is of great interest. It has been demonstrated that the expression of a series of elements and amino-acids is altered in the BAT [4,5,6,7,8]. It has
been shown that even in the absence of tumor cells, kinases involved in cell proliferation, migration and apoptosis are expressed in BAT together with molecules linked to stemness, invasion and neo-angiogenesis, which might indicate that BAT is undergoing transformation [9,10,11]. To support this hypothesis, we carried out a gene expression profile and a genomic analysis of BAT to detect alterations that may indicate the appearance of neoplastic features. To achieve our aim, we have compared the gene expression profile of tissue samples from ET, BAT, and normal white matter (CTRL) and have analyzed the BAT with an Array-CGH to detect genomic alterations.
Methods
Patients and Specimens
From January 2006 to December 2007, 60 adults were operated for primary GBM at our Institute. We selected 11 patients with tumor location far from eloquent areas. Among them, 5 patients
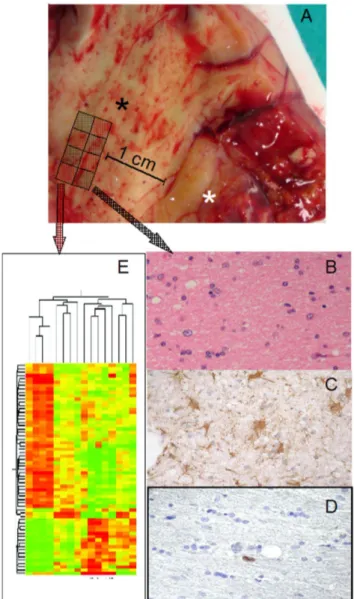
did not present tumor cells in BAT and were included in the study. Tumor was removed with wide tumor-free resection margins of 1– 2 cm. One part of the ET (without areas of necrosis) was immediately fixed in 10% neutral buffered formalin for histolog-ical analysis and the second one was immediately frozen on dry ice for molecular analysis. BAT specimens were obtained using a sampling-grid (Figure1A). CTRL specimens were derived from 4 patients at the same ages operated for deep cavernomas with radiological signs of recent bleeding. These samples were used as controls in molecular analyses.
Ethics statement. All patients provided written consent to use their specimens for research purposes, none of them was
identifiable. The study was approved by the local ethics committee (Catholic University Ethics Committee, Rome). The ethical principles of the declaration of Helsinki were strictly followed.
Histopathology
All histological samples were reviewed by a board-certified neuropathologist (LL) and all tumours were classified as glioblas-toma (WHO IV). Multiple levels of each paraffin block of samples used for research purposes (ET, BAT and CTRL) were thoroughly examined. No tumor cells were seen in BAT samples used in this study.
Gene Expression Analysis
For global gene expression analysis we used 4 CTRL samples, 5 ET samples (ET1, ET2, ET3, ET4, ET5), and 7 BAT samples (BAT1, BAT3, BAT5; in two patient samples were taken from two different peritumoral areas: BAT2, BAT2R; BAT4, BAT4R). Total RNA was extracted using Trizol Reagent followed by clean-up and DNase digestion on an RNeasy spin column. RNA was quantified by UV spectrophotometer and quality was assessed on agarose gel. RNA was processed for use on the Affymetrix Human Expression HG-U133A arrays (Affymetrix, Santa Clara, CA) according to manufacturer’s instructions. Briefly, 2.5mg of each RNA was converted into double-strand cDNA using a T7-(dT)24 primer. cDNA was used as template to generate biotinylated cRNA during an in vitro transcription step. Labeled cRNA was purified, chemically fragmented and 15mg were hybridized on the array for 16 h at 45uC in a rotisserie oven set at 60 rpm. The arrays were then stained in the Affymetrix Fluidic Station and scanned twice using the Agilent Gene Array scanner 2500.
The expression data were generated by Affymetrix microarray suite 5.0 software and loaded into GeneSpring Expression Analysis version 7.3 software. Raw intensities from each chip were normalized using the GC-RMA method completed by an additional normalization to the median for each gene. Data were filtered to eliminate genes displaying an averaged intensity inferior to the global array background.
Datasets were then assigned to the three experimental groups: CTRL, ET, and BAT, and the averaged log2 intensities of biological replicates were used for further analysis. Homogeneity of sample groups was verified by analysis of the principal component (PCA). Pre-filtered data were submitted to statistical analysis (t-test; P,0.05 with FDR correction) to identify genes differentially expressed between ET and BAT samples, and between BAT and CTRL. Genes with a fold change of gene expression .2 between CTRL and BAT samples were subjected to hierarchical clustering using Pearson correlation coefficient. Results have been deposited in NCBI Gene Expression Omnibus http://www.ncbi.nlm.nih.gov/projects/geo/(accession number: GSE13276).
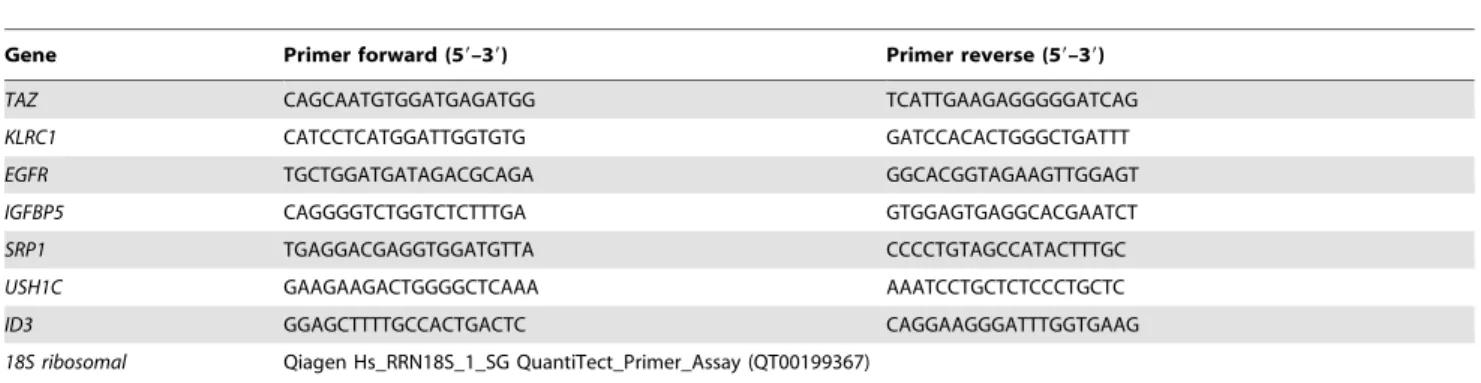
Quantitative Real-time PCR
About 1.5mg of total RNA were reverse-transcribed by SuperScript III, using random hexamer primers (Invitrogen, Carlsbad, CA, USA). Quantitative real-time PCR (qPCR) was carried out with LightCycler technology (Roche Molecular Biochemicals, Indianapolis, IN, USA). Oligonucleotide primers (Table 1) were designed using Primer3 software (http://frodo. wi.mit.edu/). Cycling conditions: 95uC for 10 minutes, 40 cycles of 95uC for 10 seconds, 58uC for 7 seconds, 72uC for 8 seconds, followed by a melt curve analysis immediately begun to rule out synthesis of unspecific products. Crossing points (Cp) of
Figure 1. Tissue sampling. (A) Tissue specimen opened in a book-wise fashion before sampling; white asterisk: tumor; black asterisk: BAT. Sampling-grid: each tissue specimen was generally divided into eight parts, and BAT samples for molecular analyses were contiguous to those used for histology; in this way, a higher probability of homogeneity between samples used for histology and gene expression analysis, quantitative real-time PCR, western blot analysis and array-CGH was obtained. (B) H&E staining of BAT with absence of morphologically neoplastic cells. (C) GFAP staining, showing reactive astrocytes, with stellar morphology. (D) Ki67/MIB-1 was always ,1%. (E) Gene-microarray analysis.
real-time-PCR curves were determined by the Light cycler software using the second derivative maximum method. For each target, two independent amplifications were performed and the mean value was used for further analysis. The 22DDCt method was applied to calculate fold changes in the expression levels of the genes. Statistical analysis was performed using t-test.
Western-blot Analysis
The presence of KLRC1 (killer cell lectin-like receptor sub family C, member1) in 3 independent specimens of BAT and 3 CTRL samples was evaluated by western-blot analysis. Fortymg of proteins were resolved by 12% SDS-PAGE and transferred to PVDF membrane. Non specific binding was blocked with 5% nonfat dry milk for 1 h. The blots were probed with a 1:500
dilution of mouse anti-human KLRC1 antibody (Abnova Corpo-ration.) or a 1:10.000 dilution of mouse anti-human b-actin, overnight at 4uC. Biotinylated anti-mouse IgG (dilution 1:1000; Vector Laboratories, Burlingame, CA, USA) was used as secondary antibody for 1 h at RT. After washes in PBS containing 0.1% Tween-20, membranes were incubated for 30 min at RT with Vectastain Elite ABC reagent (Vector Laboratories), and antibody reactivity was visualized by incubation with diamino-benzidine.
Array-CGH
DNA from 3 frozen ET samples (ET1, ET2 and ET3) and 3 matched BAT samples (BAT1, BAT2R and BAT3) was extracted using QIAamp DNA Mini Kit (QIAGEN, Hilden, Germany). The rest of frozen tissue of BAT1, BAT2R and BAT3 samples was then evaluated in frozen sections and no tumor cells were identified.
Oligonucleotide aCGH was performed using the Agilent Human Genome CGH microarray 4644K, (Agilent Technol-ogies Santa Clara, CA, USA), with an average resolution of 75 kb, following the manufacturer’s instructions. Each sample was paired with a sex-matched commercial control DNA (Promega, Madison, WI, USA), and hybridized twice in a dye-swap experiment, in order to minimize false positive calls. The arrays were analyzed using GenePix 4000B scanner (Axon, Union City, CA, USA) and Feature Extraction V.9.5.1 software. A graphical overview of the results was obtained using CGH Analytics V.3.5.14 software. Combined dye-swapped experi-ments were analyzed with ADM-2 algorithm at 3 different thresholds: 4, 5 and 6, with Centralization and Fuzzy Zero corrections turned on, with the purpose of detecting low grade mosaicisms. The percentage of abnormal cells was inferred using the formula proposed by Valli et al. [12].
Immunohistology
Both immunohistochemical and immunofluorescence analyses were performed in paraffin-embedded tissue sections (5mm thick) from ET and BAT. All samples were deparaffinized and rehydrated. Immunohistochemical and immunofluorescence anal-yses were performed considering the results of the gene expression analyses. In particular, the expression of some proteins whose genes were over-expressed in the BAT compared with CTRL was analyzed. Moreover, immunofluorescence analysis for CD133 protein was performed.
For immunohistochemistry, after the endogen peroxidase blocking, sections were incubated with monoclonal anti-human GFAP (1:100; clone 273807; R&D SYSTEMS, Minneapolis, MN, USA), anti-human Ki-67 (1:100; clone MIB-1; Dako, Table 1. Primer sequences.
Gene Primer forward (59–39) Primer reverse (59–39)
TAZ CAGCAATGTGGATGAGATGG TCATTGAAGAGGGGGATCAG
KLRC1 CATCCTCATGGATTGGTGTG GATCCACACTGGGCTGATTT
EGFR TGCTGGATGATAGACGCAGA GGCACGGTAGAAGTTGGAGT
IGFBP5 CAGGGGTCTGGTCTCTTTGA GTGGAGTGAGGCACGAATCT
SRP1 TGAGGACGAGGTGGATGTTA CCCCTGTAGCCATACTTTGC
USH1C GAAGAAGACTGGGGCTCAAA AAATCCTGCTCTCCCTGCTC
ID3 GGAGCTTTTGCCACTGACTC CAGGAAGGGATTTGGTGAAG
18S ribosomal Qiagen Hs_RRN18S_1_SG QuantiTect_Primer_Assay (QT00199367)
doi:10.1371/journal.pone.0057145.t001
Figure 2. PCA 3D view for gene expression profiles of samples of the three experimental conditions (red: CTRL; yellow: ET; blue: BAT). Every dot represents a sample. PCA was based on log2 ratios and the expression profiles were performed across the 14,500 genes of the human HG-U133A array. The first 3 principal components are plotted. PCA representation shows samples segregation according to their tissue origin.
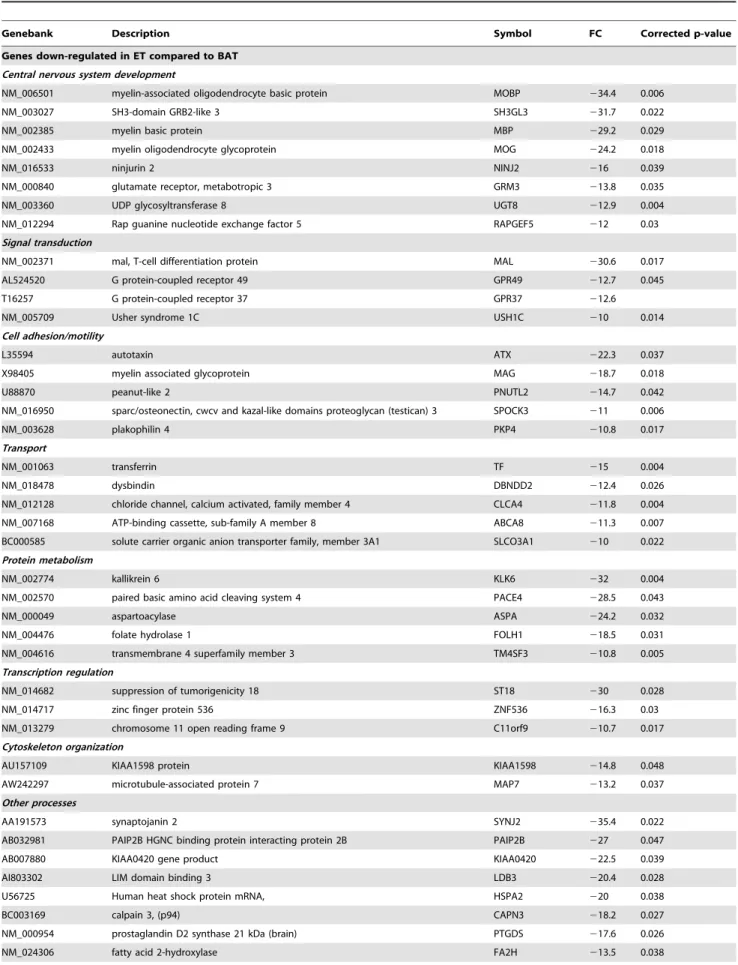
Table 2. Selection of the genes significantly different between ET and BAT with a 10-fold difference in expression levels.
Genebank Description Symbol FC Corrected p-value
Genes down-regulated in ET compared to BAT Central nervous system development
NM_006501 myelin-associated oligodendrocyte basic protein MOBP 234.4 0.006
NM_003027 SH3-domain GRB2-like 3 SH3GL3 231.7 0.022
NM_002385 myelin basic protein MBP 229.2 0.029
NM_002433 myelin oligodendrocyte glycoprotein MOG 224.2 0.018
NM_016533 ninjurin 2 NINJ2 216 0.039
NM_000840 glutamate receptor, metabotropic 3 GRM3 213.8 0.035
NM_003360 UDP glycosyltransferase 8 UGT8 212.9 0.004
NM_012294 Rap guanine nucleotide exchange factor 5 RAPGEF5 212 0.03
Signal transduction
NM_002371 mal, T-cell differentiation protein MAL 230.6 0.017
AL524520 G protein-coupled receptor 49 GPR49 212.7 0.045
T16257 G protein-coupled receptor 37 GPR37 212.6
NM_005709 Usher syndrome 1C USH1C 210 0.014
Cell adhesion/motility
L35594 autotaxin ATX 222.3 0.037
X98405 myelin associated glycoprotein MAG 218.7 0.018
U88870 peanut-like 2 PNUTL2 214.7 0.042
NM_016950 sparc/osteonectin, cwcv and kazal-like domains proteoglycan (testican) 3 SPOCK3 211 0.006
NM_003628 plakophilin 4 PKP4 210.8 0.017
Transport
NM_001063 transferrin TF 215 0.004
NM_018478 dysbindin DBNDD2 212.4 0.026
NM_012128 chloride channel, calcium activated, family member 4 CLCA4 211.8 0.004
NM_007168 ATP-binding cassette, sub-family A member 8 ABCA8 211.3 0.007
BC000585 solute carrier organic anion transporter family, member 3A1 SLCO3A1 210 0.022
Protein metabolism
NM_002774 kallikrein 6 KLK6 232 0.004
NM_002570 paired basic amino acid cleaving system 4 PACE4 228.5 0.043
NM_000049 aspartoacylase ASPA 224.2 0.032
NM_004476 folate hydrolase 1 FOLH1 218.5 0.031
NM_004616 transmembrane 4 superfamily member 3 TM4SF3 210.8 0.005
Transcription regulation
NM_014682 suppression of tumorigenicity 18 ST18 230 0.028
NM_014717 zinc finger protein 536 ZNF536 216.3 0.03
NM_013279 chromosome 11 open reading frame 9 C11orf9 210.7 0.017
Cytoskeleton organization
AU157109 KIAA1598 protein KIAA1598 214.8 0.048
AW242297 microtubule-associated protein 7 MAP7 213.2 0.037
Other processes
AA191573 synaptojanin 2 SYNJ2 235.4 0.022
AB032981 PAIP2B HGNC binding protein interacting protein 2B PAIP2B 227 0.047
AB007880 KIAA0420 gene product KIAA0420 222.5 0.039
AI803302 LIM domain binding 3 LDB3 220.4 0.028
U56725 Human heat shock protein mRNA, HSPA2 220 0.038
BC003169 calpain 3, (p94) CAPN3 218.2 0.027
NM_000954 prostaglandin D2 synthase 21 kDa (brain) PTGDS 217.6 0.026
Glostrup, Denmark) antibodies or with a polyclonal anti-human TAZ antibody (1:60; LifeSpan Biosciences, Seattle, WA, USA) overnight at 4uC. Subsequently, slides were incubated with a HRP/Fab polymer conjugate (SuperPicTure Polymer Detection Kit, Invitrogen, Camarillo, CA, USA). The immunostaining for Epidermal Growth Factor Receptor (EGFR) and CD99 was performed using the monoclonal antibodies anti- human EGFR (1:100; Clone E30; Dako) and CD99 (1:100; clone 12E7; Dako) on an autostainer (Dako Autostainer Plus Link, Dako). The antigen retrieval was performed using pronase digestion (ProTaqsH Pronase Digest, Germany) and En VisionTM Flex Target Retrieval Solution High pH (Dako) for EGFR and CD99, respectively.
Immunopositive cells were visualized by brown DAB (Vector Laboratories, Inc., Burlingame, CA, USA) staining. The nuclei were lightly counterstained with Mayer’s hematoxylin.
Tonsil sections were used as positive controls for EGFR and CD99 expression.
For CD133 immunofluorescence analysis on ET and BAT, the sections were incubated for 12 h at 4uC with the polyclonal anti-human CD133 (1:50; Spring Bioscience, CA, USA) and were then treated with the secondary antibody (goat anti-rabbit Alexa Fluor 488; 1:200; Invitrogen) for 1 h at room temperature (RT).
For double-labeling immunofluorescence analysis, histological sections were incubated for 20 h at 4uC with the anti-GFAP and TAZ antibodies as described above. The next day, the slides were incubated with a mixture of the following secondary antibodies: goat anti-rabbit Alexa Fluor 488 (1:250; Invitrogen) and red fluorescent cyanine donkey anti-mouse Cy3 (1:200; Jackson Immunoresearch Laboratories) for 2 h at RT. The sections were coverslipped with Vectashield Mounting Medium with DAPI (Vector Laboratories) and examined with a confocal laser scanning system (TCS-SP2, Leica Microsystems, GmbH, Wetzlar, Germany) equipped with an Ar/ArKr laser and a HeNe laser for 488 nm and 543 nm excitation, respectively. For each analyzed field, Z-stack series of 4–5mm-thick were acquired as images (102461024 pixels), recorded at intervals Table 2. Cont.
Genebank Description Symbol FC Corrected p-value
NM_022126 phospholysine phosphohistidine inorganic pyrophosphate phosphatase LHPP 213 0.041
AF318616 synaptojanin 2 SYNJ2 212 0.027
NM_014210 ecotropic viral integration site 2A EVI2A 211.7 0.039
NM_024897 progestin and adipoQ receptor family member VI PAQR6 211 0.002
NM_003657 breast carcinoma amplified sequence 1 BCAS1 210.6 0.015
Genes over-expressed in ET compared to BAT Immune system
NM_002852 pentaxin-related gene, rapidly induced by IL-1 beta PTX3 18.2 0.028
NM_012072 complement component 1,q subcomponent, receptor 1 C1QR1 16.2 0.039
Extracellular matrix formation
NM_000089 collagen, type I, alpha 2 COL1A2 26.8 0.014
X05610 collagen, type IV, alpha 2 COL4A2 13.9 0.017
K01228 collagen, type I, alpha 1 COL1A1 13.0 0.018
NM_001845 collagen, type IV, alpha 1 COL4A1 11.8 0.014
NM_000900 matrix Gla protein MGP 10.4 0.002
X02761 fibronectin 1 FN1 10.2 0.03
AF130082 collagen, type III, alpha 1 COL3A1 10.0 0.008
Angiogenesis
AF022375 vascular endothelial growth factor VEGF 16.0 0.032
NM_001147 angiopoietin 2 ANGPT2 10.4 0.004
Cell cycle
NM_001827 CDC28 protein kinase regulatory subunit 2 CKS2 12.6 0.017
Cell growth & proliferation
NM_000597 insulin-like growth factor binding protein 2, 36 kDa IGFBP2 35.8 0.017
NM_003254 tissue inhibitor of metalloproteinase 1 TIMP1 16.6 0.037
NM_002045 growth associated protein 43 GAP43 12.9 0.039
Other processes
NM_000358 transforming growth factor, beta-induced, 68 kDa TGFBI 26.6 0.026
BC001886 ribonucleotide reductase M2 polypeptide RRM2 21.1 0.022
NM_014736 KIAA0101 gene product KIAA0101 13.3 0.046
BG435404 ADP-ribosylation factor-like 7 ARL7 10.7 0.006
AI082078 actinin, alpha 1 ACTN1 10.2 0.015
of 0.20mm, and then projection images were created and processed using the Leica software. MDA-MB-231, a breast cancer cell line expressing moderate TAZ levels, was used as positive control for TAZ expression [13]. In each experiment, negative controls without the primary antibody were included to check for nonspecific staining.
Results Histopathology
The CTRL samples displayed a variable degree of gliosis due to bleeding of the cavernomas and subsequent edema, as it was indicated by the presence of GFAP-reactive astrocytes, with a
characteristic dendritic morphology and abundant eosinophilic cytoplasm and with large eccentric nuclei (data not shown). The number of Ki67/MIB1 positive cells was lower than 1% (data not shown).
In the ET samples, the number of Ki67/MIB1 positive cells varied between 10% and 60% (data not shown).
Microarray Analysis
Genome-wide expression profiles of 5 ET samples, 7 BAT samples from 5 patients, and 4 CTRL white matter biopsies were analysed. The representation of the samples in a three-dimensional (3D) space clearly distinguished 3 groups corresponding to the 3
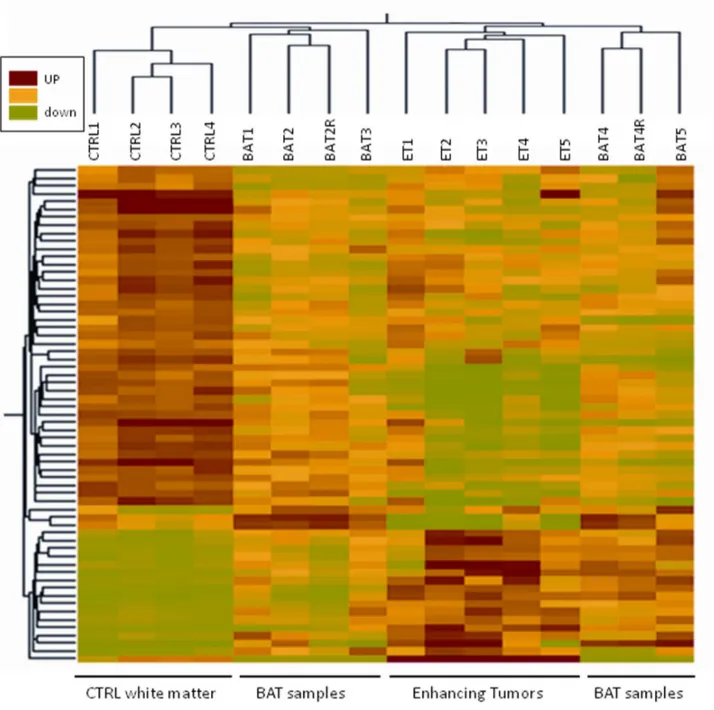
Figure 3. Hierarchical cluster analysis. Hierarchical cluster analysis based on expression of 63 transcripts (57 genes) that differed between BAT and CTRL samples (P,0.05) and had greater than 2-fold change between the means of the two tissue types. Each row represents a specific transcript; each column represents a tissue sample harvested from independent patients (R:technical replicate).
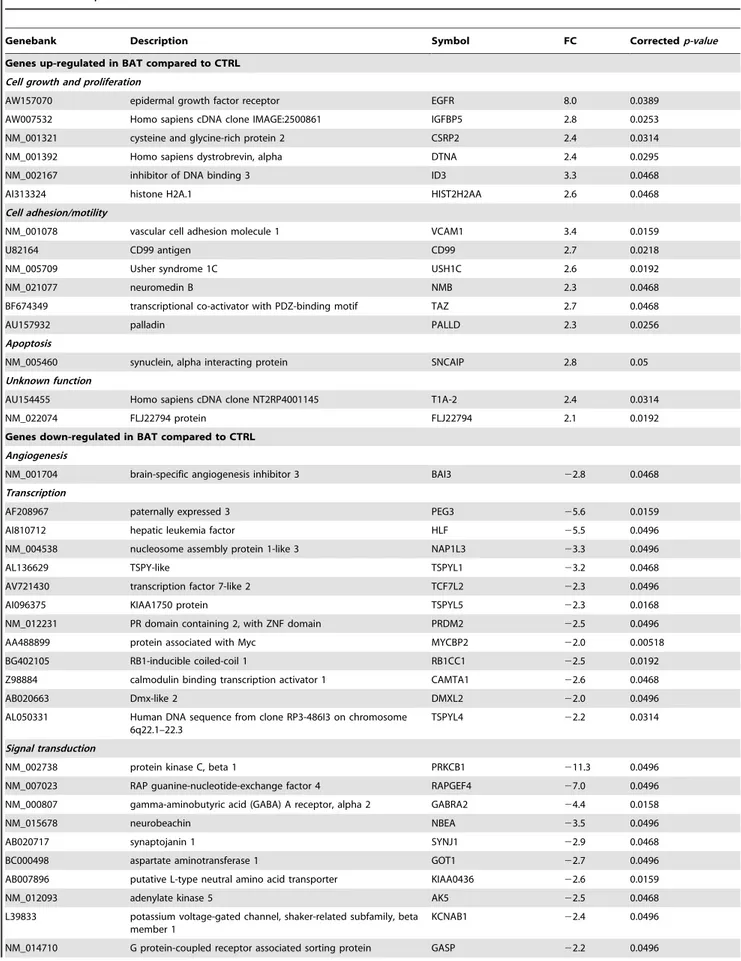
Table 3. Selection of the genes significantly different between BAT samples and control white matter samples, with a 2-fold difference in expression levels.
Genebank Description Symbol FC Correctedp-value
Genes up-regulated in BAT compared to CTRL Cell growth and proliferation
AW157070 epidermal growth factor receptor EGFR 8.0 0.0389
AW007532 Homo sapiens cDNA clone IMAGE:2500861 IGFBP5 2.8 0.0253
NM_001321 cysteine and glycine-rich protein 2 CSRP2 2.4 0.0314
NM_001392 Homo sapiens dystrobrevin, alpha DTNA 2.4 0.0295
NM_002167 inhibitor of DNA binding 3 ID3 3.3 0.0468
AI313324 histone H2A.1 HIST2H2AA 2.6 0.0468
Cell adhesion/motility
NM_001078 vascular cell adhesion molecule 1 VCAM1 3.4 0.0159
U82164 CD99 antigen CD99 2.7 0.0218
NM_005709 Usher syndrome 1C USH1C 2.6 0.0192
NM_021077 neuromedin B NMB 2.3 0.0468
BF674349 transcriptional co-activator with PDZ-binding motif TAZ 2.7 0.0468
AU157932 palladin PALLD 2.3 0.0256
Apoptosis
NM_005460 synuclein, alpha interacting protein SNCAIP 2.8 0.05
Unknown function
AU154455 Homo sapiens cDNA clone NT2RP4001145 T1A-2 2.4 0.0314
NM_022074 FLJ22794 protein FLJ22794 2.1 0.0192
Genes down-regulated in BAT compared to CTRL Angiogenesis
NM_001704 brain-specific angiogenesis inhibitor 3 BAI3 22.8 0.0468
Transcription
AF208967 paternally expressed 3 PEG3 25.6 0.0159
AI810712 hepatic leukemia factor HLF 25.5 0.0496
NM_004538 nucleosome assembly protein 1-like 3 NAP1L3 23.3 0.0496
AL136629 TSPY-like TSPYL1 23.2 0.0468
AV721430 transcription factor 7-like 2 TCF7L2 22.3 0.0496
AI096375 KIAA1750 protein TSPYL5 22.3 0.0168
NM_012231 PR domain containing 2, with ZNF domain PRDM2 22.5 0.0496
AA488899 protein associated with Myc MYCBP2 22.0 0.00518
BG402105 RB1-inducible coiled-coil 1 RB1CC1 22.5 0.0192
Z98884 calmodulin binding transcription activator 1 CAMTA1 22.6 0.0468
AB020663 Dmx-like 2 DMXL2 22.0 0.0496
AL050331 Human DNA sequence from clone RP3-486I3 on chromosome
6q22.1–22.3
TSPYL4 22.2 0.0314
Signal transduction
NM_002738 protein kinase C, beta 1 PRKCB1 211.3 0.0496
NM_007023 RAP guanine-nucleotide-exchange factor 4 RAPGEF4 27.0 0.0496
NM_000807 gamma-aminobutyric acid (GABA) A receptor, alpha 2 GABRA2 24.4 0.0158
NM_015678 neurobeachin NBEA 23.5 0.0496
AB020717 synaptojanin 1 SYNJ1 22.9 0.0468
BC000498 aspartate aminotransferase 1 GOT1 22.7 0.0496
AB007896 putative L-type neutral amino acid transporter KIAA0436 22.6 0.0159
NM_012093 adenylate kinase 5 AK5 22.5 0.0468
L39833 potassium voltage-gated channel, shaker-related subfamily, beta
member 1
KCNAB1 22.4 0.0496
tissues (Figure 2). The CTRL and BAT samples were pooled in 2 distinct groups.
Differential Gene Expression between ET and BAT
Molecular analysis of ET and BAT samples showed significant changes in the expression of 1,323 genes. Genes with at least 10-fold difference in the expression level were further analyzed (Table 2). Twenty genes were over-expressed in ET when compared to BAT, while 45 genes were down-regulated. The expression of the angiogenesis-related genes VEGF and ANGPT2 was increased in ET. Genes associated with cell growth (IGFBP2, GAP43), along with the cell cycle activator CKS2, were over-expressed. Most of the highly up-regulated genes encoded proteins associated with the extracellular matrix formation, including COL4A1, COL4A2, COL1A1, COL3A1, COL1A2. The 45 genes showing significantly decreased expression in ET were more heterogeneous with respect to the functions of their gene products. The majority of these genes were involved in the development of the nervous system (MOG, RAPGEF5, GRM3, SH3GL3, NINJ2, UGT8, MOBP, MBP).
Differential Gene Expression between BAT and CTRL
Statistical analysis associated with a threshold approach (cut-off: 2) resulted in 57 genes showing significantly different expression in BAT and CTRL. This dataset was submitted to hierarchical
clustering to determine the gene expression pattern in all tissue types, including also ET specimens (Figure 3).
Molecular profiling showed 15 genes over-expressed and 42 genes down-regulated in BAT (Table 3). Genes belonging to 2 main relevant biological processes were particularly deregulated in BAT. In fact, genes associated with growth and proliferation (CSRP2, TAZ, ID3, DTNA) and cell motility/adhesion (HIST2H2AA, EGFR, IGFBP5, VCAM1, CD99) were up-regulated while genes involved in neurogenesis (SYNJ1, NBEA, SERPINI1, CNTNAP2, RELN) were largely down-regulated in BAT. Several tumour suppressor genes (BAI3, PEG3, PRDM2, RB1CC1) along with the natural killer receptor KLRC1 were also down regulated in BAT.
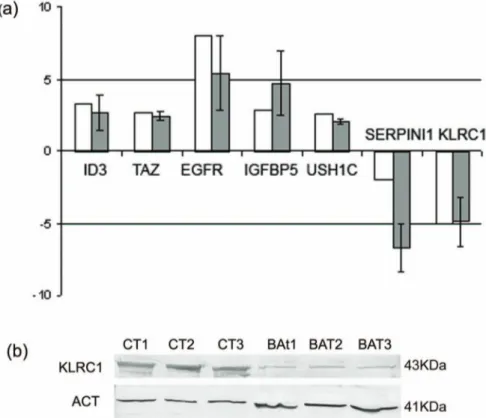
Validation of Gene Expression by RT-PCR
A subset of 7 genes was selected for further analysis by qPCR (Figure 4a). The 22DDCt method was used to calculate fold changes in the expression levels of the selected genes in the comparison BAT vs CTRL samples. The qPCR results showed that the expression levels of ID3, TAZ, EGFR, IGFBP5, USH1C were increased in BAT samples, while the expression of SERPINI1 and KLRC1 was decreased. These results supported the validity of microarray results. KLRC1 was selected to assess differences in protein levels between BAT and CTRL samples by the means of western blot analysis (Figure 4b). KLRC1 was detected in all Table 3. Cont.
Genebank Description Symbol FC Correctedp-value
NM_014247 Rap guanine nucleotide exchange factor 2 RAPGEF2 22.1 0.0131
AF052117 chloride channel 4 CLCN4 22.1 0.0468
AB002390 lysosomal apyrase-like 1 LYSAL1 22.0 0.0302
Extracellular matrix remodelling
NM_000202 iduronate 2-sulfatase IDS 23.0 0.0496
AU144167 collagen, type III, alpha 1 COL3A1 22.7 0.0468
Growth
NM_020988 guanine nucleotide binding protein alpha activating activity
polypeptide O
GNAO1 22.1 0.0192
NM_000345 synuclein, alpha SNCA 22.1 0.0496
NM_005025 serine proteinase inhibitor SERPINI1 22.0 0.0192
Adhesion
AW190070 ATPase, Ca++ transporting, cardiac muscle, slow twitch 2 ATP2A2 22.5 0.0496
AU144598 contactin associated protein-like 2 CNTNAP2 22.4 0.0453
NM_005045 reelin RELN 22.2 0.035
Cytoskeleton
AB011133 microtubule associated serine/threonine kinase 3 MAST3 22.2 0.0158
Defense
NM_002260 killer cell lectin-like receptor subfamily C, member 1 KLRC1 25.0 0.0125
Ubiquitin cycle
AV726900 Ring finger protein 20 RNF20 22.5 0.00518
AL031178 F-box protein 9 FBXO9 22.2 0.0496
NM_018422 pleckstrin and Sec7 domain containing 3 PSD3 22.5 0.0314
Unknown
AL050136 Homo sapiens mRNA; cDNA DKFZp586L141 22.2 0.0352
NM_014951 Zinc finger protein 365 ZNF365 22.4 0.0192
AF063591 CD200 molecule CD200 22.2 0.0159
CTRL specimens, while a very weak signal was detectable in the BAT samples.
Array CGH
A large number of mosaic genomic lesions were detected by aCGH in tumor samples. Some of these alterations, such as del (1p36), del (2p21), +7, del (6q27q29)/26, EGFR (7p11.2), MDM2 (12q15) and CDK4 (12q14.3) amplification, 210, amplification of 15q24.1, del (17p13)/217, 219, 222 were known to be associated with glioblastomas [14,15].
Several tumor-associated lesions were also present in the BAT. Shared anomalies with ET were del(1p36), del(2p21), MDM2 and CDK4 amplification, amplification of 15q24.1, 219 and 222. The genetic changes of +7, del(6q27q29), EGFR amplification, 210, del (17p13) were limited to the ET. The summary of these results is shown in Table 4.
Immunohistology
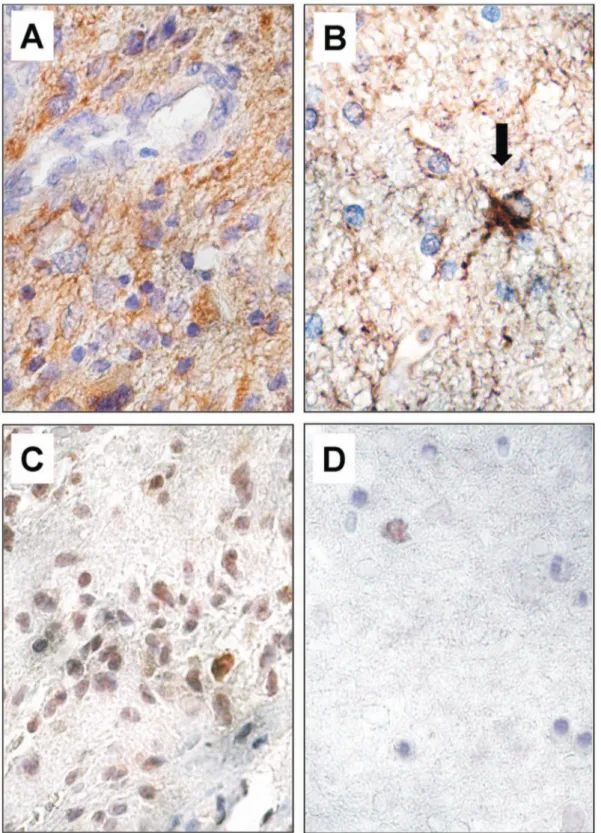
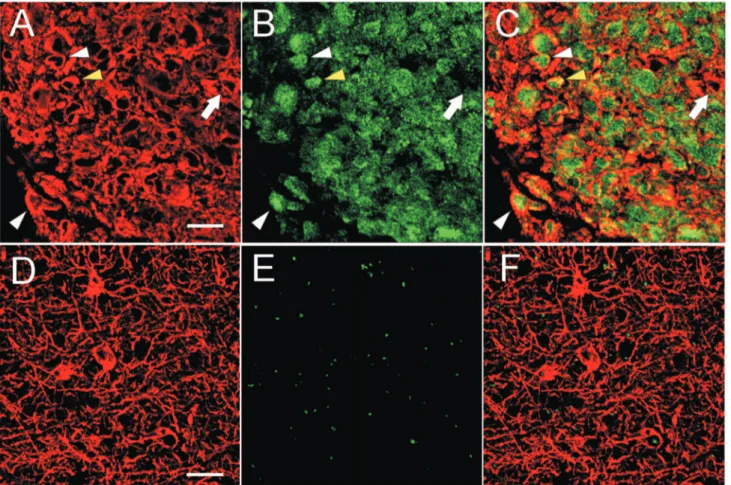
TAZ expression was found in the majority of GBM cells, predominantly in the cell nuclei (Figure 5C). Double-labelled ET samples revealed GFAP and TAZ co-expression when analyzed by confocal microscopy (Figure 6A–C). The majority of neoplastic cells expressed TAZ in the nucleus, and only few cells showed a cytoplasmatic staining (Figure 6B, C). As expected, GFAP was highly expressed in the cytoplasm of tumor cells (Figure 5A; Figure 6A, C). In ET samples, as expected, the majority of tumor cells exhibited strong specific EGFR immunopositivity (Figure 7A).
The reactivity was strong on the cell membrane and less intense in the cytoplasm of the tumor cells. The same expression pattern was found for CD99 in the GBM cells (Figure 7D).
In BAT, GFAP immunostaining was displayed in both apparently normal and reactive astrocytes (Figure 1C; Figure 5B). The frequency of Ki67/MIB1 positive cells was always lower than 1% (Figure 1D). TAZ immunopositive nuclei were extremely rare (Figure 5D). Confocal microscopy of BAT samples confirmed that expression of TAZ was rarely seen in peritumoral tissue samples (Figure 6E, F), while apparently normal and reactive astrocytes were positive for GFAP staining (Figure 6D, F). In BAT, the EGFR immunopositivity was observed in reactive astrocytes (Figure 7B) as well as for CD99 that was also expressed in some normal cells (Figure 7E). The mean percentage of EGFR- and CD99-positive cells was higher in BAT (10.162.6 for EGFR and 11.562.8 for CD99) with respect to CTRL (3.260.1 and 2.760.2 for EGFR and CD199, respectively; Figure 7C, F).
In ET samples, CD133 cytoplasmic immunopositivity, visual-ized by immunofluorescence microscopy,was found in a moderate number of tumor cells (Figure 8 A). In BAT, the same pattern of reactivity was observed in a low percentage (1.960.3) of reactive astrocytes and apparently normal cells (Figure 8 B). A very low value (0.0660.1) of CD133-positive cells was displayed in CTRL samples (Figure 8C).
Figure 4. Validation of gene-expression. (a) qPCR validation of a subset of genes differentially expressed between BAT and CTRL. White bars represent the fold change in the expression level between BAT and CTRL as indicated by microarray analysis, while grey bars represent the mean fold change of gene expression calculated by qPCR method. The expression of each gene was normalized to that of 18S ribosomal RNA in the same sample and fold change represents the mean signal of 5 independent samples. Each grey bar is the mean 6 SEM of duplicate determinations for each gene in biological replicates. P-values (t-test) for ID3, TAZ, EGFR, IGFBP5, USH1C, SERPINI1, KLRC1 were 0.043; 0.12; 0.09; 0.02; 0.005; 0.0004; 0.003; respectively. (b) KLRC1 western blot analysis in BAT and CTRL white matter samples. b-actin protein level was used as an endogenous control for loading.
Table 4. Consistent anomalies observed in ET and BAT by a-CGH. Consistent anomalies ET1 BAT1 ET2 BAT2 ET3 BAT3 del (1p36) + [27645717–2925969 6 ] (40%) + [27645717–2925969 6 ] (45%) + [5997076–55676921] (50%) 2 + [1009416–46806902] (40%) + [1009416–468 06902] (45%) del (2p21) 2222 + [47450573–47510722] (64%) + [46985724–47 510722] (70%) + 7 22 + 2 + 2 del (6q27q29)/ 2 6 + Complete monosomy (34%) 222 + [163542007–166844004] (52%) 2 amp EGFR (7p11.2) 22 + [54571903–55349837] 22 2 2 10 22 + (60%) 2 + (80%) 2 amp CDK4 (12q14.3) + [64510897–6458984 6 ] + [64510897–6458984 6 ] 22 2 2 amp MDM2 (12q15) + [67369376–6834840 2 ] + [67369376–6834840 2 ] 22 2 2 amp 1 5q24.1 + * [70483070–7140170 5 ] + [70764425–7125599 7 ] 22 2 2 del (17p13)(p53)/ 2 17 + [505704– 40281123] (17%) 2 + Complete monosomy (20%) 2 + Complete monosomy (40%) 2 2 19 + (30%) 2 + (19%) 22 + (15%) 2 22 + (38%) 2 + (23%) 2 + (23%) + (20%) *further amplification in ET, w ith respect to BAT. In bold: anomalies limited to ETs. In square bracket: genomic positions (according to NCBI 36 build) o f the observed anomalies. In round brackets: mosaicism degree of the observed anomaly. The p ercentage o f a bnormal cells was inferred using the formula p roposed b y Valli et al. T hat formula cannot be applied to the amplified segments (EGFR, CDK4, MDM2 and 15q24.1) since their ploidy status is unknown. doi:10.1371/jou rnal.pone.0057145.t004
Figure 5. Immunohistochemical staining for GFAP and TAZ in ET and BAT. The majority of GBM cells showed intense diffuse cytoplasmic staining for GFAP (A). In the BAT, only apparently normal and reactive astrocytes (black arrow) expressed GFAP protein (B). TAZ immunoreactivity, mainly nuclear, was uniformly expressed in the cells of the ET (C). In the BAT, TAZ positive cells were observed very infrequently (D). Original magnification, 6630 (A–D). Hematoxylin counterstain.
Figure 6. Confocal microscopy images of GFAP (red) and TAZ (green) expression in ET and BAT. In the ET samples, GFAP was highly expressed in the cytoplasm of neoplastic cells (A; C). In the BAT, it was present in the body and cytoplasmic extensions of astrocytes (D; F). In the ET, TAZ was expressed predominantly in the nucleus (white arrowheads) and few cells also showed a cytoplasmic localization (yellow arrowhead) (B; C). Rarely, the GBM cells were negative for TAZ (arrow) (B; C). In the BAT, TAZ was almost undetectable. In the photograph shown, no expression of TAZ was observed (E; F). Scale bar: 20 mm.
doi:10.1371/journal.pone.0057145.g006
Figure 7. Immunohistochemical staining for EGFR and CD99 in ET, BAT and CTRL. In the ET samples, tumor cells showed intense staining for EGFR, mainly n the cell membrane (A). In the BAT, black arrow points to EGFR immunopositive reactive astrocytes (B). In the ET, CD99-immunoreactivity can be observed at the membrane level and in the cytoplasm (D). In the BAT, CD99 immunopositivity was found in reactive astrocytes (black arrow), in some normal glial cells (black arrowhead) (E). In the CTRL, immunoreactivity for EGFR or CD99 was rarely observed (C; F). Original magnification: x630 (A-B, D-E), x200 (C; F). Hematoxylin counterstain.
Discussion
Few information is available about the peritumoral tissue sampled at least one cm from the macroscopic tumor border. By comparing the expression pattern of CTRL and BAT, we separated 57 genes which were differentially expressed in BAT against CTRL. These genes were also highly expressed in GBM suggesting that GBM and morphologically normal appearing BAT share a similar expression profile. In our study, the EGFR expression levels showed the largest difference between CTRL and BAT, being highly expressed in the latter. The EGFR gene is the most frequently amplified proto-oncogene in primary glioblastomas [16]. Another growth factor receptor, NMB, was also overexpressed in BAT. We also found in BAT an up-regulation of IGFBP5, histone HIST2H2AA and transcription regulator ID3. All these elements are involved in proliferation and tumor progression [17,18,19].
In BAT, we also detected an over-expression of genes involved in cell motility, such as palladin, alpha-dystrobrevin (DTNA), CD99 and VCAM-1 [17,20,21,22,23,24]. We also found the over-expression of the transcription regulator TAZ in BAT. This molecule controls the expression of genes regulating cell migration and proliferation [13,25]. TAZ association with mesenchymal (MES) gene expression signature of glioblastoma, resulting in poor overall survival and treatment resistance has recently been emphasized [26].
The set of genes showing reduced expression in BAT included several ones previously described for their anti-oncogenic role, controlling intracellular signalling cascade and transcription molecular functions. Among these, the expression of BAI3, PEG3, SNCA has already been reported to be absent or significantly decreased in GBM and glioma cells [27,28,29].
Several genes down-regulated in BAT such as PRDM2, TCF7L2, RB1CC1, ATP2A2 are involved in the pathogenesis of other type of cancers, but not in gliomas [30,31,32,33,34,35]. Interestingly, SYNJ1, NBEA, SERPINI1, CNTNAP2 and RELN, which are known to be involved in neurogenesis, were down-regulated in BAT [36,37,38,39,40].
KLRC1, an inhibitory receptor for the non-classical MHC class I molecule HLA-E, has been involved in the inhibition of innate anti-glioma immune responses [41]. In our study, we reported the strong down-regulation of KLRC1 in BAT samples, both at transcriptional and protein level. This finding suggests that an inhibition of a proper immune response may exist. A big limitation of this study is that the ‘‘normal’’ white matter control samples did not come from the same patients bearing the glioblastoma, but from different patients operated for non-neoplastic lesions. The ideal would have been that the white matter controls came from the same patient but very far from the tumor (possibly in the other hemisphere). Obviously, this is not possible in vivo, due to ethical problems, and is not feasible post mortem, because at that point, the spread of the disease possibly involves multiple areas of the brain [42].
The differences between CTRL and BAT and the similarity of gene expression of BAT and GBM could be explained by the presence of infiltrative tumor cells that we were not able to detect at histological analysis. On this way, we performed the aCGH, a technique which is able to detect chromosome alterations only if these are present in a high percentage of cells. By comparing individual ET and BAT, we observed that BAT of two patients (BAT1 and BAT3) showed that almost all cells displayed anomalies consistently associated with GBM, but none of the cells of BAT2 displayed chromosomic anomalies known to be associated with GBM, even in the presence of several dysregulated
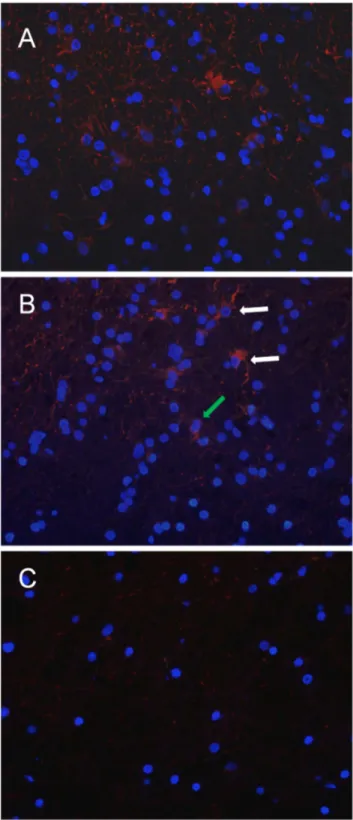
Figure 8. Immunofluorescence of CD133 expression in ET, BAT and CTRL. CD133 cytoplasmic immunopositivity (red) was observed in a moderate number of cells in the ET (A). In the BAT, the signal was present in reactive astrocytes (white arrows) and apparently normal cells (green arrow) (B). In CTRL samples, CD133-positive cells are extremely rare. In the field showed no CD133-positive cells are detected (C). Cell nuclei were marked with DAPI (blue). Original magnification: x400 (A, B, C).
genes. However, from a clinical point of view, the outcome of the patient whose BAT did not display any evident genomic change was similar to that of the other two patients. Obviously, in view of the small number of patients in the study, no conclusions on the relationship between genomic alterations of the BAT and survival can be drawn.
Overall, data interpretation is not easy. We can exclude that the differences in genes expression between CTRL and BAT reflect reactive changes as we have found the same level of gliosis, as determined by the presence of GFAP positive reactive astrocytes and the poor macrophages infiltration (data not shown). Undoubtedly, peritumor tissue sampled at 1 cm or more from the macroscopic tumor border presents frank gene/chromosome alterations. Some of these alterations were also present at the protein level, as shown by immunohistological analysis.
As a matter of fact, the mean percentage of EGFR- and CD99-positive cells in BAT was higher than 10%, while CD133 cytoplasmic immunopositivity was observed in a very low percentage (less than 2%) of reactive astrocytes and apparently normal cells. As CD133 is a marker of brain cancer stem cells, our data revealed that the amount of possible CD133 positive cancer stem cells was low in the BAT. Nonetheless, considerable experimental evidence for the existence of both CD133 positive and CD133 negative populations as tumor-initiating cells exists [43]. Therefore, we may have missed some putative cancer cells. Undoubtedly, the array-based gene expression profile could result from a minority of cells, but this condition is in contrast with the array CGH results, showing chromosomal aberrations in the vast majority of cells.
On the other hand, the correlation between gene overexpres-sion and encoded protein levels can also be weak.
All our experiments suggest that several tumor-like alterations are detectable in the BAT. Nevertheless, question remains about the nature of the cells populating the peritumour tissue. Two main hypotheses may support these findings and these hypotheses are not mutually exclusive. Our data could be explained by a dilution of genes expressed from tumor cells infiltrating the BAT samples: in fact the genes overexpressed in BAT against CTRL were also over-expressed in GBM but with a higher fold change. In fact, histological analysis may have missed the presence of some infiltrative tumor cells in the BAT. These cells could also be histologically undetectable, ‘‘dormant’’ infiltrating cells. [44].
A possible role of cancer stem cells in determining genetic changes in the BAT is difficult to sustain, since we observed few CD133 positive cells in this area, but we may have missed CD133 negative cancer stem cells.
Alternatively, these findings could be supported by a relevant amount of cells that present a gene profile compatible with a precancerous state. The aCGH data seem to be in favour of this hypothesis. Of course, the truth may lie somewhere in between, and the recurrent tumor may arise from both infiltrating tumor cells (including histologically undetectable tumor cells, ‘‘dormant’’ tumor cells and possibly cancer stem cells) and from an interaction and recruitment of apparently normal cells in the peritumor tissue by infiltrating tumor cells. If the latter two hypotheses are true, our observations could reflect a change of the BAT, which may progress to tumor by acquiring genomic alterations characteristic of GBM. Some changes might be induced by the cross-talk between tumor cells and normal cells. A possible mechanism of this phenomenon can be explained through the transporting of microvesicles containing RNA and a number of mRNA transcripts, which may lead to induction of oncogenic processes in peritumoral normal cells [45]. BAT may also bear traces of the tumor microenvironment in the form of microvescicles or exosomes transporting tumor mRNA or even genomic DNA, which could also partially explain our findings.
Whatever the correct explanation of our findings, further studies on the BAT are needed, in order to identify possible targets for future treatments.
Acknowledgments
We wish to acknowledge Dr Roberto Piacentini, PhD, Institute of Human Physiology, Daniele Petricca, Institute of Neurosurgery, Dr Filippo Biamonte, PhD, Institute of Histology and Embryology of the Catholic University for their precious help in obtaining and preparing Figures.
Author Contributions
Conceived and designed the experiments: AM NS PDB BLP DO MZ CA. Performed the experiments: NS G. Sica GL DO MZ BLP GP AC LL. Analyzed the data: AM NS PDB BLP DO MZ G. Sica G. Sabatino GL GP CA AC. Contributed reagents/materials/analysis tools: AM NS DO MZ G. Sica GL GP AC LL. Wrote the paper: PDB AM NS G. Sica GL DO G. Sabatino MZ GK GM.
References
1. Stupp R, Mason WP, van den Bent MJ, Weller M, Fisher B, et al. (2005) Radiotherapy plus concomitant and adjuvant temozolomide for glioblastoma. N Engl J Med 352: 987–996.
2. Bai RY, Staedtke V, Riggins GJ (2011) Molecular targeting of glioblastoma: Drug discovery and therapies. Trends Mol Med 17: 301–312.
3. Mangiola A, de Bonis P, Maira G, Balducci M, Sica G, et al. (2008) Invasive tumor cells and prognosis in a selected population of patients with glioblastoma multiforme. Cancer 113: 841–846.
4. Bakshi A, Nag TC, Wadhwa S, Mahapatra AK, Sarkar C (1998) The expression of nitric oxide synthases in human brain tumours and peritumoral areas. J Neurol Sci 155: 196–203.
5. De Micheli E, Alfieri A, Pinna G, Bianchi L, Colivicchi MA, et al. (2000) Extracellular levels of taurine in tumoral, peritumoral and normal brain tissue in patients with malignant glioma: an intraoperative microdialysis study. Adv Exp Med Biol 483: 621–625.
6. Dehnhardt M, Zoriy MV, Khan Z, Reifenberger G, Ekstrom TJ, et al. (2008) Element distribution is altered in a zone surrounding human glioblastoma multiforme. J Trace Elem Med Biol 22: 17–23.
7. Stevenson CB, Ehtesham M, McMillan KM, Valadez JG, Edgeworth ML, et al. (2008) CXCR4 expression is elevated in glioblastoma multiforme and correlates with an increase in intensity and extent of peritumoral T2-weighted magnetic resonance imaging signal abnormalities. Neurosurgery 63: 560–569; discussion 569–570.
8. Nowacki P, Kojder I (2001) Peritumoral angiogenesis around primary and metastatic brain neoplasms. Morphometric analysis. Folia Neuropathol 39: 95– 102.
9. Lama G, Mangiola A, Anile C, Sabatino G, De Bonis P, et al. (2007) Activated ERK1/2 expression in glioblastoma multiforme and in peritumor tissue. Int J Oncol 30: 1333–1342.
10. Mangiola A, Lama G, Giannitelli C, De Bonis P, Anile C, et al. (2007) Stem cell marker nestin and c-Jun NH2-terminal kinases in tumor and peritumor areas of glioblastoma multiforme: possible prognostic implications. Clin Cancer Res 13: 6970–6977.
11. Sica G, Lama G, Anile C, Geloso MC, La Torre G, et al. (2011) Assessment of angiogenesis by CD105 and nestin expression in peritumor tissue of glioblastoma. Int J Oncol 38: 41–49.
12. Valli R, Maserati E, Marletta C, Pressato B, Lo Curto F, et al. (2011) Evaluating chromosomal mosaicism by array comparative genomic hybridization in hematological malignancies: the proposal of a formula. Cancer Genet 204: 216–218.
13. Chan SW, Lim CJ, Guo K, Ng CP, Lee I, et al. (2008) A role for TAZ in migration, invasion, and tumorigenesis of breast cancer cells. Cancer Res 68: 2592–2598.
14. Dahlback HS, Brandal P, Meling TR, Gorunova L, Scheie D, et al. (2009) Genomic aberrations in 80 cases of primary glioblastoma multiforme: Pathogenetic heterogeneity and putative cytogenetic pathways. Genes Chromo-somes Cancer 48: 908–924.
15. Rao SK, Edwards J, Joshi AD, Siu IM, Riggins GJ (2010) A survey of glioblastoma genomic amplifications and deletions. J Neurooncol 96: 169–179. 16. Hoi Sang U, Espiritu OD, Kelley PY, Klauber MR, Hatton JD (1995) The role of the epidermal growth factor receptor in human gliomas: II. The control of glial process extension and the expression of glial fibrillary acidic protein. J Neurosurg 82: 847–857.
17. Wang H, Zhang W, Fuller GN (2006) Overexpression of IGFBP5, but not IGFBP3, correlates with the histologic grade of human diffuse glioma: a tissue microarray and immunohistochemical study. Technol Cancer Res Treat 5: 195– 199.
18. Tzeng SF, Bresnahan JC, Beattie MS, de Vellis J (2001) Upregulation of the HLH Id gene family in neural progenitors and glial cells of the rat spinal cord following contusion injury. J Neurosci Res 66: 1161–1172.
19. Vandeputte DA, Troost D, Leenstra S, Ijlst-Keizers H, Ramkema M, et al. (2002) Expression and distribution of id helix-loop-helix proteins in human astrocytic tumors. Glia 38: 329–338.
20. Boon K, Edwards JB, Eberhart CG, Riggins GJ (2004) Identification of astrocytoma associated genes including cell surface markers. BMC Cancer 4: 39. 21. Lee JH, Kim SH, Wang LH, Choi YL, Kim YC, et al. (2007) Clinical significance of CD99 down-regulation in gastric adenocarcinoma. Clin Cancer Res 13: 2584–2591.
22. Manara MC, Bernard G, Lollini PL, Nanni P, Zuntini M, et al. (2006) CD99 acts as an oncosuppressor in osteosarcoma. Mol Biol Cell 17: 1910–1921. 23. Scotlandi K, Zuntini M, Manara MC, Sciandra M, Rocchi A, et al. (2007)
CD99 isoforms dictate opposite functions in tumour malignancy and metastases by activating or repressing c-Src kinase activity. Oncogene 26: 6604–6618. 24. Shih AH, Holland EC (2006) Notch signaling enhances nestin expression in
gliomas. Neoplasia 8: 1072–1082.
25. Zhou Z, Hao Y, Liu N, Raptis L, Tsao MS, et al. (2011) TAZ is a novel oncogene in non-small cell lung cancer. Oncogene 30: 2181–2186.
26. Bhat KP, Salazar KL, Balasubramaniyan V, Wani K, Heathcock L, et al. (2011) The transcriptional coactivator TAZ regulates mesenchymal differentiation in malignant glioma. Genes Dev 25: 2594–2609.
27. Kee HJ, Ahn KY, Choi KC, Won Song J, Heo T, et al. (2004) Expression of brain-specific angiogenesis inhibitor 3 (BAI3) in normal brain and implications for BAI3 in ischemia-induced brain angiogenesis and malignant glioma. FEBS Lett 569: 307–316.
28. Kohda T, Asai A, Kuroiwa Y, Kobayashi S, Aisaka K, et al. (2001) Tumour suppressor activity of human imprinted gene PEG3 in a glioma cell line. Genes Cells 6: 237–247.
29. Stefanova N, Schanda K, Klimaschewski L, Poewe W, Wenning GK, et al. (2003) Tumor necrosis factor-alpha-induced cell death in U373 cells overex-pressing alpha-synuclein. J Neurosci Res 73: 334–340.
30. Burwinkel B, Shanmugam KS, Hemminki K, Meindl A, Schmutzler RK, et al. (2006) Transcription factor 7-like 2 (TCF7L2) variant is associated with familial breast cancer risk: a case-control study. BMC Cancer 6: 268.
31. Endo Y, Uzawa K, Mochida Y, Shiiba M, Bukawa H, et al. (2004) Sarcoendoplasmic reticulum Ca(2+) ATPase type 2 downregulated in human oral squamous cell carcinoma. Int J Cancer 110: 225–231.
32. Folsom AR, Pankow JS, Peacock JM, Bielinski SJ, Heiss G, et al. (2008) Variation in TCF7L2 and increased risk of colon cancer: the Atherosclerosis Risk in Communities (ARIC) Study. Diabetes Care 31: 905–909.
33. Kontani K, Chano T, Ozaki Y, Tezuka N, Sawai S, et al. (2003) RB1CC1 suppresses cell cycle progression through RB1 expression in human neoplastic cells. Int J Mol Med 12: 767–769.
34. Korosec B, Glavac D, Rott T, Ravnik-Glavac M (2006) Alterations in the ATP2A2 gene in correlation with colon and lung cancer. Cancer Genet Cytogenet 171: 105–111.
35. Lal G, Padmanabha L, Smith BJ, Nicholson RM, Howe JR, et al. (2006) RIZ1 is epigenetically inactivated by promoter hypermethylation in thyroid carcinoma. Cancer 107: 2752–2759.
36. Chen PY, Chang WS, Chou RH, Lai YK, Lin SC, et al. (2007) Two non-homologous brain diseases-related genes, SERPINI1 and PDCD10, are tightly linked by an asymmetric bidirectional promoter in an evolutionarily conserved manner. BMC Mol Biol 8: 2.
37. Fatemi SH, Snow AV, Stary JM, Araghi-Niknam M, Reutiman TJ, et al. (2005) Reelin signaling is impaired in autism. Biol Psychiatry 57: 777–787. 38. Friedman JI, Vrijenhoek T, Markx S, Janssen IM, van der Vliet WA, et al.
(2008) CNTNAP2 gene dosage variation is associated with schizophrenia and epilepsy. Mol Psychiatry 13: 261–266.
39. Mani M, Lee SY, Lucast L, Cremona O, Di Paolo G, et al. (2007) The dual phosphatase activity of synaptojanin1 is required for both efficient synaptic vesicle endocytosis and reavailability at nerve terminals. Neuron 56: 1004–1018. 40. McAvoy S, Ganapathiraju SC, Ducharme-Smith AL, Pritchett JR, Kosari F, et al. (2007) Non-random inactivation of large common fragile site genes in different cancers. Cytogenet Genome Res 118: 260–269.
41. Mittelbronn M, Simon P, Loffler C, Capper D, Bunz B, et al. (2007) Elevated HLA-E levels in human glioblastomas but not in grade I to III astrocytomas correlate with infiltrating CD8+ cells. J Neuroimmunol 189: 50–58. 42. Burger PC, Dubois PJ, Schold SC Jr, Smith KR Jr, Odom GL, et al. (1983)
Computerized tomographic and pathologic studies of the untreated, quiescent, and recurrent glioblastoma multiforme. J Neurosurg 58: 159–169.
43. Donovan LK, Pilkington GJ (2012) CD133: holy of grail of neuro-oncology or promiscuous red-herring? Cell Prolif 45: 527–537.
44. Mangiola A, Anile C, Pompucci A, Capone G, Rigante L, et al. (2010) Glioblastoma therapy: going beyond Hercules Columns. Expert Rev Neurother 10: 507–514.
45. Skog J, Wurdinger T, van Rijn S, Meijer DH, Gainche L, et al. (2008) Glioblastoma microvesicles transport RNA and proteins that promote tumour growth and provide diagnostic biomarkers. Nat Cell Biol 10: 1470–1476.