R E S E A R C H A R T I C L E
Open Access
p53, cathepsin D, Bcl-2 are joint prognostic
indicators of breast cancer metastatic
spreading
Emanuela Guerra
1, Alessia Cimadamore
1, Pasquale Simeone
1, Giovanna Vacca
1, Rossano Lattanzio
1,2,
Gerardo Botti
3, Valentina Gatta
4, Marco D
’Aurora
4, Barbara Simionati
5, Mauro Piantelli
1,2and Saverio Alberti
1,6*Abstract
Background: Traditional prognostic indicators of breast cancer, i.e. lymph node diffusion, tumor size, grading and
estrogen receptor expression, are inadequate predictors of metastatic relapse. Thus, additional prognostic parameters
appear urgently needed. Individual oncogenic determinants have largely failed in this endeavour. Only a few individual
tumor growth drivers, e.g. mutated p53, Her-2, E-cadherin, Trops, did reach some prognostic/predictive power in
clinical settings. As multiple factors are required to drive solid tumor progression, clusters of such determinants were
expected to become stronger indicators of tumor aggressiveness and malignant progression than individual
parameters. To identify such prognostic clusters, we went on to coordinately analyse molecular and histopathological
determinants of tumor progression of post-menopausal breast cancers in the framework of a multi-institutional case
series/case-control study.
Methods: A multi-institutional series of 217 breast cancer cases was analyzed. Twenty six cases (12 %) showed disease
relapse during follow-up. Relapsed cases were matched with a set of control patients by tumor diameter, pathological
stage, tumor histotype, age, hormone receptors and grading. Histopathological and molecular determinants of tumor
development and aggressiveness were then analyzed in relapsed versus non-relapsed cases. Stepwise analyses and
model structure fitness assessments were carried out to identify clusters of molecular alterations with differential
impact on metastatic relapse.
Results: p53, Bcl-2 and cathepsin D were shown to be coordinately associated with unique levels of relative risk
for disease relapse. As many Ras downstream targets, among them matrix metalloproteases, are synergistically
upregulated by mutated p53, whole-exon sequence analyses were performed for TP53, Ki-RAS and Ha-RAS, and
findings were correlated with clinical phenotypes. Notably, TP53 insertion/deletion mutations were only detected
in relapsed cases. Correspondingly, Ha-RAS missense oncogenic mutations were only found in a subgroup of
relapsing tumors.
Conclusions: We have identified clusters of specific molecular alterations that greatly improve prognostic
assessment with respect to singularly-analysed indicators. The combined analysis of these multiple tumor-relapse
risk factors promises to become a powerful approach to identify patients subgroups with unfavourable disease
outcome.
(Continued on next page)
* Correspondence:[email protected]
1Unit of Cancer Pathology, CeSI-MeT, University of Chieti, Chieti, Italy 6Department of Neurosciences, Imaging and Clinical Sciences, University‘G.
D’Annunzio’, Chieti, Italy
Full list of author information is available at the end of the article
© 2016 The Author(s). Open Access This article is distributed under the terms of the Creative Commons Attribution 4.0 International License (http://creativecommons.org/licenses/by/4.0/), which permits unrestricted use, distribution, and reproduction in any medium, provided you give appropriate credit to the original author(s) and the source, provide a link to the Creative Commons license, and indicate if changes were made. The Creative Commons Public Domain Dedication waiver (http://creativecommons.org/publicdomain/zero/1.0/) applies to the data made available in this article, unless otherwise stated.
(Continued from previous page)
Keywords: Breast cancer, Metastatic relapse, Prognostic indicators, TP53, Bcl-2, Cathepsin D, RAS
Abbreviations: CI, Confidence interval; CV, Cross-validation; Fab, Fragment antigen-binding; FFPE, Formalin-fixed
paraffin-embedded; HR, Hazard ratio; IHC, Immunohistochemistry; PCR, Polymerase chain reaction; PK, Proteinase
K; PLS-DA, Partial least squares discriminant analysis; TMA, Tissue micro-array; VIP, Variable importance in the
projection
Background
Breast cancer (BC) is the most frequent malignancy in
women with 800 cases out of 100,000 people, four-times
as many as the second most frequent one, i.e. colorectal
cancer [1]. Histopathology classification of BC according
to tumor grade, stage, histotype, lymph node invasion
and hormonal receptor status [2] is broadly used to
draw correlations with survival. However, this
classifi-cation performs poorly in predicting differential
bio-logical aggressiveness of tumors with identical grade
and stage. As an example, patients with the best
prog-nosis, i.e. bearing small size tumors, expressing
estro-gen receptors and without lymph node invasion,
experience early tumor relapse in 10-20 % of the
cases [3, 4]. Cases that relapse do not detectably differ
from those that do not, as far as conventional
prog-nostic parameters are concerned.
Determinants of tumor biological history are expected
to add to traditional prognostic classification algorithms
[5, 6]. Individual oncogenic determinants, e.g. p53,
Her-2, E-cadherin, BRCA-1, Trops, have indeed been shown
to add to prognostic and predictive procedures [5, 7–
11]. However, they largely failed to outperform
trad-itional prognostic indicators.
Tumor development depends on the accumulation of
several specific genetic and epi-genetic changes [12
–14].
Thus, the analysis of individual oncogenic factors is
un-likely to suffice in defining the biological nature and
ag-gressiveness of a tumor [15]. Major control pathways or
clusters of drivers of cell growth, apoptosis or invasion
are, on the other hand, expected to associate with tumor
aggressiveness and overall malignancy much more
strongly than individual factors. In this work we went on
to test this model. Histopathology and
oncogenically-activated determinants of tumor progression of BC were
analyzed in the framework of a case-control study. The
results obtained were evaluated by means of statistical
analyses able to detect significant interactions of
bio-logical determinants connected with tumor relapse. This
showed that correlated p53, Bcl-2 and cathepsin D
spe-cifically associate with unprecedented high levels of
rela-tive risk for local invasion and metastatic relapse. As
matrix metalloproteases, which play a key role in local
invasion and distant cancer spreading, were shown to be
a transactivation target for mutant p53, in cooperation
with oncogenic Ras, exon sequence analysis was
per-formed for TP53 and RAS genes, and findings were
co-ordinately analyzed with the immunohistochemistry
(IHC) data and clinical phenotypes.
Methods
Breast cancer case series
A multi-institutional case series of BC patients was
col-lected from the National Cancer Institute of Naples,
to-gether with the University of Udine, the district hospital
of Venice and Rovigo, Italy. Two hundred and seventeen
BC patients were analyzed (Table 1). Clinical data (age,
family history, clinical stage, disease follow-up) and
con-ventional prognostic indicators (size, pathological stage,
local invasion, margin width, lymph-node invasion,
histological type, necrosis, inflammatory infiltration,
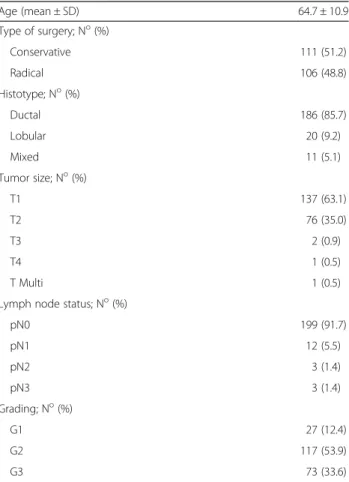
Table 1 Patient case series
Age (mean ± SD) 64.7 ± 10.9 Type of surgery; No(%) Conservative 111 (51.2) Radical 106 (48.8) Histotype; No(%) Ductal 186 (85.7) Lobular 20 (9.2) Mixed 11 (5.1) Tumor size; No(%) T1 137 (63.1) T2 76 (35.0) T3 2 (0.9) T4 1 (0.5) T Multi 1 (0.5)
Lymph node status; No(%)
pN0 199 (91.7) pN1 12 (5.5) pN2 3 (1.4) pN3 3 (1.4) Grading; No(%) G1 27 (12.4) G2 117 (53.9) G3 73 (33.6)
hormonal receptor status) were recorded [16, 17]
(Table 1). Cancer grade was determined as described
[18] (Table 1; Additional file 1: Table S1 and Additional
file 2: Table S2). Twenty six cases (12 %) showed disease
relapse during follow-up (Additional file 1: Table S1).
Relapsed cases were matched with a set of control
pa-tients by tumor diameter, pathological stage, tumor
his-totype, age, hormone receptors and grading (Additional
file 1: Table S1), and analyzed for expression of tumor
progression determinants by immuno-histochemistry
(IHC) and DNA sequencing, as indicated. To identify
patterns of aggregation of molecular alterations
associ-ated to different classes of BC prognosis, stepwise
grouping procedures were performed for model
struc-ture fitness assessment, as described.
Histopathology
Tissue micro-arrays (TMA) of tumor samples were
as-sembled as described [19, 20]. Briefly, whole-tumor
sec-tions of formalin-fixed paraffin-embedded (FFPE) BC
samples were stained with hematoxylin-eosin, and used
for guiding selection of tumor-containing areas. Three
1 mm diameter cylinders were then obtained from all
tu-mors and transferred to recipient blocks. Filled blocks
were heated for 15 min at 37 °C to induce the tumor
cores to adhere to the paraffin walls. TMA sections were
analysed by IHC for the expression of markers relevant
to tumor development and aggressiveness (Figs. 1, 2 and
3, Table 1). Briefly, 5
μm sections of BC TMA were
mounted onto Vectabond-coated slides (Vector
Labora-tory). Before staining, sections were heated at 56 °C and
dewaxed in xylene/ethanol. Endogenous peroxidase was
blocked with hydrogen peroxide in methanol.
Heat-mediated
‘antigen retrieval’ was performed by treatment
in pH 6 citrate buffer in a pressure cooker or microwave
oven, as required for each specific target. After
pre-incubation
with
appropriate
blocking
agents,
e.g.
species-matched normal serum, sections was incubated
with the primary antibody (Additional file 3: Table S3).
After washing, sections were challenged with fragment
antigen-binding (Fab)
2biotinylated secondary reagents,
followed by avidin-peroxidase and 3,3′-diaminobenzidine
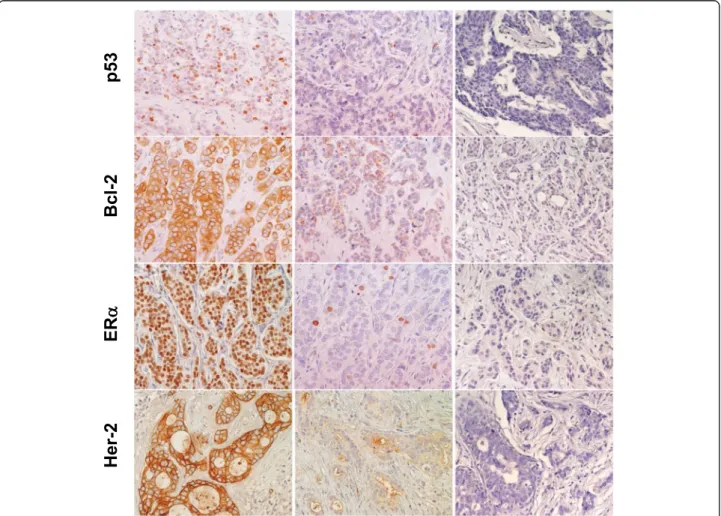
Fig. 1 Expression of p53, Bcl-2, ERα and Her-2 in BC. Representative examples of highly expressing (left column) versus negative/low cases (middle column) are shown. Negative controls are shown on the right. Nuclei were counterstained with Mayer’s hematoxylin (in blue). Original magnification: ×400
tetrachlorohydrate, activated with 0.3 % hydrogen
peroxide. Nuclei were counterstained with Mayer’s
hematoxylin. Appropriate normal mouse/rabbit
second-ary reagents or unrelated antibodies were used as
nega-tive controls. Primary antibodies directed against the
chosen targets are listed in Table 2. Immunoreactivity
for the various reagents was quantified on an average of
1000 cells in randomly chosen fields (40x objective).
Semiquantitative
scores were determined by
two
independent observers (M. P. and R. L.). Percent
ex-pression values of ER, PR and HER2 tended to
distrib-ute around discrete values (0, 10, 25, 50, 75 and 100 %
of tumor cells) and were categorized accordingly.
Per-centages of Ki-67 and p53 expressing cells were
ana-lyzed without discretization, but are reported here as
categorical variables for convenience (0, 1–10, 11–75,
76–100) [8]. Intensity scores varied between 0 and 3,
where 0 is no reactivity, 1 is borderline detectability, 3
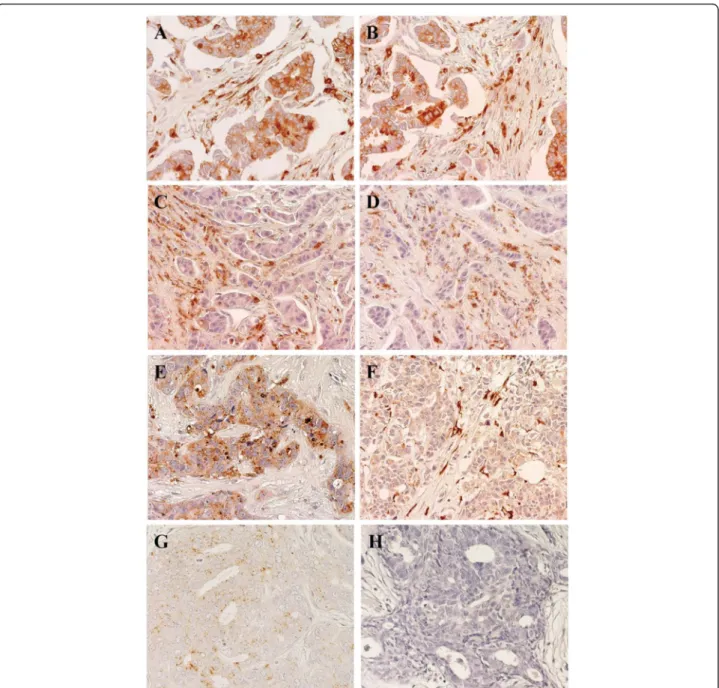
Fig. 2 Expression of cathepsin D in BC Representative examples are shown. Positive/high (left column) versus negative/low (right column) cases for expression of cathepsin D and MMP11 are indicated. Nuclei were counterstained with Mayer’s hematoxylin (in blue). a, b Tumor cases with high cathepsin D expression both in cells and in the stroma between the tumor cells. c, d Tumor cases with low/nil cathepsin D expression in cells, but with detectable expression in the tumor stroma. e Case with high cathepsin D expression in tumor cells, but no expression in the stroma. f Case with no cathepsin D expression in tumor cells, but high expression in the stroma. g Case with low/nil cathepsin D expression in both tumor cells and stroma. h Negative control for staining. Original magnification: ×400
is the maximum observed intensity and 2 corresponds
to an intermediate intensity. A combined score was
ob-tained by multiplying percentages of positive cells by
intensity. Scores were then categorized for statistical
evaluation [21].
DNA extraction
FFPE BC sections were processed as described [22, 23].
This procedure provided with relatively crude DNA
preparations, which, however, could be efficiently used
as a template in
≤150 bp-long polymerase chain reaction
(PCR) amplifications [24]. Briefly, four 5
μm tumor
sec-tions were deparaffinized by two extracsec-tions with either
xylene or Histoclear (Carlo Erba), followed by two
ex-tractions with ethanol. Samples were then digested for
3 h at 50 °C with proteinase K (PK) 2 mg/ml, Tween 20,
Tris-Cl 50 mM, EDTA 1 mM, pH 8.5, then overnight at
50 °C after PK replenishing. Samples were then
incu-bated at 95 °C for 15 min to inactivate PK, centrifuged
at top speed for 15 min at 4 °C, transferred to a fresh
tube and stored at
− 20 °C. DNA yields were quantified
by ethidium bromide fluorescence in solution [25]. On
average 30
μg DNA/sample were obtained. Size
distribu-tion of the extracted DNA [26] was profiled by ethidium
bromide/agarose gel electrophoresis for sample quality
assessment.
PCR amplification
After thawing, DNA samples prepared as above were
in-cubated at 95 °C for 25 min (this step was critical for
successful amplification). One
μl of this crude extract
was added to the amplification mix. Primers were
de-signed using Primer3 [27, 28] (Additional file 4: Table
S4). TP53 exons (from 2 to 11) were separately amplified
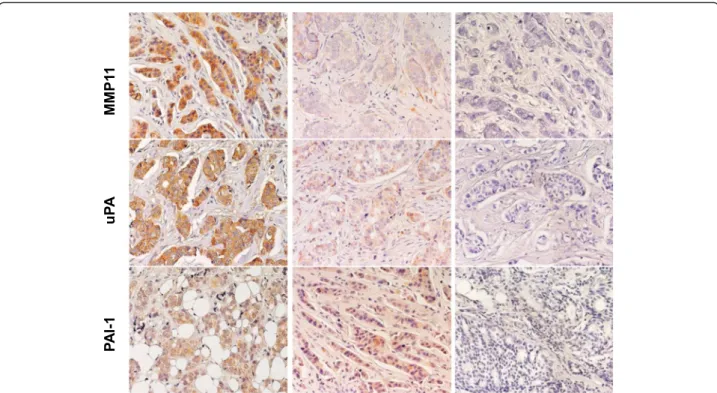
Fig. 3 Expression of MMP11, uPA, PAI-1 in BC. Representative examples of highly expressing (left column) versus negative/low cases (middle column) are shown. Negative controls are shown on the right. Nuclei were counterstained with Mayer’s hematoxylin (in blue)
Table 2 Antibodies utilized for immuno-histochemical
detection
Target protein Antibody Type Provider
Bax p-19a polyclonal Santa Cruz
Bcl-2 100/D5 polyclonal Novocastra/YLEM Cathepsin D cat-D polyclonal DAKO
Cyclin D1 DCS6 monoclonal Novocastra/YLEM Cyclin E 13A3 monoclonal Novocastra/YLEM ERα MU368-UC monoclonal Biogenex Her-2/erb-B/neu Hercep-test polyclonal DAKO
Ki-67 MIB-1 monoclonal Novocastra/YLEM p16/INK4 p16 polyclonal Pharmingen p27/kip1 F-8 monoclonal Santa Cruz
p53 DO7 monoclonal NeoMarkers
PAI-1 sc-6642 polyclonal Santa Cruz
PgR 1A6 polyclonal Ventana
Stromelysin/MMP11 sc-8837 polyclonal Santa Cruz
uPA sc-6830 polyclonal Santa Cruz
a
using optimized primer sets; exons 4 and 5 were
amplified as two overlapping amplicons, using
non-overlapping primers, to prevent loss of mutations
detec-tion capacity in the primer-annealing region.
Reactions were performed in 30
μl total volume (15 μl
KapaBlood PCR Kit B, 0.5
μl of template pretreated
DNA, 20 pmol primer forward, 20 pmol primer reverse).
For multiplex reactions, TP53 was amplified under the
following conditions: 4 cycles (denaturation at 94 °C for
30 s; annealing at 68 °C for 45 s {-1 °C/cycle}; extension
at 72 °C for 30 s), 14 cycles (denaturation at 94 °C for
30 s; annealing at 63 °C for 30 s; extension at 72 °C for
30s); 30 cycles (denaturation at 94 °C for 30 s; annealing
at 60 °C for 30 s; extension at 72 °C for 30s) and a final
extension at 72 °C for 10 min. PCR products were
ana-lyzed by agarose gel electrophoresis.
Sequence analysis of TP53, Ha-RAS and Ki-RAS in human
tumors
In both Ha-RAS (c-Ha-RAS1) and Ki-RAS (c-Ki-RAS2)
activating oncogenic mutations are found at hotspots in
exon 1 and 2, at codons 12, 13 (exon 1) or 61 (exon 2).
Care was taken to differentially amplify the regions of
interest of functional genes versus non-expressed
pseu-dogenes, i.e. c-Ha-RAS2 and c-Ki-RAS1. Benchmark
PCR amplification of Ha- and Ki-RAS exons 1 and 2 was
performed using genomic DNA and cDNA from the
T24 cell line, which carries a mutated, oncogenic form
of Ha-RAS with a transversion at codon 12 (from GGC
to GTC). When using cDNA templates, PCR primers
were designed that reside in exonic regions, for
simul-taneous amplification of both exon 1 and 2 of Ha-and
Ki-RAS. Joint amplification of exon 1 and 2 from
gen-omic DNA was only performed for the Ha-RAS gene
(the intervening intron is only 267 bp long in the
Ha-RAS gene; it is more than 12,500 bp long in the Ki-Ha-RAS
gene). Additional primers were designed that included
intronic regions and were therefore specific for
amplifica-tion of funcamplifica-tional genes from genomic DNA. Amplified
fragments were sequenced on both strands. Insertions or
deletions (indels) of the TP53 gene (Additional file 5:
Table S5) were shown to carry the highest prognostic
weight [29]; such mutations were identified and matched
against those listed in the IARC database [29].
Statistical analysis
The independent impacts of individual risk factors on
prognosis is commonly evaluated in the framework of
uni-or multivariate models [8, 19, 30, 31]. Univariate
analyses were performed with GraphPad Prism 6.0
(GraphPad Software Inc., La Jolla, Ca) and XLStat 2009
(Addinsoft, Paris, France). Multivariate analyses and data
modeling were performed using MetaboAnalyst 2.0 [32–
34] and SIMCA-P+ 11 (Umetrics, Umea, Sweden) [35]
software. However, uni-or multivariate analyses do not
effectively quantify interaction effects on the final
out-come. To explore such interactions, a priori specified
hypotheses have been used in the past as trial models,
but at the risk of introducing analytical bias. To
over-come these limitations, patterns of aggregation of
mo-lecular parameters affecting prognosis were modeled
here through logistic regression and partial least squares
discriminant analysis (PLS-DA). PLS-DA clustering was
performed using relapse as a dichotomic variable.
PLS-DA model validation was performed as previously
de-scribed [36]. Briefly, to define the optimal number of
PCs,
“7-fold cross-validation” (CV) was applied [37].
Using CV, the predictive power of the model was
veri-fied through R
2(goodness of fit) and Q
2(goodness of
prediction). A model with Q
2> 0.5 was considered good,
Q
2> 0.9 excellent [38]. The performance of PLS-DA
models was further validated by a permutation test (200
times). To help interpreting results from PLS-DA, we
utilized variable importance in the projection (VIP)
scores. This allowed to evaluate the parameter influence
on the model and to identify the best descriptors of
relapsing versus non-relapsing BC. VIP scores are
weighted sums of squares of the PLS loading weights,
which take into account the amount of explained
Y-variation for each dimension [33]. VIP values were
cu-mulatively calculated from all extracted PLS
compo-nents, usign a threshold of 0.8 [39]. As some variables
may exert effects on the whole population (global), while
others can be relevant in specific subgroups only (local),
procedures were utilized to identify homogeneous
groups with respect to corresponding parameters
sub-classes [40–42]. Spearman’s correlation analysis was
performed using MetaboAnalyst 2.0 software [32–34]
and GraphPad Prism.
Results
Immunohistochemistry and correlation analysis
Histopathology and molecular biology determinations
were performed as indicated [43, 44] (Figs. 1, 2 and 3;
Additional file 1: Table S1 and Additional file 2: Table
S2). Negative/positive correlations between
histopatho-logical and experimental parameters were assessed by
Spearman’s correlation analysis (Additional file 3: Table
S3). Strongest positive correlations with metastastic
re-lapse were found for grading (rho = 0.454, p = 0.005),
local relapse (rho = 0.892, p < 0.001), p53_n (rho = 0.309,
p = 0.067) and uPA in the extracellular matrix (rho =
0.387, p = 0.02). Highest negative correlations
(Add-itional file 3: Table S3) were observed between
metastas-tic relapse and intracellular uPA (percent cytoplasmic:
rho = -0.369, p = 0.027; expression intensity: rho = -0.435,
p = 0.008). Of interest, p53 expression (% positive cells
and intensity) was found to be associated with secreted
cathepsin D (rho = 0.477, p = 0.003) and was negatively
correlated with Bcl-2 (rho = -0.385, p = 0.02). p53
expres-sion was correlated with grading (rho = 0.499, p = 0.002),
cyclin E (rho = 0.335, p = 0.046), PAI-1 in the
extracellu-lar matrix (rho = 0.444, p = 0.007), Her-2 (rho = 0.368, p
= 0.027) and p16 (rho = 0.514, p = 0.001) expression, first
suggesting key interactions and potential synergy with
other key drivers of tumor malignancy.
Prognostic parameters analysis
Internal benchmarks for additional risk determination
pro-cedures were first assessed. Biochemically-determined
negativity for estrogen receptors was associated with
re-lapse. Estrogen receptor negativity, by semi-quantitative
IHC determination, was associated with twice as high
re-lapse hazard ratio (HR) (HR = 2.0; 95 % C.I. = 0.6–7.4). An
increased mitotic index (Ki-67 expression) was associated
with increased risk of developing adverse events (HR = 2.6;
95 % C.I. = 0.6–11.2), consistent with previous studies [31].
Correlated analysis of the analyzed tumor
determi-nants revealed marked increase in HR for p53, cathepsin
D and Bcl-2 (Figs. 1, 2). Positivity for p53 nuclear
ex-pression was found to associate with an eleven-fold
in-crease in relapse risk (HR = 11; 95 % C.I. = 2.5–51.8).
Unprecedented increase in risk was found for cathepsin
D expression (HR = 20; 95 % C.I. = 2.3–184.3). Notably,
expression profiles of p53 and cathepsin D remained
sig-nificantly different between cases and controls when
subgrouping patients by lymph node status, supporting
an independent prognostic value of these parameters.
Lymph node diffusion correlated with local cancer
re-lapse (rho = 0.405, p = 0.014), but did not with distant
metastatic relapse, raising the issue that determinant of
local invasion may differ from those required for
meta-static diffusion. Hence, we assessed the impact of p53
and cathepsin D in lymph node-negative patients.
Re-markably, tumor co-expression of p53 and cathepsin D
in this patient subgroup remained associated to a
sixteen-fold higher risk of experiencing relapse (HR = 16;
95 % C.I. = 1.5–171.2). Trends for association of positive
lymph nodes and tumor size were found: 50 and 78 % of
lymph-node-positive women were positive for p53 and
cathepsin D, respectively; 63 and 74 % of women with
tumors bigger than 2 cm were positive for p53 and
ca-thepsin D, respectively.
Remarkably, the expression of Bcl-2 was associated
with a markedly better prognosis, and a nine-fold
reduc-tion of risk (HR = 9.2; 95 % C.I. = 1–87.8). Bcl-2
expres-sion
was
previously
found
to
correlate
with
a
differentiated cancer phenotype, i.e. with lower grading
and lack of p53 [45]. Consistent, Bcl-2 expression was
found to correlate with that of ERα and PgR, and was
anti-correlated with cancer grading and with the
expres-sion
of
p53,
Cyclin
E
and
Her-2
(Table
S3).
Correspondingly, Bcl-2 expression was shown to have a
beneficial influence on prognosis [46, 47], whereas loss
of Bcl-2 was found in 70 % of the aggressive
triple-negative BC, and was significantly associated with high
proliferation, tumor progression, increased risk of death
and recurrence [48]. Still, the magnitude of Bcl-2
prog-nostic impact observed here in metastatic versus
non-metastatic BC had not been previously revealed [49],
supporting a critical value of correlated evaluation of
malignancy determinants (Bcl-2, p53, cathepsin D) for
effective use in prognostic assessment.
To verify the strength of this unsupervised analysis,
and to further build on it, we performed a supervised
PLS-DA [50]. Datasets of pathological/experimental
pa-rameters were grouped using a dichotomic classification
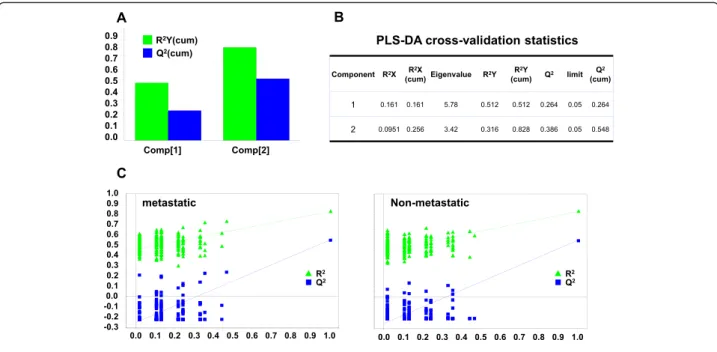
(metastatic relapse versus no relapse). This model was
found to have strong goodness of fit (cumulative R
2Y =
0.828) and prediction power (cumulative Q
2= 0.548)
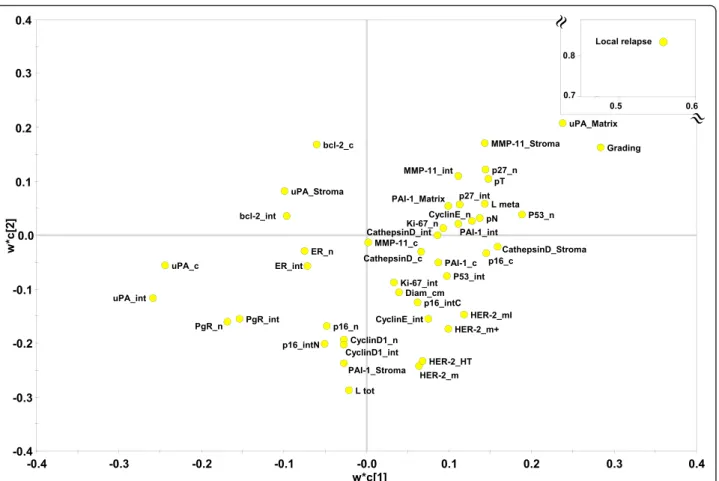
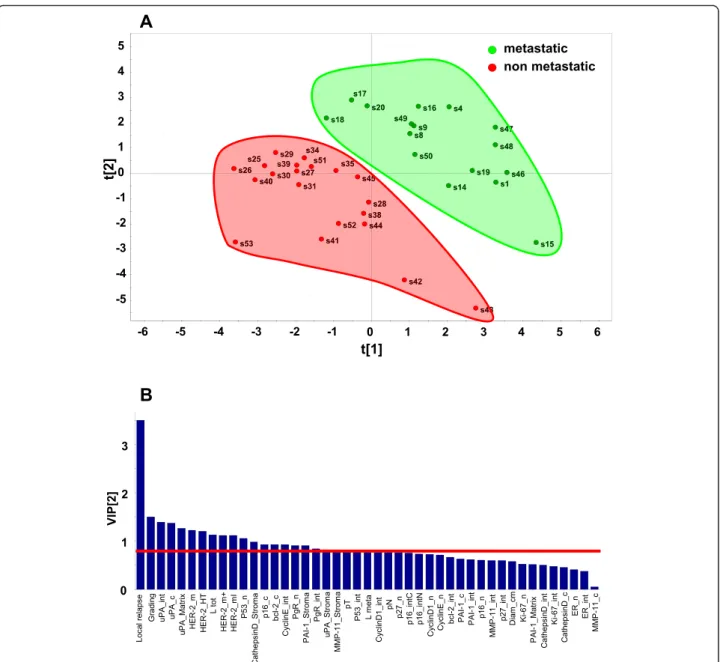
(Figs. 4, 5 and 6). PLS-DA-identified determinants
clus-ters yielded a clear-cut discrimination between
meta-static versus non metameta-static tumours (Figs. 4, 5a). A
PLS-DA weight plot was generated in order to identify
the major discriminants between the groups analyzed
(Fig. 4). Next, VIP scores were computed for each
par-ameter. Twenty descriptors, i.e. local relapse, grading,
HER-2 (membrane intensity), lymph node status, p53,
p16, Bcl-2, Cyclin E, PgR, together with stromal
cathep-sin D, PAI-1, uPA and MMP-11 were found to markedly
contribute to the classification model (VIP score
≥ 0.8)
(Fig. 5b) [39]. Permutation tests were carried out in
order to validate the PLS-DA model [38, 50]. The
ori-ginal model was found to have higher R
2and Q
2values
than the permuted models, and negative Q
2values were
obtained for all two permuted groups tested (Fig. 5c).
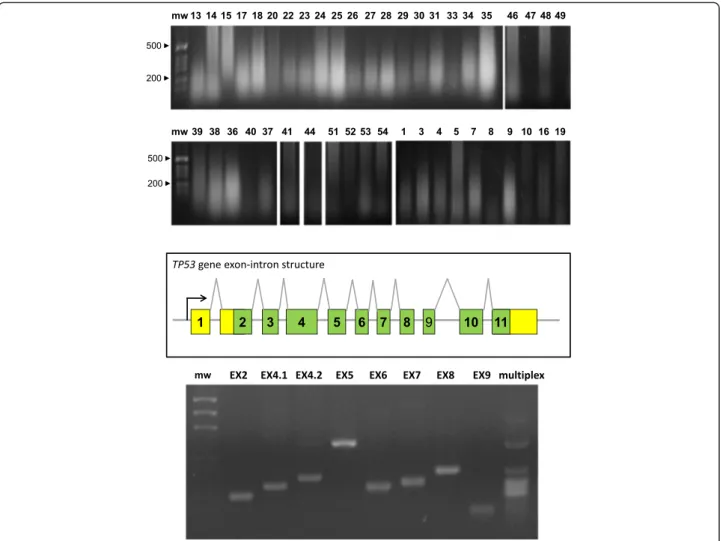
DNA extraction
DNA was extracted from sections of FFPE BC
(Add-itional file 1: Table S1A). Ethidium bromide gel
electro-phoresis (Fig. 7) and amplification of RAS and TP53
exons benchmarked DNA as viable for downstream
ana-lyses. RAS and TP53 sequences were determined on
cases and control DNA (Additional file 1: Table S1), as
described (Figs. 7 and 8).
TP53 mutations
Case and control FFPE tumor samples, were
systematic-ally analyzed for insertions, deletions and stop codons in
the coding region of the TP53 gene by PCR and
sequen-cing of PCR amplification products (Figs. 7 and 8;
Add-itional file 5: Table S5). Structural alterations of the
TP53 gene are listed in Additional file 5: Table S5. Three
indels were identified, and one stop codon, all of which
led to truncation of the corresponding p53 proteins.
Re-markably, all truncated p53 (8.7 % of the BC cases) were
identified in relapsing cancers, three out of four cases
being grade 3, i.e. those with the most malignant
pheno-type. These findings support models were severely
dam-aged p53 is a strong risk factor for tumor progression in
defined subgroups of BC [7, 8, 10, 31]. Notably, though,
only one of these cases was a triple-negative tumor, a
tumor phenotype traditionally associated with tumor
ag-gressiveness [8], suggesting that the present molecular
characterization may lead to novel subgrouping
strat-egies of BC for risk determination. However, larger case
series are needed to validate this approach.
RAS mutations
Case and control BC samples, were analyzed for
muta-tions at codons 12, 13, 14 and 61 of the Ha-RAS and
Ki-RAS genes by PCR amplification and sequencing of the
first and second exon. Three cases showed a mutation at
codon 12 of Ha-RAS, from GGC to GTC (Gly
→ Val); one
case showed an additional mutation at codon 14 from
GTG to ATG (Val
→ Met), with an overall prevalence of
tumors bearing RAS mutations of 6.4 % (Additional file 1:
Table S1). Of note, all mutations occurred in the
meta-static and locally invasive/relapsing cases. This suggested
relevance of mutated Ha-RAS in a small, distinct subset of
metastatic BC. Mutations of both Ha-RAS and TP53 were
identified in the same cancer, suggesting a possible
coop-erativity in cell transformation [51].
Discussion
Traditional prognostic indicators of BC, i.e. lymph node
diffusion, tumor size, grading and estrogen receptor
ex-pression, are inadequate predictors of metastatic relapse.
Therefore, identification of additional parameters versus
traditional prognostic indicators is urgently needed.
Sev-eral genes (oncogenes, tumor suppressor genes,
tran-scription factors, signaling molecules, adhesion proteins,
proteases) play a driving role in tumor progression [52].
Individual oncogenic determinants, e.g. p53, Her-2,
E-cadherin, Trops, have been shown to possess prognostic/
predictive power [7–11, 20, 53]. However, they did not
outperform traditional prognostic indicators. Tumor
progression is a multistep process [13, 54–58], which
correlates with multiple, successive molecular
modifica-tions [13, 14]. Hence, clusters of tumor-driving traits are
expected to be associated with tumor aggressiveness and
overall malignancy, much more strongly than individual
Fig. 4 PLS-DA weight plot. Variables utilized for discrimination between the relapsing and non-relapsing groups are reported. Variables that better correlate with metastatic tumors, map in the top right quadrant; variables that correlate more with non metastatic tumors, map in the lower left quadrant. Inset: local relapse (magnified scale)
factors. In this work, we tested such a model in BC.
Histopathological and molecular determinants of tumor
progression of post-menopausal BC were analyzed, to
assess impact on metastatic relapse. Aggregation of
can-cer determinants was expolored by modeling through
discriminant analysis, logistic regression, partial least
squares and partition trees. This identified upregulation
of p53 and cathepsin D, together with downregulation of
Bcl-2, as associated with a major increase in risk of
dis-ease relapse.
p53 is a tumor suppressor gene which is frequently
mutated in cancer cells [59], and was identified as an
indicator of both prognosis [8, 60–62] and response to
therapy [7]. A cooperation of p53 with other drivers of
tumor progression, e.g. Her-2 [8, 63] and
Trop-1/Ep-CAM [10, 64] was previously shown, thus lending
sup-port our model of interaction between distinct
prognos-tic determinants.
Bcl-2 inhibits cellular apoptosis [65]. Hower, Bcl-2
ex-pression has a stronger impact as indicator of retained
cancer differentiation, and of better disease outcome
[45]. Indeed, loss of Bcl-2 was shown to have negative
prognostic impact [46, 47, 49]. Bcl-2 expression was lost
in 70 % of the most aggressive triple-negative BC cases,
Fig. 5 PLS-DA score plot and VIP scores. a PLS-DA score plot showing the clustering of tumor samples with (green perimeter) or without (red perimeter) metastatic relapse. Complete separation between the green versus red clusters was achieved. Clustering thresholds were applied as indicated in Methods. b Variables able to discriminate between metastatic and non metastatic tumors are presented, as ordered by VIP score. VIP scores≥ 0.8 (above the red line) identified key variables for predicting Y responses (relapse)
i.e. those lacking ERα, PgR and Her-2, and was
signifi-cantly associated with high proliferation, tumor
progres-sion and increased risk of death and recurrence [48].
Supporting these findings, we found that Bcl-2
expres-sion negatively correlated with cancer grading and with
the expression of p53, cyclin E and Her-2. On the other
hand, Bcl-2 expression was found to correlate with that
of
ERα and PgR, i.e. with differentiated cancer
phenotypes.
Proteases, e.g. cathepsin D, uPA, MMP-11, are
se-creted by transformed or stromal cells of BC, and impact
on tumor invasion and mestastasis [66–76]. uPA is
mod-ulated by the plasminogen activator inhibitor-1 (PAI-1),
and combined assessment of uPA and PAI-1 was shown
to be of value for prognostic determination [77, 78],
in-dicating an impact of overall proteolytic balance on
tumor progression. As indicated above for loss of Bcl-2,
triple-negative BC were frequently associated with
over-expression of cathepsin-D, and with aggressive disease
course through lymph node invasion and high cancer
cell proliferation/Ki-67 index [79].
As for the additional determinants we analyzed, cyclins
D and E regulate the cell cycle [80], and increased levels
are associated with worse prognosis and increased
re-lapse rates in BC patients [81]. p27/kip1 and p16/INK4
are inhibitors of cyclin-dependent kinases and can
pre-vent progression through the cell cycle [55], but can also
be determinants of malignancy. High levels of the p27/
kip1 cyclin inhibitor have been associated with worse
prognosis and higher relapse rate in BC [82, 83]. On the
other hand, deletion of p16/INK4 can be selected for in
BC [84]. Consistent with an interactive predictive value,
the levels of Cyclin E and of the p27 cyclin inhibitor
were shown to have a higher impact when combined
[82]. The mitotic index (Ki-67) is a measure of the
per-centage of tumor cells in active division and is a relevant
prognostic indicator in BC [31]. Her-2 is a
transmem-brane tyrosine kinase receptor that regulates the growth
of tumor cells [85]. The levels of expression of Her-2
have been shown to be independent indicators of worse
prognosis, with respect to tumor relapse and overall
sur-vival in BC patients [86].
To identify interaction effects of different variables on
disease outcome, expression profiles of tumor
progres-sion drivers were assessed, and results were evaluated by
means
of
statistical
analyses
designed
to
detect
Fig. 6 PLS-DA cross-validation and performance. a Bar plot showing the performance measures (R2Ycum and Q2cum) using different numbers of components. b R2X: portion of the variation of X explained by specified principal component; R2X (cum) Cumulative explained portion of X set variation; Eigenvalue: number of variables (K) times R2X; R2Y: portion of the Y set variation modeled by the principal component; R2Y (cum): cumulative modeled variation of Y set; Q2: overall cross-validated R2for the specific principal component; Limit: threshold cross-validation for the specific principal component; Q2(cum): cumulative Q2up to the specified component, is a model predictive power according to cross validation. Unlike R2X (cum), Q2(cum) is not additive. c Permutation tests for: metastatic (left) and non metastatic tumors (right). Permutation tests were performed by comparing R2and Q2of the original model with R2and Q2of Y-class-permutated models. The correlation coefficients of original and permuted data are reported on the X axis; 200 random permutations were carried out. The values of R2and Q2are reported on the Y axis. The green triangles and blue squares in the upper right (ρ = 1) correspond to the values of R2(green triangles) and Q2(blue squares) of the original data. The low values of intercepts show that the model has high statistical significance (no over-fitting)
significant prognostic interaction. To preempt the need
for a priori specified hypotheses, patterns of aggregation
of molecular parameters affecting prognosis were
mod-eled through logistic regression and PLS-DA, using
re-lapse as a dichotomic variable. PLS-DA score plot
clustering of tumor samples with or without disease
re-lapse, obtained separation between the two clusters.
Major discriminant parameters were shown to be,
HER-2, p53, p16, Cyclin E, PgR, together with stromal
cathep-sin D, PAI-1, uPA and MMP-11 were found to
mark-edly contribute to the classification model; these
efficiently clustered with local relapse, lymph node
dif-fusion, tumor staging and grading. Among prognostic
factors, p53 and cathepsin D stood up as major
deter-minants of cancer relapse. Bcl-2 expression was shown
to provide with unprecedented protective power
ver-sus tumor recurrence, candidating the combined
as-sessment of these IHC parameters for use in clinical
settings. Of interest, our case-control study included
only one triple negative BC, indicating that a triple
negative status was not a confounding variable in our
study, and that p53, cathepsin D and Bcl-2 are
effi-cient aggressiveness determinants in BC across
cur-rently categorized cancer subgroups.
Specific mutations of oncogenes and tumor suppressor
genes play key roles in tumor progression. TP53 is
fre-quently inactivated in several human tumors [87–89]
and TP53 mutations help classifying and selecting
pa-tient subgroups with different biological features [8, 90],
particularly in BC [8, 10, 31]. Mutations in different
re-gions of TP53 were shown to be heterogenous in nature
[91] and clinical outcome, indels having the highest
im-pact [92]. Consistent, sequencing of the TP53 gene
re-vealed a subgroup of BC where truncating mutations,
such as indels and stop codons, were in all cases
associ-ated with cancer relapse.
The RAS genes code for small G proteins that play a
critical role in signal transduction pathways downstream
Fig. 7 Oncogene sequence analysis. (top) Genomic DNA was extracted from BC and electrophoresed in agarose/ethidium bromide. Sample numbers are on top of each lane; mw: molecular weight markers. (mid) Exon-intron structure of the TP53 gene. (bottom) PCR amplification of the TP53 exons. EX: exon number; multiplex: simultaneous amplification of all exons with optimized primers and amplification procedure; mw: molecular weight markers
of growth-factor receptors. RAS mutations can affect
prognosis [93
–95]. Moreover, Ras downstream target
genes are synergistically upregulated by mutated p53
and Ha-Ras, among them, matrix metalloproteases,
which play a key role in local invasion and distant
dis-semination [96]. Hence, hot-spot sequence analysis was
performed for Ha-and Ki-RAS, and findings were
corre-lated with the IHC data and clinical phenotypes. The
constitutive activation of the Ras proteins by point
mu-tations, concentrated in hotspots at codons 12, 13, 61,
is among the most frequently observed oncogene
acti-vation in human malignancies (75 % of
adenocarcin-omas of the pancreas, 40 % of adenadenocarcin-omas and
carcinomas of the colon and rectum, 25 % of
carcin-omas of the lung) and have been linked to worse
prog-nosis [97]. However, although mutations in Ha-RAS
and of Ki-RAS are often found in animal models of BC
[98], their mutation frequency in human BC was shown
to vary widely across studies. c-Ki-RAS mutations were
shown to occur in 1 out of 8 BC by Yanez et al. [99].
Ha-RAS mutations were detected by Spandidos et al.
[100], but not by Biunno et al. [101]. An overall low
fre-quency of Ha-RAS mutations was found in most
subse-quent studies [97, 102
–106]. Our findings support an
incidence of mutated Ha-RAS in
≈ 5 % of BC cases. No
mutations were detected in Ki-RAS. Remakably, all
RAS mutations were identified in relapsed cases,
sug-gesting impact of mutated Ha-RAS in a distinct
sub-set of malignant BC [97, 104–106]. This finding
warrants testing in a prospective clinical trial with
ad-equate size and predictive power for relapsed cases
subgroup dissection.
Conclusions
Taken together, our findings support a model of high
BC aggressiveness as associated to high levels of p53 [8,
10] and cathepsin D [79], together with a
downregula-tion of Bcl-2 [48]. An interacdownregula-tion between
tumor-relapse risk factors may thus have a marked impact on
prognosis, paving the way for using cluster molecular
profiling of BC, to identify patient subgroups with
dis-tinct disease outcomes.
A
C
B
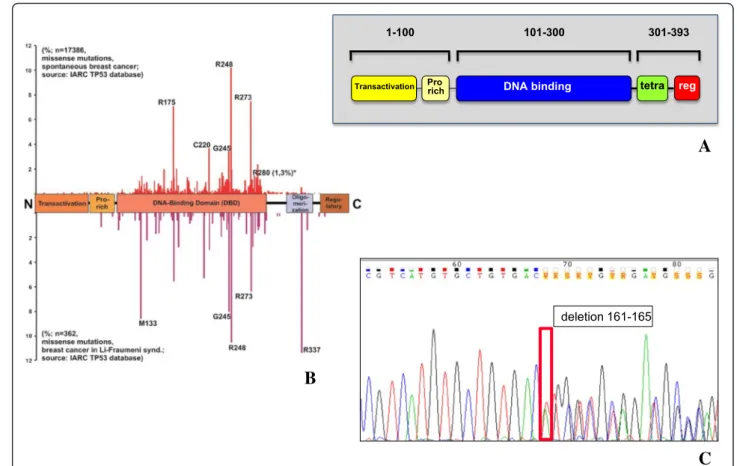
Fig. 8 TP53 coding regions sequencing. a Block scheme of the p53 functional domains, protein sequence residues numbers are shown; Pro rich: proline-rich; tetra: oligomerization domain; reg: negative regulator of p53 function. b Prevalence of TP53 mutations in the different regions of the gene (from IARC TP53 Database, Release 17); (top) frequency of somatic mutations in BC; (bottom) frequency of germline, hereditary mutations in Li-Fraumeni syndrome. c Representative example of a DNA sequence chromatogram, containing a mutated sequence (see also Additional file 5: Table S5); the mutation site is boxed; the corresponding amino acid sequence is indicated
Additional files
Additional file 1: Table S1. Parameters utilized for assessing the risk of relapse. (XLSX 48 kb)
Additional file 2: Table S2A. IHC analysis of consensus parameters of relapsed versus control BC cases. Table S2B. Invasion and cell cycle/ apoptosis parameters of relapsed versus control BC cases. (XLSX 150 kb) Additional file 3: Table S3A. Spearman’ correlation matrix. Table S3B. Spearman’ correlation Rho coefficients. Table S3C. Spearman’ correlation P values. (XLSX 323 kb)
Additional file 4: Table S4A. p53 structure and main mutation sites. Table S4B. Ha-Ras structure and main mutation sites. Table S4C. TP53 and Ha-RAS amplification primers. (XLSX 472 kb)
Additional file 5: Table S5. TP53 indels and stop codon chromatograms. (XLSX 1620 kb)
Acknowledgments
We thank A. Nicolucci, F. Carinci, C.A. Beltrami, C. Di Loreto, E. Bianchini, B. Murer and B. Palombo for help during the course of this work. We thank T. Soussi and C. Ishioka for discussion and support.
Funding
We gratefully acknowledge the support of the Italian Association for Cancer Research (AIRC, Italy), Italian Ministry of Development (contract n. MI01_00424 and SSI000651), Compagnia di San Paolo (Grant 2489IT), Foundation of the Cassa di Risparmio della Provincia di Chieti (Italy), Italian Ministry of University and Research (contract n. SCN_00558), and Italian Ministry of Health (RicOncol RF-EMR-2006–361866). The sponsors had no role in the design and conduct of this study, nor in the collection, analysis and interpretation of the data, or in the preparation, review or approval of the manuscript.
Availability of data and material
The data analyzed in this study are included in this published article and its supplementary information files.
Authors’ contributions
SA conceived the project; GB provided the samples from the National Naples Cancer Center, MP provided the samples and SA collected the clinical data; EG, AC and GV planned and performed the molecular analyses; VG, MDA and BS generated the sequencing data, RL and MP performed the histopathology and IHC analyses, PS and SA processed and analysed the data. All authors drafted the manuscript and approved the final version.
Competing interests
The authors declare that they have no competing interests regarding the contents of this manuscript.
Consent for publication Not applicable.
Ethics approval and consent to participate
This project was approved by the Italian Ministry of Health (RicOncol RF-EMR-2006–361866) and by the ethical committee of the leading institution, the National Cancer Institute of Naples (Verbale Comitato Etico n°3, 25 March 2009, Prot. CEI 1 2A/09 3 April 2009). According to national regulations no written consent was needed for this study. The presented experiments conformed to the principles set out in the World Medical Association Declaration of Helsinki [107].
Author details
1
Unit of Cancer Pathology, CeSI-MeT, University of Chieti, Chieti, Italy.
2Department of Medical, Oral and Biotechnological Sciences, University‘G.
D’Annunzio’, Chieti, Italy.3Department of Pathology“Foundation G.Pascale”,
National Cancer Institute, Naples, Italy.4Department of Psychological, Health
ad Territorial Sciences, School of Medicine and Life Sciences, University‘G. D’Annunzio’, Chieti, Italy.5BMR Genomics srl, Via Redipuglia, 22, Padova
35131, Italy.6Department of Neurosciences, Imaging and Clinical Sciences,
University‘G. D’Annunzio’, Chieti, Italy.
Received: 21 July 2015 Accepted: 11 August 2016
References
1. Zanetti R, Buiatti E, Federico M, Micheli A, Fatti E. Cifre dei tumori in Italia. Pensiero Scientifico Editore. 1998.
2. Elston CW, Ellis IO. Pathological prognostic factors in breast cancer. I. The value of histological grade in breast cancer: experience from a large study with long-term follow-up. Histopathology. 1991;19:403–10.
3. Oncofem P. Carcinoma della mammella in Italia. Federazione Medica. 1992; 9:11–6.
4. Group EBCTC. Polychemotherapy for early breast cancer: an overview of the randomised trials. Lancet. 1998;352:930–42.
5. Li Y, Melnikov AA, Levenson V, Guerra E, Simeone P, Alberti S, Deng Y. A seven-gene CpG-island methylation panel predicts breast cancer progression. BMC Cancer. 2015;15:417.
6. Callagy G, Cattaneo E, Daigo Y, Happerfield L, Bobrow LG, Pharoah PD, Caldas C. Molecular classification of breast carcinomas using tissue microarrays. Diagn Mol Pathol. 2003;12:27–34.
7. Cimoli G, Malacarne D, Ponassi R, Valenti M, Alberti S, Parodi S. Meta-analysis of the role of p53 status in isogenic systems tested for sensitivity to cytotoxic antineoplastic drugs. Biochim Biophys Acta. 2004;1705:103–20. 8. Biganzoli E, Coradini D, Ambrogi F, Garibaldi JM, Lisboa P, Soria D, Green
AR, Pedriali M, Piantelli M, Querzoli P, et al. p53 status identifies two subgroups of triple-negative breast cancers with distinct biological features. Jpn J Clin Oncol. 2011;41:172–9.
9. Alberti S, Biganzoli E, Boracchi P, Ambrogi F, Querzoli P, Pedriali M, La Sorda R, Lattanzio R, Tripaldi R, Nenci I, et al. Cytoplasmic Trop-1 over-expression is associated with a favourable outcome in node-positive breast cancer patients. Jpn J Clin Oncol. 2012;42:1128–37.
10. Ambrogi F, Fornili M, Alberti S, Querzoli P, Piantelli M, Pedriali M, Boracchi P, Biganzoli E, Coradini D. EpCAM Expression is an Indicator of Increased Incidence of Relapse in p53-Positive Breast Cancer. Cancer Clin Oncol. 2013; 2:41–50.
11. Ambrogi F, Fornili M, Boracchi P, Trerotola M, Relli V, Simeone P, La Sorda R, Lattanzio R, Querzoli P, Pedriali M, et al. Trop-2 is a determinant of breast cancer survival. PLoS One. 2014;9:e96993.
12. Stephens PJ, Tarpey PS, Davies H, Van Loo P, Greenman C, Wedge DC, Nik-Zainal S, Martin S, Varela I, Bignell GR, et al. The landscape of cancer genes and mutational processes in breast cancer. Nature. 2012;486:400–4. 13. Vogelstein B, Kinzler KW. The multistep nature of cancer. Trends Genet.
1993;9:138–41.
14. Boland CR, Sato J, Appelman HD, Bresalier RS, Feinberg AP. Microallelotyping defines the sequence and tempo of allelic losses at tumour suppressor gene loci during colorectal cancer progression. Nat Med. 1995;9:902–9.
15. Hunter T. Oncoprotein networks. Cell. 1997;88:333–46.
16. Wold LE, Ingle JN, Pisansky TM, Johnson RE, Donohue JH. Prognostic factors for patients with carcinoma of the breast. Mayo Clin Proceedings. 1995;70: 678–9.
17. Silverstein MJ, Lagios MD, Groshen S, Waisman JR, Lewinsky BS, Martino S, Gamagami P, Colburn WJ. The influence of margin width on local control of ductal carcinoma in situ of the breast. N Engl J Med. 1999;340:1455–61. 18. Galea MH, Blamey RW, Elston CE, Ellis IO. The Nottingham Prognostic Index
in primary breast cancer. Breast Cancer Res Treat. 1992;22:207–19. 19. Querzoli P, Pedriali M, Rinaldi R, Lombardi AR, Biganzoli E, Boracchi P,
Ferretti S, Frasson C, Zanella C, Ghisellini S, et al. Axillary lymph node nanometastases are prognostic factors for disease-free survival and metastatic relapse in breast cancer patients. Clin Cancer Res. 2006;12: 6696–701.
20. Querzoli P, Coradini D, Pedriali M, Boracchi P, Ambrogi F, Raimondi E, La Sorda R, Lattanzio R, Rinaldi R, Lunardi M, et al. An immunohistochemically positive E-cadherin status is not always predictive for a good prognosis in human breast cancer. Br J Cancer. 2010;103:1835–9.
21. Lattanzio R, Marchisio M, La Sorda R, Tinari N, Falasca M, Alberti S, Miscia S, Ercolani C, Di Benedetto A, Perracchio L, et al. Overexpression of activated phospholipase Cγ1 is a risk factor for distant metastases in T1-T2, N0 breast cancer patients undergoing adjuvant chemotherapy. Int J Cancer. 2013;132: 1022–31.
22. Castrilli G, Piantelli M, Artese L, Perfetti G, Rubini C, Fioroni M, Ranelletti FO, Piattelli A. Expression of hMSH2 and hMLH1 proteins of the human DNA
mismatch repair system in ameloblastoma. J Oral Pathol Med. 2001;30: 305–8.
23. Alberti S, Herzenberg LA. DNA methylation prevents transfection of genes for specific surface antigens. Proc Natl Acad Sci U S A. 1988;85:8391–4. 24. Liu B, Parsons R, Papadopoulos N, Nicolaides NC, Lynch HT, Watson P, Jass
JR, Dunlop M, Wyllie A, Peltomaki P, et al. Analysis of mismatch repair genes in hereditary non-polyposis colorectal cancer patients. Nat Med. 1996;2:169–74. 25. Bonasera V, Alberti S, Sacchetti A. Protocol for high-sensitivity/long
linear-range spectrofluorimetric DNA quantification using ethidium bromide. Biotechniques. 2007;43:173–6.
26. Goelz SE, Hamilton SR, Vogelstein B. Purification of DNA from formaldehyde fixed and paraffin embedded human tissue. Biochem Biophys Res Commun. 1985;130:118–26.
27. Untergasser A, Cutcutache I, Koressaar T, Ye J, Faircloth BC, Remm M, Rozen SG. Primer3–new capabilities and interfaces. Nucleic Acids Res. 2012;40:e115. 28. Koressaar T, Remm M. Enhancements and modifications of primer design
program Primer3. Bioinformatics. 2007;23:1289–91.
29. Petitjean A, Mathe E, Kato S, Ishioka C, Tavtigian SV, Hainaut P, Olivier M. Impact of mutant p53 functional properties on TP53 mutation patterns and tumor phenotype: lessons from recent developments in the IARC TP53 database. Hum Mutat. 2007;28:622–9.
30. Biganzoli E, Boracchi P, Daidone MG, Gion M, Marubini E. Flexible modelling in survival analysis. Structuring biological complexity from the information provided by tumor markers. Int J Biol Markers. 1998;13:107–23.
31. Ambrogi F, Biganzoli E, Querzoli P, Ferretti S, Boracchi P, Alberti S, Marubini E, Nenci I. Molecular subtyping of breast cancer from traditional tumor marker profiles using parallel clustering methods. Clin Cancer Res. 2006;12: 781–90.
32. Xia J, Psychogios N, Young N, Wishart DS. MetaboAnalyst: a web server for metabolomic data analysis and interpretation. Nucleic Acids Res. 2009;37: W652–60.
33. Xia J, Wishart DS. Web-based inference of biological patterns, functions and pathways from metabolomic data using MetaboAnalyst. Nat Protoc. 2011;6: 743–60.
34. Xia J, Mandal R, Sinelnikov IV, Broadhurst D, Wishart DS. MetaboAnalyst 2.0– a comprehensive server for metabolomic data analysis. Nucleic Acids Res. 2012;40:W127–33.
35. Eriksson L, Antti H, Gottfries J, Holmes E, Johansson E, Lindgren F, Long I, Lundstedt T, Trygg J, Wold S. Using chemometrics for navigating in the large data sets of genomics, proteomics, and metabonomics (gpm). Anal Bioanal Chem. 2004;380:419–29.
36. Vergara D, Simeone P, Del Boccio P, Toto C, Pieragostino D, Tinelli A, Acierno R, Alberti S, Salzet M, Giannelli G, et al. Comparative proteome profiling of breast tumor cell lines by gel electrophoresis and mass spectrometry reveals an epithelial mesenchymal transition associated protein signature. Mol Biosyst. 2013;9:1127–38.
37. Bjerrum JT, Nielsen OH, Hao F, Tang H, Nicholson JK, Wang Y, Olsen J. Metabonomics in ulcerative colitis: diagnostics, biomarker identification, and insight into the pathophysiology. J Proteome Res. 2010;9:954–62. 38. Chan EC, Pasikanti KK, Nicholson JK. Global urinary metabolic profiling
procedures using gas chromatography-mass spectrometry. Nat Protoc. 2011; 6:1483–99.
39. Rudney JD, Staikov RK, Johnson JD. Potential biomarkers of human salivary function: a modified proteomic approach. Arch Oral Biol. 2009;54:91–100. 40. Ciampi A. Computationals aspects of model choice. Heidelberg:
Physica-Verlag; 1994.
41. Nicolucci A, Carinci F, Ciampi A. Stratifying patients at risk of diabetic complications: an integrated look at clinical, socioeconomic, and care-related factors. SID-AMD Italian Study Group for the Implementation of the St. Vincent Declaration. Diabetes Care. 1998;21:1439–44.
42. Breiman L, Friedman JH, Olshen RA. Classification and regression trees. Belmont: Wadsworth International Group; 1984.
43. Ausubel FM, Brent R, Kingston RE, Moore DD, Seidman JG, Smith JA, Struhl K. Short protocols in molecular biology. 2nd ed. New York: Harvard Medical School; 1989.
44. Sambrook J, Fritsch EF, Maniatis T. Molecular cloning-A laboratory manual. 2nd ed. New York: Cold Spring Harbor Laboratory; 1989.
45. Duenas-Gonzalez A, Abad-Hernandez MM, Cruz-Hernandez JJ, Gonzalez SR. Analysis of bcl-2 in sporadic breast carcinoma. Cancer. 1997;80:2100–8. 46. O’Driscoll L, Linehan R, Kennedy SM, Cronin D, Purcell R, Glynn S,
McDermott EW, Hill AD, O’Higgins NJ, Parkinson M, Clynes M. Lack of
prognostic significance of survivin, survivin-DeltaEx3, survivin-2B, galectin-3, bag-1, bax-alpha and MRP-1 mRNAs in breast cancer. Cancer Lett. 2003;201: 225–36.
47. Kroger N, Milde-Langosch K, Riethdorf S, Schmoor C, Schumacher M, Zander AR, Loning T. Prognostic and predictive effects of immunohistochemical factors in high-risk primary breast cancer patients. Clin Cancer Res. 2006;12: 159–68.
48. Abdel-Fatah TM, Perry C, Dickinson P, Ball G, Moseley P, Madhusudan S, Ellis IO, Chan SY. Bcl2 is an independent prognostic marker of triple negative breast cancer (TNBC) and predicts response to anthracycline combination (ATC) chemotherapy (CT) in adjuvant and neoadjuvant settings. Ann Oncol. 2013;24:2801–7.
49. Fitzgibbons PL, Page DL, Weaver D, Thor AD, Allred DC, Clark GM, Ruby SG, O’Malley F, Simpson JF, Connolly JL, et al. Prognostic factors in breast cancer. College of American Pathologists Consensus Statement 1999. Arch Pathol Lab Med. 2000;124:966–78.
50. Simeone P, Trerotola M, Urbanella A, Lattanzio R, Ciavardelli D, Di Giuseppe F, Eleuterio E, Sulpizio M, Eusebi V, Pession A, et al. A Unique Four-Hub Protein Cluster Associates to Glioblastoma Progression. PLoS One. 2014;9:e103030. 51. Hinds PW, Finlay CA, Quartin RS, Baker SJ, Fearon ER, Vogelstein B, Levine
AJ. Mutant p53 DNA clones from human colon carcinomas cooperate with ras in transforming primary rat cells: a comparison of the“hot spot” mutant phenotypes. Cell Growth Differ. 1990;1:571–80.
52. Hanahan D, Weinberg RA. Hallmarks of cancer: the next generation. Cell. 2011;144:646–74.
53. Nasr AF, Nutini M, Palombo B, Guerra E, Alberti S. Mutations ofTP53 induce loss of DNA methylation and amplification of the TROP1 gene. Oncogene. 2003;22:1668–77.
54. Cahill DP, Lengauer C, Yu J, Riggins GJ, Willson JK, Markowitz SD, Kinzler KW, Vogelstein B. Mutations of mitotic checkpoint genes in human cancers. Nature. 1998;392:300–3.
55. Hunter T, Pines J. Cyclins and cancer. Cell. 1991;66:1071–4.
56. Rhim JS, Yoo JH, Park JH, Thraves P, Salehi Z, Dritschilo A. Evidence for the multistep nature of in vitro human epithelial cell carcinogenesis. Cancer Res. 1990;50:5653s–7s.
57. Chuaqui RF, Zhuang Z, Merino MJ. Molecular genetic events in the development and progression of ovarian cancer in humans. Mol Med Today. 1997;3:207–13.
58. Nagase H, Bryson S, Cordell H, Kemp CJ, Fee F, Balmain A. Distinct genetic loci control development of benign and malignant skin tumours in mice. Nat Genet. 1995;10:424–9.
59. Davidoff AM, Humphrey PA, Iglehart JD, Marks JR. Genetic basis for p53 overexpression in human breast cancer. Proc Natl Acad Sci U S A. 1991;88: 5006–10.
60. Silvestrini R, Benini E, Daidone MG, Veneroni S, Boracchi P, Cappelletti V, Di Fronzo G, Veronesi U. p53 as an independent prognostic marker in lymph node-negative breast cancer patients. J Natl Cancer Inst. 1993;85:965–70. 61. Allred DC, Clark GM, Elledge R, Fuqua SA, Brown RW, Chamness GC,
Osborne CK, McGuire WL. Association of p53 protein expression with tumor cell proliferation rate and clinical outcome in node-negative breast cancer. J Natl Cancer Inst. 1993;85:200–6.
62. Joly A, Desjardins J-F, Fremond B, Desille M, Campion J-P, Malledant Y, Lebreton Y, Semana G, Edwards-Levy F, Levy M-C, Clementi B. Survival, proliferation, and functions of porcine hepatocytes encapsulated in coacted alginate beads: a step toward a reliable bioartificial liver. Transplantation. 1997;63:795–803.
63. Geisler S, Lonning PE, Aas T, Johnsen H, Fluge O, Haugen DF, Lillehaug JR, Akslen LA, Borresen-Dale AL. Influence of TP53 gene alterations and c-erbB-2 expression on the response to treatment with doxorubicin in locally advanced breast cancer. Cancer Res. 2001;61:2505–12.
64. Zanna P, Trerotola M, Vacca G, Bonasera V, Palombo B, Guerra E, Rossi C, Lattanzio R, Piantelli M, Alberti S. Trop-1 is a novel cell growth stimulatory molecule that marks early stages of tumor progression. Cancer. 2007;110: 452–64.
65. Berardo MD, Elledge RM, De Moor C, Clark GM, Osborne CK, Allred DC. bcl-2 and apoptosis in lymph node positive breast carcinoma. Cancer. 1998;82: 1296–302.
66. Ahmad A, Hanby A, Dublin E, Poulson R, Smith P, Barnes D, Rubens R, Anglard P, Hart I. Stromelysin 3: an independent prognostic factor for relapse-free survival in node-positive breast cancer and demonstration of novel breast carcinoma cell expression. Am J Pathol. 1998;152:721–8.
67. Ciccocioppo R, Capri MG, Alberti S. Detection of the receptor for the human urokinase-type plasminogen activator using fluoresceinated uPA. J Histochem Cytochem. 1997;45:1307–13.
68. Isola J, Weitz S, Visakorpi T, Holli K, Shea R, Khabbaz N, Kallioniemi OP. Cathepsin D expression detected by immunohistochemistry has
independent prognostic value in axillary node-negative breast cancer. J Clin Oncol. 1993;11:36–43.
69. Pyke C, Kristensen P, Ralfkiaer E, Grondahl Hansen J, Eriksen J, Blasi F, Dano K. Urokinase-type plasminogen activator is expressed in stromal cells and its receptor in cancer cells at invasive foci in human colon adenocarcinomas. Am J Pathol. 1991;138:1059–67.
70. Reilly D, Andreasen PA, Duffy MJ. Urokinase-plasminogen activator in breast cancer: assay by both catalytic and immunoassay. Blood Coagul Fibrinolysis. 1991;2:47–50.
71. Mignatti P, Rifkin DB. Biology and biochemistry of proteinases in tumor invasion. Physiol Rev. 1993;73:161–95.
72. Stephens RW, Pollanen J, Tapiovaara H, Leung KC, Sim PS, Salonen EM, Ronne E, Behrendt N, Dano K, Vaheri A. Activation of pro-urokinase and plasminogen on human sarcoma cells: a proteolytic system with surface-bound reactants. J Cell Biol. 1989;108:1987–95.
73. Schultz RM, Yu H, Zhang JY. The role of urokinase and urokinase inhibitor in tumor cell metastasis. Fibrinolysis. 1992;6:23–9.
74. Ossowski L, Reich E. Antibodies to plasminogen activator inhibit human tumor metastasis. Cell. 1983;35:611–9.
75. Hearing VJ, Law LW, Corti A, Appella E, Blasi F. Modulation of metastatic potential by cell surface urokinase of murine melanoma cells. Cancer Res. 1989;48:1270–8.
76. Zhang YG, Du J, Tian XX, Zhong YF, Fang WG. Expression of E-cadherin, beta-catenin, cathepsin D, gelatinases and their inhibitors in invasive ductal breast carcinomas. Chin Med J (Engl). 2007;120:1597–605.
77. Paradiso A, Volpe S, Iacobacci A, Marubini E, Verderio P, Costa A, Daidone MG, Marchetti A, Mottolese M, Amadori D, et al. Quality control for biomarker determination in oncology: the experience of the Italian Network for Quality Assessment of Tumor Biomarkers (INQAT). Int J Biol Markers. 2002;17:201–14.
78. Sweep CG, Geurts-Moespot J, Grebenschikov N, De Witte JH, Heuvel JJ, Schmitt M, Duffy MJ, Janicke F, Kramer MD, Foekens JA, et al. External quality assessment of trans-European multicentre antigen determinations (enzyme-linked immunosorbent assay) of urokinase-type plasminogen activator (uPA) and its type 1 inhibitor (PAI-1) in human breast cancer tissue extracts. Br J Cancer. 1998;78:1434–41.
79. Huang L, Liu Z, Chen S, Liu Y, Shao Z. A prognostic model for triple-negative breast cancer patients based on node status, cathepsin-D and Ki-67 index. PLoS One. 2013;8:e83081.
80. Baldin V, Lukas J, Marcote MJ, Pagano M, Draetta G. Cyclin D1 is a nuclear protein required for cell cycle progression in G1. Genes Dev. 1993;7:812–21. 81. Pelosio P, Barbareschi M, Bonoldi E, Marchetti A, Verderio P, Caffo O,
Bavilacqua P, Boracchi P, Buttita F, Barbazza R, et al. Clinical significance of cyclin D1 expression in patients with node-positive breast carcinoma treated with adjuvant therapy. Ann Oncol. 1996;7:695–703.
82. Porter PL, Malone KE, Heagerty PJ, Alexander GM, Gatti LA, Firpo EJ, Daling JR, Roberts JM. Expression of cell-cycle regulators p27kip1and cyclin E, alone and in combination, correlate with survival in young breast cancer patients. Nat Med. 1997;3:222–5.
83. Catzavelos C, Bhattacharya N, Ung YC, Wilson JA, Roncari L, Sandhu C, Shaw P, Yeger H, Morava-Protzner I, Kapusta L, et al. Decreased levels of the cell-cycle inhibitor p27kip1protein: prognostic implications in primary breast cancer. Nat Med. 1997;3:227–30.
84. Cairns P, Polascik TJ, Eby Y, Tokino K, Califano J, Merlo A, Mao L, Herath J, Jenkins R, Westra W, et al. Frequency of homozygous deletion at p16/ CDKN2 in primary human tumors. Nat Genet. 1995;11:210–2.
85. De Potter CR, Schelfhout AM. The neu-protein and breast cancer. Virchows Arch. 1995;426:107–15.
86. De Potter CR, Beghin C, Makar AP, Vandekerckhove D, Roels HJ. The neu-oncogene protein as a predictive factor for haematogenous metastases in breast cancer patients. Int J Cancer. 1990;45:55–8.
87. Carter SL, Cibulskis K, Helman E, McKenna A, Shen H, Zack T, Laird PW, Onofrio RC, Winckler W, Weir BA, et al. Absolute quantification of somatic DNA alterations in human cancer. Nat Biotechnol. 2012;30:413–21. 88. Hainaut P, Hernandez T, Robinson A, Rodriguez-Tome P, Flores T, Hollstein
M, Harris CC, Montesano R. IARC Database of p53 gene mutations in human
tumors and cell lines: updated compilation, revised formats and new visualisation tools. Nucleic Acids Res. 1998;26:205–13.
89. Sidransky D, Tokino T, Helzlsouer K, Zehnbauer B, Rausch G, Shelton B, Prestigiacomo L, Volgestein B, Davidson N. Inherited p53 gene mutations in breast cancer. Cancer Res. 1992;52:2984–6.
90. Network. CGA. Comprehensive molecular portraits of human breast tumours. Nature. 2012;490:61–70.
91. Hartmann A, Blaszyk H, McGovern RM, Schroeder JJ, Cunningham J, De Vries EM, Kovach JS, Sommer SS. p53 gene mutations inside and outside of exons 5-8: the patterns differ in breast and other cancers. Oncogene. 1995; 10:681–8.
92. Soussi T, Wiman KG. Shaping genetic alterations in human cancer: the p53 mutation paradigm. Cancer Cell. 2007;12:303–12.
93. Teda M, Teratani T, Komatsu Y, Kawabe T, Shiratori Y, Omata M. Quantitative analysis of ras gene mutation in pancreatic juice for diagnosis of pancreatic adenocarcinoma. DigDisSci. 1998;43:15–20.
94. Lee JC, Wang ST, Lai MD, Lin YJ, Yang HB. K-ras gene mutation is a useful predictor of the survival of early stage colorectal cancers. Anticancer Res. 1996;16:3839–44.
95. Nusko G, Sachse R, Mansmann U, Wittekind C, Hahn EG. K-RAS-2 gene mutations as predictors of metachronous colorectal adenomas. Scand J Gastroenterol. 1997;32:1035–41.
96. Buganim Y, Solomon H, Rais Y, Kistner D, Nachmany I, Brait M, Madar S, Goldstein I, Kalo E, Adam N, et al. p53 Regulates the Ras circuit to inhibit the expression of a cancer-related gene signature by various molecular pathways. Cancer Res. 2010;70:2274–84.
97. Von Lintig FC, Dreilinger AD, Varki NM, Wallace AM, Casteel DE, Boss GR. Ras activation in human breast cancer. Breast Cancer Res Treat. 2000;62:51–62. 98. Hokaiwado N, Asamoto M, Cho YM, Imaida K, Shirai T. Frequent c-Ha-ras
gene mutations in rat mammary carcinomas induced by 2-amino-1-methyl-6-phenylimidazo [4,5-b] pyridine. Cancer Lett. 2001;163:187–90.
99. Yanez L, Groffen J, Valenzuela DM. c-K-ras mutations in human carcinomas occur preferentially in codon 12. Oncogene. 1987;1:315–8.
100. Spandidos DA. Oncogene activation in malignant transformation: a study of H-ras in human breast cancer. Anticancer Res. 1987;7:991–6.
101. Biunno I, Pozzi MR, Pierotti MA, Pilotti S, Cattoretti G, Della PG. Structure and expression of oncogenes in surgical specimens of human breast
carcinomas. Br J Cancer. 1988;57:464–8.
102. Rochlitz CF, Scott GK, Dodson JM, Liu E, Dollbaum C, Smith HS, Benz CC. Incidence of activating ras oncogene mutations associated with primary and metastatic human breast cancer. Cancer Res. 1989;49:357–60. 103. Capella G, Cronauer-Mitra S, Pienado MA, Perucho M. Frequency and
spectrum of mutations at codons 12 and 13 of the c-K-ras gene in human tumors. Environ Health Perspect. 1991;93:125–31.
104. Miyakis S, Sourvinos G, Spandidos DA. Differential expression and mutation of the ras family genes in human breast cancer. Biochem Biophys Res Commun. 1998;251:609–12.
105. Ward R, Hawkins N, O’Grady R, Sheehan C, O’Connor T, Impey H, Roberts N, Fuery C, Todd A. Restriction endonuclease-mediated selective polymerase chain reaction: a novel assay for the detection of K-ras mutations in clinical samples. Am J. 1998;153:373–9.
106. Schondorf T, Andrack A, Niederacher D, Scharl A, Becker M, Engel H, Gohring UJ. H-ras gene amplification or mutation is not common in human primary breast cancer. Oncol Rep. 1999;6:1029–33.
107. World Medical Association. http://www.wma.net/en/30publications/ 10policies/b3/. Accessed 25 Feb 2016.