A systematic comparison of factors that could impact treatment recommendations for patients with Positional Obstructive Sleep Apnea (POSA)
Daniel J. Levendowski, MBA, Arie Oksenberg, PhD, Claudio Vicini, MD, Thomas Penzel, PhD, Mark Levi, BDS, Philip R. Westbrook, MD, Philip R. Westbrook, MD
PII: S1389-9457(18)30193-X
DOI: 10.1016/j.sleep.2018.05.012
Reference: SLEEP 3703
To appear in: Sleep Medicine
Received Date: 21 November 2017 Revised Date: 20 April 2018 Accepted Date: 16 May 2018
Please cite this article as: Levendowski DJ, Oksenberg A, Vicini C, Penzel T, Levi M, Westbrook PR, Westbrook PR, A systematic comparison of factors that could impact treatment recommendations for patients with Positional Obstructive Sleep Apnea (POSA), Sleep Medicine (2018), doi: 10.1016/ j.sleep.2018.05.012.
This is a PDF file of an unedited manuscript that has been accepted for publication. As a service to our customers we are providing this early version of the manuscript. The manuscript will undergo copyediting, typesetting, and review of the resulting proof before it is published in its final form. Please note that during the production process errors may be discovered which could affect the content, and all legal disclaimers that apply to the journal pertain.
M
AN
US
CR
IP
T
AC
CE
PT
ED
1 1. IntroductionObstructive sleep apnea (OSA) treatment recommendations are typically based on the Apnea Hypopnea Index (AHI) severity and the degree to which the clinician believes the patient will benefit from the therapy. Continuous positive airway pressure (CPAP), for example, resolves OSA if the pressure and mask are properly selected, and the patient uses it. Non- CPAP therapies, typically recommended for those with mild or moderate OSA, or patients who do not or cannot use CPAP, generally provide a less
efficacious and a more variable therapeutic response.1 For patients with positional OSA (POSA), the new generation of positional therapy (PT) devices (i.e., vibrotactile feedback to neck or chest) hold promise, based on efficacy and improved compliance, compared to the traditional positional restraints (i.e., using tennis-balls) when used alone or potentially when used in combination with oral appliance therapy. 2-5
The proportion of OSA patients who might benefit from PT is estimated to range 56% to 75% depending on supine and non-supine sleep disordered breathing (SDB) severity and time spent in the supine position, as well as age, ethnicity, the definition used to score hypopneas, and the criteria used to characterize POSA.2,3,6-8 The first to fully characterize the influence of sleeping position on OSA severity was Cartwright, who defined POSA patients as those who had a supine AHI at least twice that in the non-supine position.9 Oksenberg et al. were the first to assess the prevalence and characteristics of patients with POSA
[positional patients (PP)) and patients whose OSA was considered non-positional (NPP)], using the Cartwright definition, in a population of patients referred to a Sleep Unit.6 Mador et al. suggested that those with POSA should meet the Cartwright criterion but also have a non-supine AHI < 5/h10, while Marklund et al. selected a less rigorous non-supine criteria of AHI < 10/h11. Bignold et al. was the first to couple a minimum amount of time (i.e., 20 min) in the supine and non-supine positions with the
M
AN
US
CR
IP
T
AC
CE
PT
ED
2Classification (APOC) criterion was created to facilitate the identification of suitable candidates for PT. This approach provided a differentiation between what they called “true positional patients”, that is those who would be “cured” by avoiding supine sleep, and “true non-positional patients" , those whose AHI was uninfluenced by position, as well as multifactorial patients whose OSA severity is influenced in part by sleep position (including those with diagnosed with severe overall OSA).13,14 In an effort to increase the likelihood that selected patients would achieve at least a 50% reduction in overall AHI if supine sleep was avoided, Levendowski et al. introduced the POSA definition whereby the overall AHI needed to be at least 1.5 times the non-supine (NS) severity (Overall/NS-AHI).2
In summary, Cartwright, Bignold, and Levendowski introduced POSA criteria which attempted to detect those most likely to experience important reductions in overall OSA severity if supine sleep were avoided. Mador and Marklund applied a more strict definition by which PP were essentially cured if they were adherent to PT. APOC attempted to achieve both objectives, i.e., identify patients who would be either cured or who might obtain significant reductions in OSA severity if PT was successful. While Cartwright (without minimum supine and non-supine sleep time) is the most commonly referenced POSA criterion, none of these definitions have gained universal acceptance as the‘standard’ for the identification of patients who would likely benefit from positional therapy. Further complicating the comparative benefit of these POSA criteria is the impact changes in the American Academy of Sleep Medicine (AASM) 2007 vs. 2012 scoring rules had on OSA prevalence.8
This study systematically compares four POSA criteria based on the AASM 2007 and 2012 guidelines for scoring abnormal breathing events. First, we explore differences in predicted POSA prevalence. Second, we investigate differences in the identification of POSA based on expected reductions in OSA severity with PT.
M
AN
US
CR
IP
T
AC
CE
PT
ED
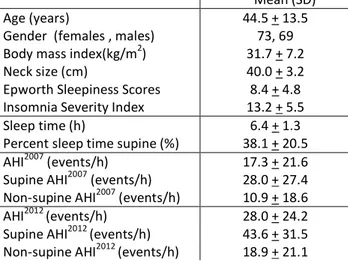
3 2. Methods: 2.1 Data selectionA retrospective analysis of 242 unattended polysomnography (PSG) recording consecutively acquired between November 1, 2016 and May 31, 2017 at a single clinical practice was approved by the Biomed IRB (San Diego, CA). To control variability between sleep and recording time, 27 records with recording time < 5.5 h and two records with < 2 h of sleep time were excluded. To be consistent with APOC criterion, 23 studies with supine time < 10%, 9 records with NS time <10%, and 20 records with an AHI <5 based on the AASM2012 hypopnea criteria were excluded. Nineteen records with no airflow for >15% of the night were excluded to control AHI variability resulting from excessive technician editing (i.e., required extensive manual insertion of hypopneas). As a result, 96 records with an AHI2007 >5 and 142 records with an AHI2012 >5 were analyzed (see Table 3 for demographic data).
2.2 Data acquisition
Recordings were made using the Sleep Profiler-PSG2TM (Advanced Brain Monitoring, Carlsbad, CA, USA), a system which acquired three channels of electroencephalography, electroocular, and electromyography activity from frontopolar sites, airflow using a nasal cannula and pressure transducer, head
movement/position by actigraphy, snoring with an acoustic microphone, pulse from the forehead and finger, wireless wrist oximetry, and thorax and abdomen effort by respiratory induced plethysmography. Prior to sending the patient home with the device, the effort belts and headband were adjusted by the technician while subjects watched an instructional video. Subjects then practiced applying the Sleep Profiler-PSG2 before taking it home with instructions to wear it for a minimum of 8 h. When the device was turned on, voice messages assisted the subjects to ensure that all of the sensors were properly
M
AN
US
CR
IP
T
AC
CE
PT
ED
4applied. During the night, voice messages were delivered whenever the oximeter finger probe fell off or up to four times per night when the cannula was not properly seated in the nares.
2.3 Scoring
The recordings were uploaded to the Sleep Profiler portal where automated algorithms were applied to the signals. For this study AHI2007 was based on the AASM 2007 scoring rules requiring hypopneas to be confirmed with a minimum 4% desaturation, while the AHI2012 was based on the AASM 2012 rules requiring hypopneas to be confirmed with either a 3% desaturation or a cortical arousal.15 Auto-staging was performed using previously described techniques that relied on the ratios of the power spectral densities and auto-detection of cortical and micro-arousals, sleep spindles, and ocular activity.16 The airflow signal was analyzed using automated algorithms that detect apneas based on a 90% reduction in airflow and hypopneas based on a 30% reduction of flow volume. The SpO2 signal was analyzed to detect both 3% and 4% desaturations which were combined with the airflow signal for detection of hypopneas. After the studies were processed, an independent focused review of the home full disclosure recordings was conducted by the same technician to confirm accuracy of the auto-sleep staging and auto-detection of apnea/hypopnea events.17, 18
2.4 Data analysis
The four POSA criteria used in this study are summarized in Table 1. The inclusion criteria satisfied the APOC criterion for an overall severity > 5 with more than 10% of total sleep time (TST) in both best sleeping position (BSP) and worst sleeping position (WSP). The characterization of POSA by APOC criteria additionally required one of three rules to be satisfied. The APOC-I rule required the BSP AHI to be less than 5. APOC-II required the BSP severity to fall in a lower AHI severity category than the overall AHI. APOC-III required the AHI in the BSP to be at least 25% lower than the overall AHI in those with an overall
M
AN
US
CR
IP
T
AC
CE
PT
ED
5AHI > 40. The Cartwright criterion required the supine AHI to be at least two times greater than the supine AHI. The Mador criterion applied the Cartwright rule with the additional requirement that the non-supine AHI must be < 5. The Overall/NS-AHI criterion applied in this study required the overall AHI to be at least 1.4 times the non-supine AHI and at least 20 min in both supine and non-supine sleep.
--- Insert Table 1
---
Pearson correlations were used to evaluate the relationships between Cartwright vs. Overall/NS-AHI ratios, the two criteria that provided continuous measures reflecting the impact supine sleep had on the overall OSA severity. To minimize the influence of outliers on the correlation analysis, AHI between zero and one were assigned a value of one prior to computing the Cartwright and Overall/NS-AHI ratios.
Conventional clinical cutoffs for mild (AHI 5 - 14), moderate (15 – 29) and severe (>30) OSA were applied. The sensitivity, specificity, positive predictive value (PPV) and negative predictive value (NPV) of the four POSA criteria were computed by comparison to four reference standards, i.e., the overall AHI would decrease by 25%, 35%, 50%, or 75% if the BSP was maintained for the entire night. The 25% reference standard was selected as the minimum clinical threshold because it was recognized by the APOC criterion as a potentially important change in overall AHI that may benefit patients with POSA. The 50% reduction in overall AHI has been conventionally used as a minimum response criterion to an OSA therapeutic intervention. The 35% and 75% thresholds were included for a broader compare/contrast analysis.
Rater operator curves (ROC) were derived for all criteria by the AASM scoring method applying clinical cut-offs (i.e., minimum AHI percent improvement) ranging from 10 to 90%. Two-tailed, Fisher exact
Chi-M
AN
US
CR
IP
T
AC
CE
PT
ED
6squared analyses were used to evaluate significant changes in the distributions of overall POSA by and across POSA criteria and AHI2007 and AHI2012 scoring rules.
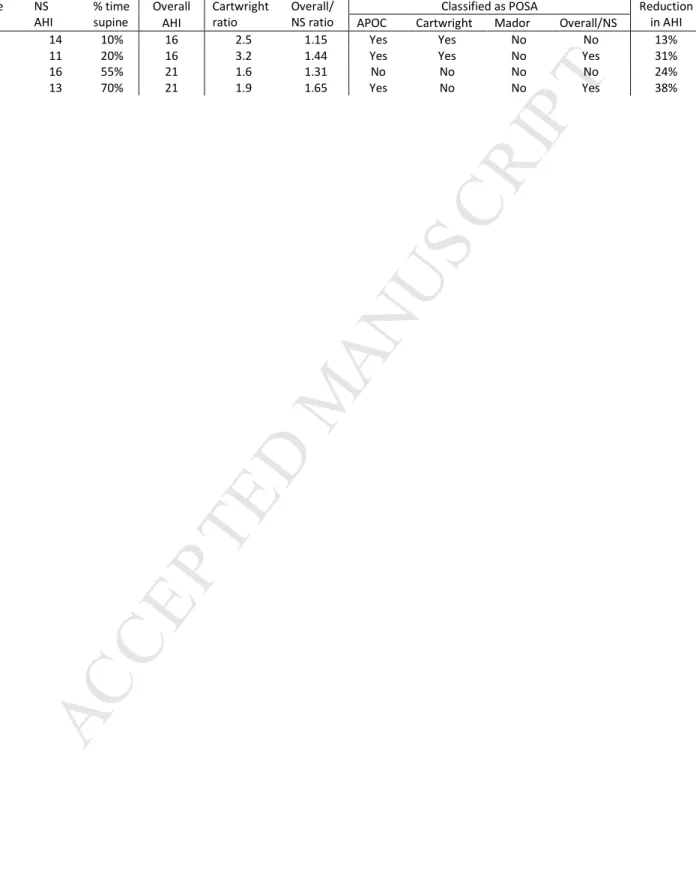
Table 2 presents four hypothetical cases to demonstrate differences in the POSA criteria which could result from different combinations of supine severity and supine time when the overall AHI severity is moderate. False positive and false negative finding are dependent on the POSA classification and the expected percent reduction in overall AHI. In the first example, a POSA classification of “yes” would result in a false positive result based on an 13% reduction in overall AHI when compared to a 25% reference value. --- Insert Table 2 --- 3. Results --- Insert Table 3 ---
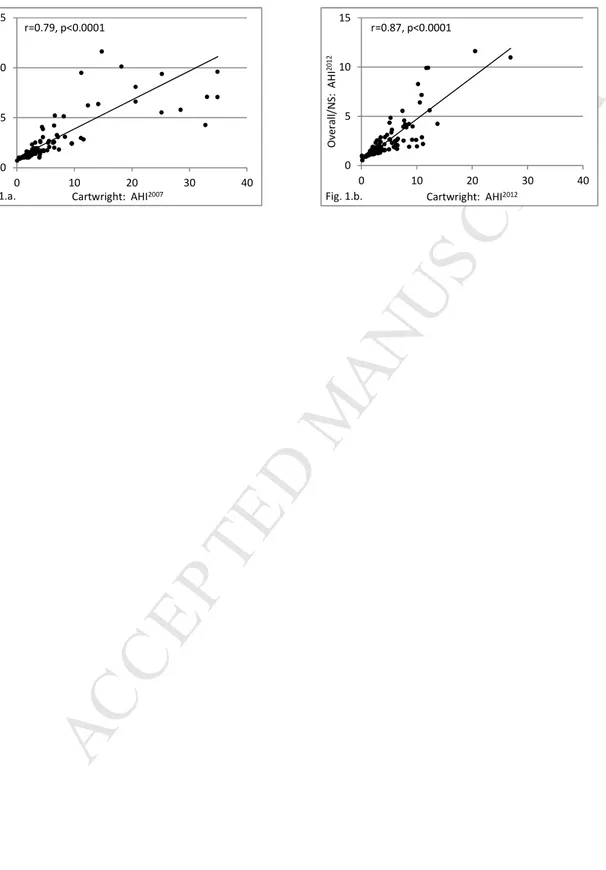
3.1 Association between continuous estimates of POSA severity
The concordance between the Cartwright and Overall/NS-AHI ratios strengthened with the AHI2012 scoring rules due to greater numbers of detected hypopnea events.
--- Insert Figure 1
M
AN
US
CR
IP
T
AC
CE
PT
ED
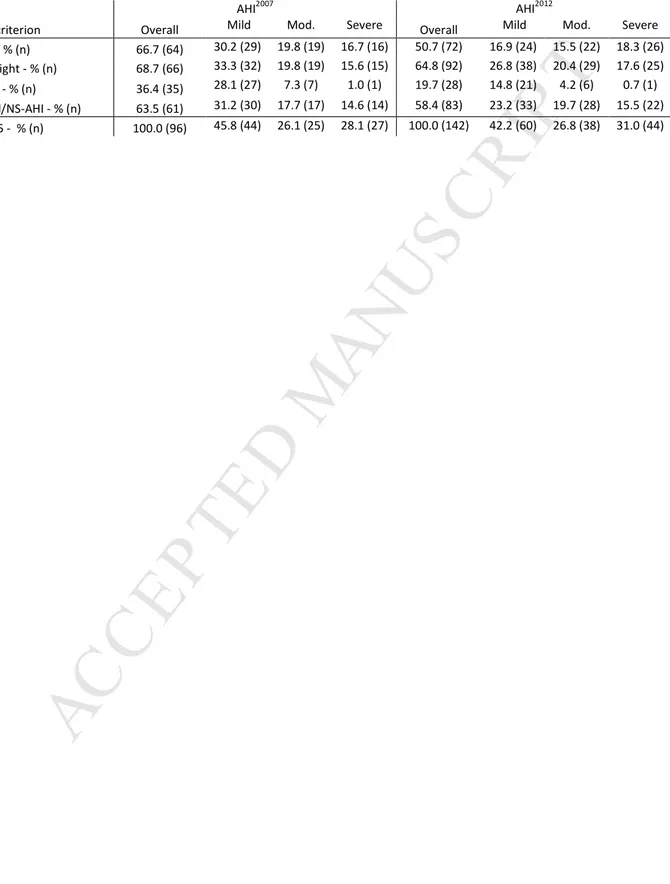
7 3.2 POSA prevalenceTable 4 presents the predicted prevalence of patients with POSA by criteria in records with > 5 events/h by and across OSA severities. The change in scoring rules from AHI2007 to AHI2012 increased the number of patients identified with at least mild SDB by ~50% (i.e., 96 vs. 142). APOC, Cartwright, and Overall/NS-AHI identified similar percentages of patients with overall POSA based on AHI2007. Looking across the scoring rules, the proportion of those characterized with POSA remained similar for the Cartwright and the Overall/NS-AHI criteria, while APOC identified 16% less prevalence of POSA based on AHI2012 rules vs. AHI2007 (p < 0.05). Mador identified significantly less POSA compared to the other criteria (p<0.01) for both AHI2007 and AHI2012. The proportion of patients identified with moderate and severe POSA by APOC, Cartwright, and Overall/NS-AHI criteria for both AHI2007 and AHI2012 were similar. The POSA prevalence for APOC I, II and III was 39%, 21%, and 7% respectively for AHI2007, and 22%, 23%, and 6%, respectively for AHI2012. Of the 46 patients with an AHI2007< 5 and an AHI2012> 5, only 52% were classified as APOC I.
--- Insert Table 4
---
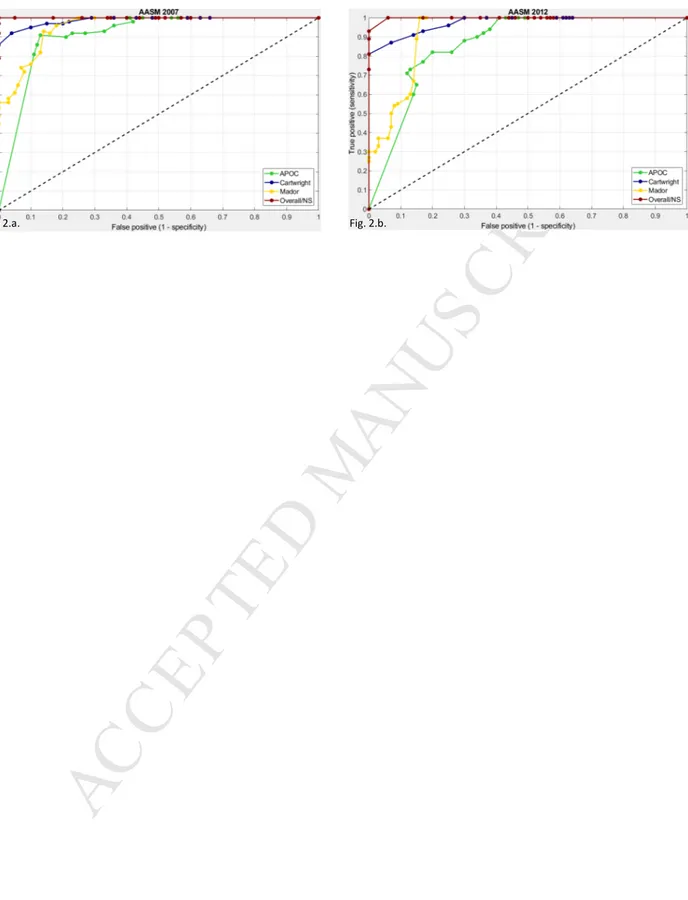
3.3 Detecting the influence of supine sleep on overall OSA severity
The sensitivities and specificities computed for reference standards ranging from 10% to 90% (i.e., expected reductions in overall AHI if supine sleep is avoided) were used to compute rater operator curves presented in Figure 2. For the AHI2007, the areas under the curve were Overall/NS-AHI = 1.0, Cartwright = 0.99, Mador = 0.95, and APOC = 0.91 (Figure 2.a.). For the AHI2012, the areas under the curve for
M
AN
US
CR
IP
T
AC
CE
PT
ED
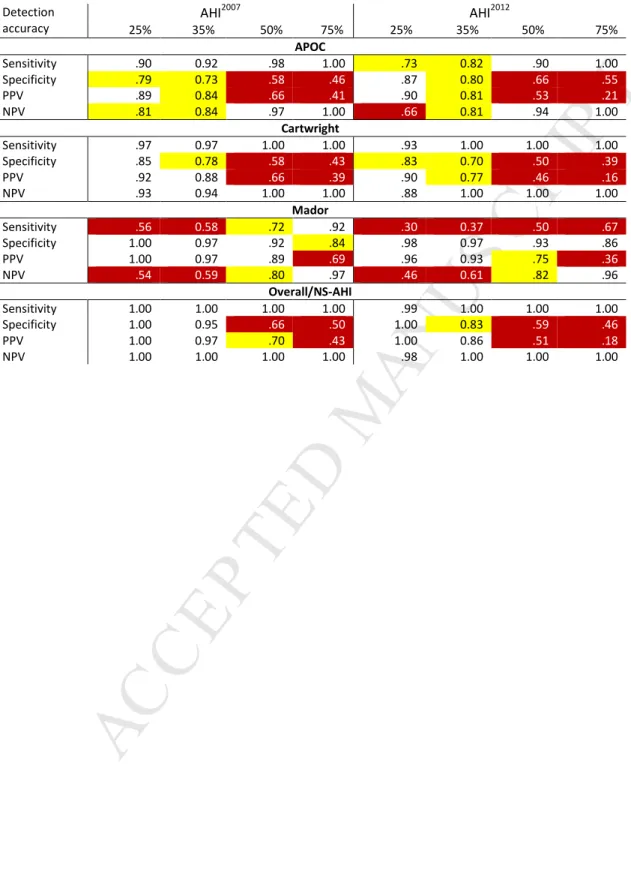
8 --- Insert Figure 2 ---Table 5 highlights the differences in POSA criteria performance with respect to identifying those who would be expected to achieve a 25%, 35%, 50%, and 75% reduction in overall severity if the proportion of supine sleep found on the diagnostic recording was avoided.
--- Insert Table 5
---
The APOC, Cartwright, and Overall/NS criteria exhibited relatively high sensitivity and NPV coupled with a gradual drop in specificity and PPV as the reference values increased. Conversely, Mador showed a
relatively high and stable specificity and PPV, with gradual increase in sensitivity and NPV as the reference values increased. When a 25% or 35% reduction in overall AHI was targeted, the Overall/NS-AHI criterion provided the greatest number of accuracy measures above 0.85.
4. Discussion
The impact of the AASM scoring rules on the prevalence of POSA was highly dependent on the POSA criteria. Although the number of positional patients increased by 50% as a result of the new definition of hypopneas, POSA prevalence was approximately 60% by Cartwright and Overall/NS-AHI criteria in patients with at least mild OSA by both AHI2007 and AHI2012. Conversely, a 16% drop in POSA prevalence for AHI2012 was observed with the Mador and APOC criteria resulting from fewer patients being identified with a NS
M
AN
US
CR
IP
T
AC
CE
PT
ED
9AHI < 5 (i.e., no longer satisfied Mador or APOC-I) and/or the BSP and WSP AHI being >5 and< 15 events/h so APOC II was not satisfied.
In addition to the ROC plots, a range of reference standards were selected to assess differences in the capability of the POSA criteria to identify those who would likely achieve substantial reductions in SDB if the supine position was avoided. The Overall/NS-AHI was superior in identifying those who would likely achieve important reductions in their overall AHI with supine avoidance, with near perfect accuracy at the reference value of 25% and substantially stronger area under the curve (Fig. 2). Virtually all of the
presumed “false-positive” classifications at reference values of 35%, 50% and 75% still reported at least a 25% reduction in overall AHI2012. In contrast, 25% of the Cartwright false-positive cases, 40% of the APOC false-positive cases, and 70% of the Mador false-positive cases would resulted in overall AHI reductions <25% assuming supine sleep was avoided. While the vast majority of the Cartwright misclassification was false positive cases, the APOC criterion generated both type I and II errors. The Mador criterion proved specific but because it required NS AHI < 5 (i.e., similar to what might be obtained with CPAP if adherence was optimal), it was insensitive to the identification of many patients who might benefit from PT.
Although PT is generally recommended only for those with mild and moderate OSA, the APOC, Cartwright and Overall/NS-AHI found a similar proportion of those with moderate and severe OSA were strongly influenced by sleeping position. While it is unlikely the NS AHI2012 will resolve into the normal range for those with severe POSA, further studies are needed to evaluate the degree to which patients with severe POSA who fail or refuse CPAP benefit from PT, or PT in combination with oral appliance therapy.
The four POSA criteria evaluated for the characterization of POSA were selected because each could be applied to all records (i.e., the Marklund criterion would have required records with a BSP AHI between 5
M
AN
US
CR
IP
T
AC
CE
PT
ED
10and 10 to be excluded). The Mador criterion is considereda stricter definition of POSA because it identifies those patients who would be cured if they avoid the supine position. The APOC criterion expanded the definition of POSA to include those patients with OSA disproportionately impacted by supine sleep, arguing that these patients would improve with the use of PT and/or might benefit from PT in combination with other OSA therapies. The Cartwright and the Overall/NS-AHI criteria, on the other hand, are easy to compute ratios that provide continuous measures reflecting the impact supine sleep had on the overall OSA severity. The minimum 10% of TST in both the BSP and WSP, a requirement of APOC, reduced the number of false positive assignments made by the Cartwright ratio when very short supine or non-supine sleep times were encountered. This approach would still result in an incorrect assignment of POSA due to an insufficient allocation of diagnostic time across both best and worst sleeping position, a common occurrence in split-night PSG studies. While the concordance between Overall/NS-AHI and Cartwright criteria was high, the performance of the Cartwright criterion benefitted from elimination of studies with less than 10% of sleep time in the BSP and WSP. The Overall/NS-AHI criterion, on the other hand, incorporates positional sleep time into the POSA criterion because the overall AHI cannot
mathematically exceed the non-supine severity by 1.4 without appropriate combinations of severity and/or minimum amount of time (i.e., ~20 min) in the BSP and WSP. This 20 min window is equivalent to the 10% minimum proposed by APOC when TST exceeds 3.3 h. The results from this study support the change to a POSA criterion that readily and accurately incorporates the impact of both supine severity and supine sleep time in the identification of patients with POSA who might benefit from supine sleep
avoidance.
The assumption that POSA can be predicted by Overall/NS-AHI and that the AHI would be effectively reduced when supine sleep is avoided was prospectively demonstrated in a four-week evaluation of vibrotactile PT.2 In this study of 30 patients, the Overall/NS-AHI criterion was applied to the diagnostic
M
AN
US
CR
IP
T
AC
CE
PT
ED
11PSG-AHI2007 (minimum 4 hours of PSG-TST) with sleeping position measured at the torso. Ninety-percent of these positional patients showed at least a 35% reduction in total AHI and the median reduction was 79% when supine sleep was restricted. We subsequently reported that after 30-days of PT therapy the diagnostic NS AHI was stable within 5 events/h in 67% of the patients, decreased in 20%, and increased in 13% of the cases.19 These findings suggest the Overall/NS-AHI criterion may reasonably estimate a
treatment response to the new generation of PT in over 85% of patients. In the FDA submission study, the Overall-NS-AHI threshold of 1.5 was used because it was imperative that enrolled patients would achieve at least a 50% reduction in the overall AHI if the PT was effective. An Overall/NS-AHI threshold of 1.4 was selected for this study because it provided a more balanced sensitivity and specificity distribution. A shift in the Overall/NS-AHI criterion clinical cut-off to a higher value simply increases the minimum required supine sleep time and/or severity.
One limitation of this study is that the criteria comparisons were not made using conventional laboratory PSG. In a previous report comparing the auto-scoring to simultaneously recorded, manually scored laboratory PSG, the sensitivities and specificities using clinical cutoffs of overall AHI2007 >5 and >10
events/h were 0.98 vs. 0.85 and 0.94 vs. 0.96, respectively.17 Given the accuracy of frontopolar EEG in the detection of sleep time was 87% vs. PSG16, and the airflow algorithm was applied in both AHI2007 and AHI2012, differences in hypopnea recognition in this study were limited to the automated detection of desaturations and/or auto-scored arousals.
Another limitation was sleeping position was measured from the forehead rather than the conventional approach of measuring torso/body position during PSG. When compared to PSG and body position, head position plus auto-scored SDB events provided supine sensitivities and specificities of 0.93 vs. 0.72 and 0.96 vs. 0.90, respectively, for AHI2007 >5 and >10.17 Further, there was a low likelihood that the
M
AN
US
CR
IP
T
AC
CE
PT
ED
12characterization of mild, moderate and severe supine and non-supine OSA was biased by the use of head position given the algorithm that detected transitions from supine to lateral based on an extremely difficult to achieve head angle without an accompanying trunk rotation.
If the measurement of head vs. body position, or the use of in-home rather than laboratory PSG resulted in a significant measurement bias, it’s unlikely the POSA prevalence based on the Cartwright criterion in this study would have been similar to the prevalence observed using laboratory PSG-based AHI2007 (i.e., 69% vs. 64%, respectively).13 Additionally, the distributions of head position-based APOC 1, 2, and 3 for AHI2007 in this study were very similar to those reported by Raveslootet al. based on PSG and body position.14 Further the overall AHI2012APOC-based POSA prevalence in this study was similar to Duce (i.e., 51% vs. 49%).20 There were differences between the APOC distributions in this study vs. Duce,but similar to what was reported when comparing to Ravesloot et al. Duce and colleagues reported 14% of his cohort satisfied AHI2007APOC II or III criteria, while Ravesloot and this study reported 32% and 28%, respectively. Consistent with theAHI2007 results, 29% of our cohort satisfied AHI2012APOC II or III criteria vs. 9% for Duce et al. These results suggest the reported differences in POSA prevalence and criteria accuracy were reasonably estimated.
While the likelihood that the sources of differences in POSA prevalence and criteria accuracy were
reasonably estimated, this study points to a number of research applications that could be explored. First, this study should be repeated using manual scoring by the two guidelines to confirm the reported
differences in POSA criteria. Investigations are needed to evaluate the minimum sleep time needed to characterize POSA taking into consideration the influence of REM sleep. Studies are needed to confirm these results and demonstrate generalization of the Overall/NS-AHI criterion using different position sensors and from different body locations.2,17,21-23 Because recordings were made for only one night,
M
AN
US
CR
IP
T
AC
CE
PT
ED
13further studies are needed to determine if the detection accuracy obtained with the Overall/NS-AHI criterion is impacted by night-to-night variability in OSA severity and sleeping position.24,25 Finally, strong evidence has demonstrated that the new generation of PT devices are effective in reducing the AHI in the short term,and because these devices can monitor PT compliance, evidence of long term effectiveness is growing.3,5,26-27 Future investigations are also needed todetermine if POSA characteristic and/or criterion can be used to identify those who are more likely to be long term compliant with these new generation PT devices.28,29
This study provided a systematic comparison of methods that characterize POSA in an effort to improve the identification of those who would likely benefit from PT. The application of any threshold-based POSA-detecting criteria is somewhat artificial as compared to a trial that included a full range of snorers all the way up to those with the most severe OSA, and results in defining characteristics which allow
clinicians to give accurate advice about the chance of therapeutic success. Like CPAP, a PT trial requires an allocation of resources, thus it would be preferable to identify a priori those most likely to benefit from the therapy. It could also be argued that because clinicians are trained to interpret diagnostic studies and make treatment recommendations for OSA using threshold-based severity criteria, simple rules or guidelines that fit into that model are needed for a PT trial to be considered. Reliable identification of those with moderate and severe position-influence OSA is needed for expanded use of PT in combination with other therapies. Finally, selection of positional patients that increases the odds of PT response is needed in the design of cost-effective healthcare coverage policies that optimize patient access to care.
M
AN
US
CR
IP
T
AC
CE
PT
ED
14The authors wish to thank Ali Maree Davies for her efforts in acquisition of the PSG2 records, Yeshan Ekanayake his assistance in the editing the PSG2 signals, MarijaStevanovic-Karic for her statistical support, and Dr. Peter Cistulli and Dr. Marcello Bosi for their manuscript recommendations and edits.
References
1. Epstein LJ, Kristo D, Strollo PJ et a. Clinical guidelines for the evaluation, management and long-term care of obstructive sleep apnea in adults. JCSM 2009; 5(3):263-276.
2. Levendowski DJ, Seagraves S, Popovic D, et al. Assessment of a neck-based treatment and monitoring device for positional obstructive sleep apnea. J Clin Sleep Med 2014; 10(8):863-871. 3. Ravesloot MJL, White D, Heinzer R et al. Efficacy of the new generation of devices for positional
therapy for patients with positional obstructive sleep apnea: a systematic review of the literature and meta-analysis. J Clin Sleep Med 2017; 13(6):813-824.
4. Dieltjens M, Vroegop AV, Verbuggen AE, et al. A promising concept of combination therapy for positional obstructive sleep apnea. Sleep Breath,2015; 19(2): 637-644.
5. Benoist L, de Ruiter M, de Lange J, et al. A randomized, controlled trial of positional therapy versus oral appliance therapy for position-dependent sleep apnea. Sleep Med 2017; 34:109-117.
6. Oksenberg A, Silverberg DS, Arons E, et al. Positional vs nonpositional obstructive sleep apnea patients. Anthropomorphic, nocturnal polysomnographic and multiple sleep latency test data.
Chest 1997; 112: 629–39.
7. Oksenberg A, Gadot N. Positional patients (PP) and Non Positional patients (NPP) are two dominant phenotypes that should be included in the phenotypic approaches to Obstructive Sleep Apnea.
M
AN
US
CR
IP
T
AC
CE
PT
ED
158. Duce B, Kulkas A, Langton C, et al.The AASM 2012 recommended hypopnea criteria increase the incidence of obstructive sleep apnea but not the proportion of positional obstructive sleep apnea.
Sleep Med 2016; 26:23-29.
9. Cartwright RD. Effect of sleep position on sleep apnea severity. Sleep 1984; 7:110-114. 10. Mador MJ, Kufel TJ, Magalang UJ, et al. Prevalence of positional sleep apnea in patients
undergoing polysomnography. Chest 2005, 128(4):2130-7.
11. Marklund M, Persson M, Franklin KA. Treatment success with a mandibular advanced device is related to supine-dependent sleep apnea. Chest 1998, 114(6):1630-5.
12. Bignold JJ, Mercer JD, Antic NA, et al. Accurate position monitoring and improved
supine-dependent obstructive sleep apnea with a new position recording and supine avoidance device. J
Clin Sleep Med 2011;7(4):376-383.
13. Frank MH, Ravesloot MJL, van Maanen JP, et al. Positional OSA part 1: towards a clinical classification system for position-dependent obstructive sleep apnoea. Sleep Breath 2015 19(2):473-480.
14. Ravesloot MJL, Frank MH, van Maanen JP, et al. Positional OSA part 2: retrospective cohort analysis with a new classification system (APOC). Sleep Breath 2016, 20(2):881-888.
15. Berry RB, Budhiraja R, Gottlieb DJ, et al. Rules for scoring respiratory events in sleep: Update on the 2007 AASM manual for scoring of sleep and associated events. J Clin Sleep Med 2012; 8(5):597-619.
16. Levendowski DJ, Ferini-Strambi L, Gamaldo C, et al. The accuracy, night-to-night variability, and stability of frontopolar sleep electroencephalography biomarkers. J Clin Sleep Med 2017; 13(6):791-803.
M
AN
US
CR
IP
T
AC
CE
PT
ED
1617. Levendowski DJ, Henninger D, Smith J, et al. Non-inferiority between the overall and REM-related apnea-hypopnea indexes obtained by polysomnography and a forehead worn, auto-scored system.
Sleep 2016; 39:A380
18. Levendowski DJ, Dawson D, Levi M, et al. Agreement between auto-scored vs. edited unattended in-home polysomnography. Sleep Medicine2017;40:89
19. Levendowski DJ. Delivery and monitoring of positional therapy for obstructive sleep apnea. Presented to the Scripps Viterbi Family Sleep Conference, July 17, 2015, La Jolla, CA. https://advancedbrainmonitoring.app.box.com/s/t67c9n5414fjsovs9y2oj4xg0axahr12 20. Duce B, Kulkas A, Langton C et al. Amsterdam positional OSA classification: the 2012 AASM
recommended hypopnea criteria increases the number of positional therapy candidates. Sleep
Breath 2017; 21(6):411-417.
21. van Kestersen ER, van Maanen JP, Hilgevoord AAJ, et al. Quantitative effects of truck and head position on the apnea hypopnea index in obstructive sleep apnea. Sleep 2011; 34(8):1075-1081. 22. Zhu K, Bradley TD, Patel M, et al. Influence of head position on obstructive sleep apnea severity.
Sleep Breath 2017; 21(4):821-828.
23. Levendowski DJ, Veljkovic B, Seagraves S, et al. Capability of a neck worn device to measure sleep/wake, airway position, and differentiate benign snoring from obstructive sleep apnea. J Clin Monit Comput 2015; 29:53-64.
24. Levendowski D, Steward D, Woodson BT, et al. In the impact of obstructive sleep apnea variability measured in-lab versus in-home on sample size calculations. Intl Arch Med 2009; 2:2.
25. Stoberl AS, Schwarz EL, Haile SR, et al. Night-to-night variability of obstructive sleep apnea. J Sleep
Res 2017; DOI 10.1111/jsr.12558.
26. Laub RR, Tonnesen P, Jennum PJ. A Sleep Position Trainer for positional sleep apnea; a randomized, controlled trial. J Sleep Res 2017; 26(5):641-650.
M
AN
US
CR
IP
T
AC
CE
PT
ED
1727. Levendowski D, Cunnington D, Swieca J, et al. User compliance and behavioral adaption associated with supine avoidance therapy. Behav Sleep Med 2018; 16(1):27-37.
28. Oksenberg A. Positional therapy for sleep apnea: a promising behavioral therapeutic option still waiting for qualified studies. Sleep Med Rev2014;18:3–5.
29. Oksenberg A, Gadoth N. Breathe well, sleep well: avoid the supine and adopt the lateral posture.
M
AN
US
CR
IP
T
AC
CE
PT
ED
18 Figure Legends:Figure 1. Scatter plot of the ratios obtained from the supine divided by the non-supine severity (Cartwright)and the overall AHI divided by non-supine severity (Overall/NS-AHI) for a.AHI2007 and b. AHI2012.
Figure 2. Rater Operator curves based on reference standards ranging from a 10% to 90% improvement in overall AHI (assuming supine sleep is avoided) for the four criteria for a.AHI2007 and b. AHI2012.
M
AN
US
CR
IP
T
AC
CE
PT
ED
Table 1: Summary comparison of the POSA criteria Supine / NS AHI Min Non-supine AHI Change in AHI severity % Time Supine and NS Overall / NS AHI
APOC APOC I < 5 APOC II and III > 10%
Cartwright > 2.0
Mador > 2.0 < 5
M
AN
US
CR
IP
T
AC
CE
PT
ED
Table 2: Comparison of POSA criteria for two hypothetical cases with moderate OSA achieved with different combinations of supine AHI and the % time supine
Supine AHI NS AHI % time supine Overall Cartwright ratio Overall/ NS ratio
Classified as POSA Reduction
in AHI
AHI APOC Cartwright Mador Overall/NS
35 14 10% 16 2.5 1.15 Yes Yes No No 13%
35 11 20% 16 3.2 1.44 Yes Yes No Yes 31%
25 16 55% 21 1.6 1.31 No No No No 24%
M
AN
US
CR
IP
T
AC
CE
PT
ED
Table 3: Demographic and sleep data for the 142 subjects Mean (SD)
Age (years) 44.5 + 13.5
Gender (females , males) 73, 69
Body mass index(kg/m2) 31.7 + 7.2
Neck size (cm) 40.0 + 3.2
Epworth Sleepiness Scores 8.4 + 4.8
Insomnia Severity Index 13.2 + 5.5
Sleep time (h) 6.4 + 1.3
Percent sleep time supine (%) 38.1 + 20.5
AHI2007 (events/h) 17.3 + 21.6
Supine AHI2007 (events/h) 28.0 + 27.4
Non-supine AHI2007 (events/h) 10.9 + 18.6
AHI2012 (events/h) 28.0 + 24.2
Supine AHI2012 (events/h) 43.6 + 31.5
M
AN
US
CR
IP
T
AC
CE
PT
ED
Table 4: The distribution of POSA by criteria and AHI severity for records with AHI > 5 events/hour
AHI2007 AHI2012
POSA criterion Overall Mild Mod. Severe Overall Mild Mod. Severe
APOC - % (n) 66.7 (64) 30.2 (29) 19.8 (19) 16.7 (16) 50.7 (72) 16.9 (24) 15.5 (22) 18.3 (26)
Cartwright - % (n) 68.7 (66) 33.3 (32) 19.8 (19) 15.6 (15) 64.8 (92) 26.8 (38) 20.4 (29) 17.6 (25)
Mador - % (n) 36.4 (35) 28.1 (27) 7.3 (7) 1.0 (1) 19.7 (28) 14.8 (21) 4.2 (6) 0.7 (1)
Overall/NS-AHI - % (n) 63.5 (61) 31.2 (30) 17.7 (17) 14.6 (14) 58.4 (83) 23.2 (33) 19.7 (28) 15.5 (22)
M
AN
US
CR
IP
T
AC
CE
PT
ED
Table 5: Detection accuracies for each POSA criteria across range of reference values from 25% to 75% for the two AHI measures with accuracy values and highlighted.
Detection accuracy AHI2007 AHI2012 25% 35% 50% 75% 25% 35% 50% 75% APOC Sensitivity .90 0.92 .98 1.00 .73 0.82 .90 1.00 Specificity .79 0.73 .58 .46 .87 0.80 .66 .55 PPV .89 0.84 .66 .41 .90 0.81 .53 .21 NPV .81 0.84 .97 1.00 .66 0.81 .94 1.00 Cartwright Sensitivity .97 0.97 1.00 1.00 .93 1.00 1.00 1.00 Specificity .85 0.78 .58 .43 .83 0.70 .50 .39 PPV .92 0.88 .66 .39 .90 0.77 .46 .16 NPV .93 0.94 1.00 1.00 .88 1.00 1.00 1.00 Mador Sensitivity .56 0.58 .72 .92 .30 0.37 .50 .67 Specificity 1.00 0.97 .92 .84 .98 0.97 .93 .86 PPV 1.00 0.97 .89 .69 .96 0.93 .75 .36 NPV .54 0.59 .80 .97 .46 0.61 .82 .96 Overall/NS-AHI Sensitivity 1.00 1.00 1.00 1.00 .99 1.00 1.00 1.00 Specificity 1.00 0.95 .66 .50 1.00 0.83 .59 .46 PPV 1.00 0.97 .70 .43 1.00 0.86 .51 .18 NPV 1.00 1.00 1.00 1.00 .98 1.00 1.00 1.00 >.70 and <.85 < .70
M
AN
US
CR
IP
T
AC
CE
PT
ED
0 5 10 15 0 10 20 30 40 O ve ra ll/ N S : A H I 2 0 0 7 Cartwright: AHI2007 0 5 10 15 0 10 20 30 40 O ve ra ll/ N S : A H I 2 0 1 2 Cartwright: AHI2012 r=0.79, p<0.0001 r=0.87, p<0.0001M
AN
US
CR
IP
T
AC
CE
PT
ED
M
AN
US
CR
IP
T
AC
CE
PT
ED
Highlights:POSA prevalence was 20-69% depending on the criterion and AASM scoring rules Overall/NS-AHI and Cartwright identified similar prevalences by 2007 and 2012 rules Correlations between Overall/NS-AHI and Cartwright ratios ranged from 0.79 and 0.87 The Overall/NS-AHI was superior to Cartwright, APOC and Mador criteria in accuracy