Received: March 17, 2017. Accepted: May 25, 2017. Pre-published: May 26, 2017.
©2017 Ferrata Storti Foundation
Material published in Haematologica is covered by copyright. All rights are reserved to the Ferrata Storti Foundation. Use of published material is allowed under the following terms and conditions:
https://creativecommons.org/licenses/by-nc/4.0/legalcode. Copies of published material are allowed for personal or inter-nal use. Sharing published material for non-commercial pur-poses is subject to the following conditions:
https://creativecommons.org/licenses/by-nc/4.0/legalcode, sect. 3. Reproducing and sharing published material for com-mercial purposes is not allowed without permission in writing from the publisher.
Correspondence:
[email protected] Ferrata Storti Foundation EUROPEAN HEMATOLOGY ASSOCIATIONHaematologica
2017
Volume 102(9):1494-1501
doi:10.3324/haematol.2017.169060 Check the online version for the most updated information on this article, online supplements, and information on authorship & disclosures: www.haematologica.org/content/102/9/1494I
n ambulatory patients with solid cancer, routine thromboprophylaxis
to prevent venous thromboembolism is not recommended. Several
risk prediction scores to identify cancer patients at high risk of
venous thromboembolism have been proposed, but their clinical
useful-ness remains a matter of debate. We evaluated and directly compared
the performance of the Khorana, Vienna, PROTECHT, and CONKO
scores in a multinational, prospective cohort study. Patients with
advanced cancer were eligible if they were due to undergo
chemother-apy or had started chemotherchemother-apy in the previous three months. The
pri-mary outcome was objectively confirmed symptomatic or incidental
deep vein thrombosis or pulmonary embolism during a 6-month
follow-up period. A total of 876 patients were enrolled, of whom 260 (30%)
had not yet received chemotherapy. Fifty-three patients (6.1%)
devel-oped venous thromboembolism. The c-statistics of the scores ranged
from 0.50 to 0.57. At the conventional positivity threshold of 3 points,
the scores classified 13-34% of patients as high-risk; the 6-month
inci-dence of venous thromboembolism in these patients ranged from 6.5%
(95%CI: 2.8-12) for the Khorana score to 9.6% (95%CI: 6.6-13) for the
PROTECHT score. High-risk patients had a significantly increased risk
of venous thromboembolism when using the Vienna (subhazard ratio
1.7; 95%CI: 1.0-3.1) or PROTECHT (subhazard ratio 2.1; 95%CI:
1.2-3.6) scores. In conclusion, the prediction scores performed poorly in
pre-dicting venous thromboembolism in cancer patients. The Vienna CATS
and PROTECHT scores appear to discriminate better between low- and
high-risk patients, but further improvements are needed before they can
be considered for introduction into clinical practice.
Comparison of risk prediction scores for
venous thromboembolism in cancer patients: a
prospective cohort study
Nick van Es,1Marcello Di Nisio,2 Gabriela Cesarman,3 Ankie Kleinjan,1 Hans-Martin Otten,4Isabelle Mahé,5Ineke T. Wilts,6Desirée C. Twint,7 Ettore Porreca,8 Oscar Arrieta,3Alain Stépanian,9Kirsten Smit,7 Michele De Tursi,8Suzanne M. Bleker,1Patrick M. Bossuyt,10 Rienk Nieuwland,11Pieter W. Kamphuisen6,12and Harry R. Büller1 1Department of Vascular Medicine, Academic Medical Center, Amsterdam, the Netherlands; 2Department of Medicine and Ageing Sciences, G. D’Annunzio University, Chieti, Italy; 3Department of Hematology, National Cancer Institute Mexico, Mexico City, Mexico; 4Department of Internal Medicine, Slotervaart hospital, Amsterdam, the Netherlands; 5Department of Internal Medicine, Hôpital Louis Mourier, Paris, France; 6Department of Internal Medicine, University Medical Center Groningen, the Netherlands; 7Department of Internal Medicine, VU Medical Center, Amsterdam, the Netherlands; 8Department of Medical, Oral and Biotechnological Sciences, G. D’Annunzio University, Chieti, Italy; 9Department of Hematology, Hôpital Lariboisière, Paris, France; 10Department of Clinical Epidemiology, Biostatistics, and Bioinformatics, Academic Medical Center, Amsterdam, the Netherlands; 11Department of Experimental Clinical Chemistry, Academic Medical Center, Amsterdam, the Netherlands and 12Department of Internal Medicine, Tergooi Hospital, Hilversum, the Netherlands
ABSTRACT
Introduction
Venous thromboembolism (VTE) complicates the clinical course in 4-5% of can-cer patients1,2and is a major cause of morbidity and mortality.3The management
of VTE in cancer patients is particularly challenging since both the risk of recurrent VTE and major bleeding are high during anticoagulant treatment. Current interna-tional guidelines do not recommend routine pharmacological thromboprophylaxis in ambulatory cancer patients.4-6Low-molecular weight heparin (LMWH) in
pro-phylactic doses halves the risk of VTE1and is associated
with an absolute risk reduction of 2-2.5%. However, the corresponding number needed to treat (40-50) using thromboprophylaxis is considered too low to justify the potential increased risk of bleeding and the burden of daily subcutaneous injections for a prolonged period of time.4
Risk stratification tools have been developed to identify a subset of cancer patients in whom the risk of developing VTE is high enough to justify thromboprophylaxis. The best validated tool is a score proposed by Khorana and colleagues7which aims to identify cancer patients
receiv-ing chemotherapy at high risk of VTE based on the tumor type, hemoglobin concentration or use of erythropoietin stimulating agents, white blood cell count, platelet count, and Body Mass Index (BMI) (Table 1). To improve the dis-criminatory performance of the Khorana score, others have proposed modifications by adding biomarker meas-urements8or type of chemotherapy,9 or by replacing BMI
with performance status (Table 1).10
Although these scores performed well in the initial der-ivation studies, there have either been no subsequent external validation studies or those that have been carried out have reported conflicting results.11-13 Yet, it is important
that performance is maintained across different patient populations and settings. In addition, scores have not been directly compared in a large study of representative
patients. To fill this gap, we evaluated and directly com-pared four clinical prediction scores for VTE in patients with advanced cancer receiving chemotherapy in a multi-national cohort study.
Methods
Study design and patients
Data were collected in a multinational, prospective cohort study performed in seven hospitals in The Netherlands, Italy, France, and Mexico, designed to evaluate clinical and laboratory predic-tors for cancer-associated VTE. Here we report on the perform-ance of four published clinical prediction scores for cperform-ancer-associ- cancer-associ-ated VTE. Outpatients with lung, esophageal, colorectal, pancreat-ic, breast, prostate, gastrpancreat-ic, ovarian, or bladder cancer classified as stage III or IV according to the American Joint Committee on Cancer criteria were eligible if they were scheduled for chemotherapy within seven days or had started chemotherapy in the previous three months. Exclusion criteria included current pro-phylactic or therapeutic anticoagulation or adjuvant chemothera-py. None of the patients included had received routine thrombo-prophylaxis in accordance with current guidelines. Patients were recruited between July 2008 and February 2016. The study was approved by the institutional review boards of all participating hospitals. Patients included in the study provided written informed consent. The study was registered at clinicaltrials.gov
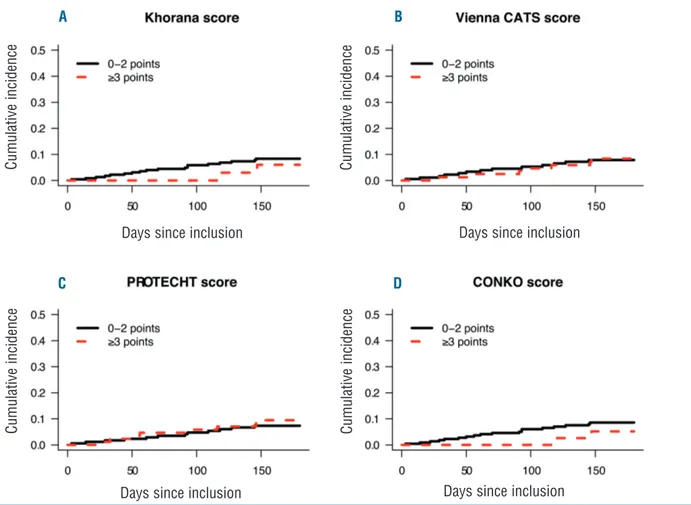
Figure 1. Cumulative incidence of venous thromboembolism in low- and high-risk patients. Cumulative incidence of venous thromboembolism in patients enrolled prior to chemotherapy (n=260) who were classified as being at low or high risk of venous thromboembolism by the (A) Khorana score, (B) Vienna CATS score, (C) PROTECHT score, and (D) CONKO score.
Days since inclusion
C u m u la ti v e i n c id e n c e C u m u la ti v e i n c id e n c e C u m u la ti v e i n c id e n c e C u m u la ti v e i n c id e n c e
Days since inclusion Days since inclusion
Days since inclusion
A B
(identifier: 02095925) after the enrollment of the first patient. The present report adheres to the Strengthening the Reporting of
Observational Studies in Epidemiology (STROBE) Statement.14
Study procedures
At baseline, healthcare professionals interviewed patients and collected baseline clinical and laboratory information from the medical charts using a standardized case report form. Patients were enrolled at oncology or vascular medicine departments. Blood was drawn in 0.109 M citrated tubes via antecubital venepuncture or through a peripheral catheter shortly after place-ment. Within one hour after blood collection, platelet poor plasma was prepared by centrifugation at 1560 g for 20 minutes and stored at -80°C after snap freezing.
A follow-up visit was scheduled at 180 days from the clinic visit by telephone and/or chart review. The primary outcome was the composite of objectively confirmed symptomatic or incidental pulmonary embolism (PE), distal or proximal leg deep vein throm-bosis (DVT), or non-catheter-related upper extremity DVT (UEDVT), or symptomatic catheter-related UEDVT. VTE was con-sidered incidental if diagnosed on imaging performed for reasons other than suspicion of VTE. Incidental events were included in the primary outcome since current guidelines suggest a treatment similar to that for symptomatic events. Patients did not undergo screening for VTE. Imaging reports of all potential outcomes were verified by 2 of the authors who were blinded to possible predic-tors of VTE. Deaths were not adjudicated routinely for fatal PE, but PE was considered to be fatal only if autopsy confirmed PE or in the case of an objective test positive for PE prior to death.
Evaluation of prediction scores
We evaluated the following clinical prediction scores for
cancer-associated VTE: the Khorana,7Vienna CATS,8PROTECHT,9and
CONKO scores10(Table 1). Characteristics of the derivation
stud-ies are provided in the Online Supplementary Appendix text 1. Evaluation of the Khorana score was included in the initial study protocol, while the other scores were published during the course of the study and were subsequently included in the analysis. We
were unable to evaluate a recently proposed genetic risk score.15 In
order to calculate the Vienna CATS score, D-dimer
(INNO-VANCE, Siemens) and soluble P-selectin (ELISA, R&D Systems, Minneapolis, MN, USA) concentrations were measured centrally in baseline samples. Analysis of samples of 98 patients from one center provided implausible results due to incorrect shipment, forcing us to omit these measurements, while the patients were retained in the dataset and among the imputed data.
For continuous scores, the overall discriminatory performance was evaluated. For dichotomized scores, we calculated the pro-portion of high-risk patients, the cumulative VTE incidence among high-risk patients, the cumulative VTE incidence among low-risk patients, and the difference in VTE incidence between low- and high-risk patients. Since the scores will be used in a dichotomous fashion in clinical practice by conflating the low and intermediate groups, we evaluated them at the conventional pos-itivity threshold of 3 points, and at exploratory pospos-itivity thresh-olds of 2 and 4 points.
Since the derivation of the Khorana, PROTECHT, Vienna CATS, and CONKO scores was almost entirely based on symptomatic VTE, a sensitivity analysis restricted to symptomatic events was performed. Another sensitivity analysis, restricted to the first 90 days of follow up, was performed for comparison with Khorana’s
derivation study which had a median follow up of 2.5 months.7
Our study was designed to include cancer patients prior to or within three months of the start of chemotherapy. Since pre-chemotherapy blood counts are incorporated into all evaluated clinical prediction scores, we restricted the main analysis to the group of patients who had not yet received chemotherapy. The analyses were then repeated in the complete study group, calcu-lating each score based on pre-chemotherapy blood counts, which were collected retrospectively at inclusion in patients who had already started chemotherapy. Results are thus presented for the group that mirrors cancer patients in whom the decision about thromboprophylaxis is made prior to chemotherapy and for all patients, including those for whom the question as to whether to provide thromboprophylaxis is discussed during the first months of chemotherapy.
Assuming a 6-month VTE incidence of 5-6%, the aim was to enroll approximately 800-1000 patients in order to observe about 50 events, which was considered to be sufficient for multivariable regression modeling with the five items in the Khorana score.
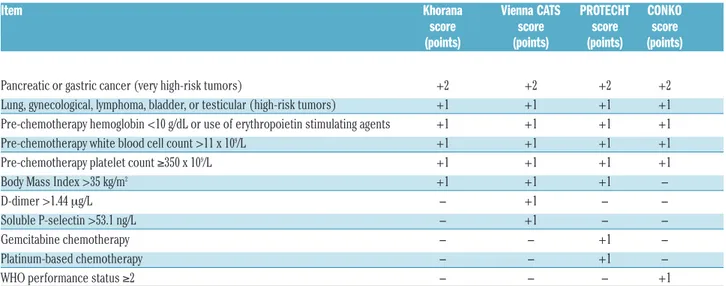
Table 1. Risk prediction scores for venous thromboembolism in cancer patients.
Item Khorana Vienna CATS PROTECHT CONKO
score score score score
(points) (points) (points) (points)
Pancreatic or gastric cancer (very high-risk tumors) +2 +2 +2 +2
Lung, gynecological, lymphoma, bladder, or testicular (high-risk tumors) +1 +1 +1 +1 Pre-chemotherapy hemoglobin <10 g/dL or use of erythropoietin stimulating agents +1 +1 +1 +1 Pre-chemotherapy white blood cell count >11 x 109/L +1 +1 +1 +1
Pre-chemotherapy platelet count ≥350 x 109/L +1 +1 +1 +1
Body Mass Index >35 kg/m2 +1 +1 +1
-D-dimer >1.44 mg/L - +1 -
-Soluble P-selectin >53.1 ng/L - +1 -
-Gemcitabine chemotherapy - - +1
-Platinum-based chemotherapy - - +1
-WHO performance status ≥2 - - - +1
Statistical analysis
The cumulative VTE incidence from enrollment to six months in low- and high-risk patients was estimated using a competing risk time-to-event analysis in which death was treated as a com-peting event for VTE. Unlike naïve Kaplan-Meier and Cox regression analysis, a competing risk analysis does not treat death as a censored observation, but rather takes into account that VTE cannot occur after death, thereby providing less biased
estimates.16 Time to VTE was considered censored when
patients underwent cancer surgery with curative intent, started therapeutic anticoagulation for other reasons than VTE, were lost to follow up, or at the end of the 6-month follow-up period. Confidence intervals (CI) at specific time points were calculated
using Choudhury’s method.17
To evaluate the discriminatory performance of the scores, the time-dependent concordance index (c-index) was calculated while
accounting for death as a competing risk.18 The 95% confidence
intervals were calculated by repeating the analyses in 250 boot-strap samples.
To assess the difference in VTE risk between low- and high-risk patients, subdistribution hazard ratios (SHR) and 95% CIs for the dichotomized scores were estimated using the competing risks
regression model of Fine and Gray.19 The predictive value of the
separate items in each score was assessed by multivariable com-peting risks regression models. The proportionality assumption
was checked by adding an interaction term between each variable and time to the model.
Multiple imputation was used to minimize the bias associated
with missing data.20 We assumed a 'missing' at random pattern in
which missingness depends on other observed variables. Center, inclusion year, all baseline characteristics, and outcome data were included in the imputation model to create twenty imputed datasets. Analyses were performed separately in each imputed dataset; estimates with standard errors were combined across the
datasets using Rubin’s rule.21 The complete case analyses were
provided for comparison.
A significance level of 0.05 was used in statistical testing. All analyses were performed in R, v.3.3.2 (R Foundation for Statistical Computing, Vienna, Austria; www.R-project.org), in particular using the “mice” v.2.25 package for multiple imputation, the “cmprsk” v.2.2-7 for the competing risk analyses, and the “pec” package v.2.4.9 for the time-dependent c-indices.
Results
During the 7.5-year study period, 876 patients with stage III or IV solid cancer were enrolled, of whom 260 (30%) had not yet started chemotherapy. The mean age was 64 years; 59% of patients were male. Baseline
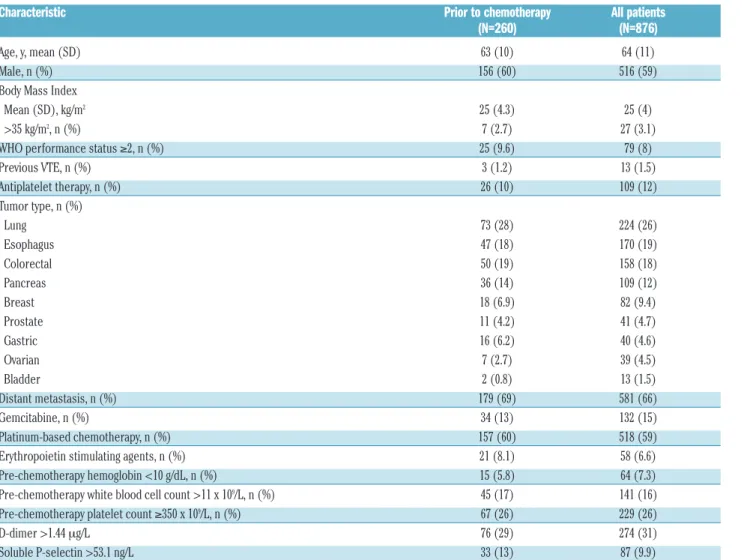
charac-Table 2. Baseline characteristics.
Characteristic Prior to chemotherapy All patients
(N=260) (N=876)
Age, y, mean (SD) 63 (10) 64 (11)
Male, n (%) 156 (60) 516 (59)
Body Mass Index
Mean (SD), kg/m2 25 (4.3) 25 (4)
>35 kg/m2, n (%) 7 (2.7) 27 (3.1)
WHO performance status ≥2, n (%) 25 (9.6) 79 (8)
Previous VTE, n (%) 3 (1.2) 13 (1.5) Antiplatelet therapy, n (%) 26 (10) 109 (12) Tumor type, n (%) Lung 73 (28) 224 (26) Esophagus 47 (18) 170 (19) Colorectal 50 (19) 158 (18) Pancreas 36 (14) 109 (12) Breast 18 (6.9) 82 (9.4) Prostate 11 (4.2) 41 (4.7) Gastric 16 (6.2) 40 (4.6) Ovarian 7 (2.7) 39 (4.5) Bladder 2 (0.8) 13 (1.5) Distant metastasis, n (%) 179 (69) 581 (66) Gemcitabine, n (%) 34 (13) 132 (15) Platinum-based chemotherapy, n (%) 157 (60) 518 (59)
Erythropoietin stimulating agents, n (%) 21 (8.1) 58 (6.6)
Pre-chemotherapy hemoglobin <10 g/dL, n (%) 15 (5.8) 64 (7.3)
Pre-chemotherapy white blood cell count >11 x 109/L, n (%) 45 (17) 141 (16) Pre-chemotherapy platelet count ≥350 x 109/L, n (%) 67 (26) 229 (26)
D-dimer >1.44 mg/L 76 (29) 274 (31)
Soluble P-selectin >53.1 ng/L 33 (13) 87 (9.9)
teristics of the patients enrolled prior to chemotherapy and the complete study group are summarized in Table 2. No significant differences were found between patients enrolled prior to chemotherapy and those enrolled during chemotherapy, except for higher P-selectin levels in the former group. The distribution of the scores are summa-rized in Online Supplementary Appendix text 2. Multiple imputation was used to calculate the Khorana in 33 patients (4%), the Vienna CATS score in 134 patients (15%), the PROTECHT score in 38 patients (4%), and the CONKO score in 47 patients (5%), in whom data on one or more of the score items were missing.
Overall, 53 patients (6.1%) developed VTE during the 6-month follow-up period, of whom 27 only had PE (3.1%), 15 had proximal DVT (1.7%), 7 had UEDVT (0.8%), 3 had PE and DVT (0.3%), and one had isolated distal DVT (0.1%). The corresponding cumulative incidence in the competing risks analysis was 6.5% (95%CI: 4.9-8.3%) at 180 days. VTE was symptomatic in 33 cases (62%). Two events (3.8%) were fatal. The median time to VTE was 57 days (interquartile range 33-116). Ten patients (1.1%) were lost to follow up and 163 patients (19%) died.
Performance of scores
Of the 260 patients who were enrolled prior to chemotherapy, 20 (7.7%) developed VTE, including 13 symptomatic events. In this group, the area under the ROC curves for the different scores (reflecting discrimina-tory performance) ranged from 0.50 (95%CI: 0.44-0.57) for the CONKO score and 0.50 (95%CI: 0.42-0.57) for the
Khorana score to 0.57 (95%CI: 0.48-0.66) for the Vienna CATS score (Table 3). At the conventional positivity threshold of 3 points, the proportion of patients classified as high-risk ranged from 13% (95%CI: 9.5-18%) for the Khorana score to 34% (95%CI: 28-40%) for the PRO-TECHT score (Table 3). The 6-month VTE incidence in these high-risk patients ranged from 5.2% (95%CI: 0.9-16%) for the CONKO score to 9.5% (95%CI: 4.4-17%) for the PROTECHT score (Table 3; see Figure 1 for time-to-event curves). At the evaluated positivity thresholds of 2, 3, or 4 points, none of the scores was able to discrimi-nate between low- and high-risk patients (Online
Supplementary Appendix text 3).
The analyses were repeated in all 876 patients, including the 616 patients enrolled after the start of chemotherapy (median 28 days; interquartile range 16-56) for whom blood counts collected before chemotherapy were used to calculate the scores. Overall, results were comparable to the analyses restricted to patients enrolled prior to chemotherapy. The area under the ROC curves ranged from 0.52 (95%CI: 0.47-0.58) for the Khorana score to 0.59 (95%CI: 0.52-0.66) for the PROTECHT score (Table 3). At the conventional positivity threshold of 3 points, the Khorana score again classified 13% (95%CI: 11-15%) as high-risk, whereas the PROTECHT score classified 35% of patients (95%CI: 31-38%) as high-risk (Table 3). Among high-risk patients, the cumulative VTE incidence at six months ranged from 6.5% (95%CI: 2.8-12%) when using the Khorana score to 9.6% (95%CI: 6.6-13%) when using the PROTECHT score (Table 3). Subhazard ratios
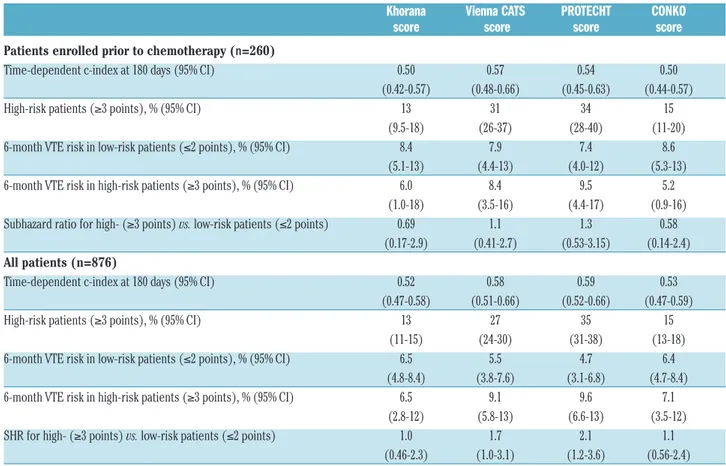
Table 3. Performance of different scores in patients enrolled prior to chemotherapy (n=260) and all patients (n=876).
Khorana Vienna CATS PROTECHT CONKO
score score score score
Patients enrolled prior to chemotherapy (n=260)
Time-dependent c-index at 180 days (95% CI) 0.50 0.57 0.54 0.50
(0.42-0.57) (0.48-0.66) (0.45-0.63) (0.44-0.57)
High-risk patients (≥3 points), % (95% CI) 13 31 34 15
(9.5-18) (26-37) (28-40) (11-20) 6-month VTE risk in low-risk patients (≤2 points), % (95% CI) 8.4 7.9 7.4 8.6
(5.1-13) (4.4-13) (4.0-12) (5.3-13) 6-month VTE risk in high-risk patients (≥3 points), % (95% CI) 6.0 8.4 9.5 5.2
(1.0-18) (3.5-16) (4.4-17) (0.9-16) Subhazard ratio for high- (≥3 points) vs. low-risk patients (≤2 points) 0.69 1.1 1.3 0.58
(0.17-2.9) (0.41-2.7) (0.53-3.15) (0.14-2.4) All patients (n=876)
Time-dependent c-index at 180 days (95% CI) 0.52 0.58 0.59 0.53
(0.47-0.58) (0.51-0.66) (0.52-0.66) (0.47-0.59)
High-risk patients (≥3 points), % (95% CI) 13 27 35 15
(11-15) (24-30) (31-38) (13-18) 6-month VTE risk in low-risk patients (≤2 points), % (95% CI) 6.5 5.5 4.7 6.4
(4.8-8.4) (3.8-7.6) (3.1-6.8) (4.7-8.4) 6-month VTE risk in high-risk patients (≥3 points), % (95% CI) 6.5 9.1 9.6 7.1
(2.8-12) (5.8-13) (6.6-13) (3.5-12) SHR for high- (≥3 points) vs. low-risk patients (≤2 points) 1.0 1.7 2.1 1.1
(0.46-2.3) (1.0-3.1) (1.2-3.6) (0.56-2.4) CI: Confidence Interval; SHR: subdistribution Hazard Ratio; VTE: venous thromboembolism; vs.: versus; n: number.
for VTE in high- versus low-risk patients ranged from 1.0 (95%CI: 0.46-2.2) for the Khorana score to 1.7 (95%CI: 1.0-3.1) for the Vienna CATS score and 2.1 (95%CI: 1.2-3.7) for the PROTECHT score (Table 3; see Online
Supplementary Appendix text 4 for time-to-event curves). At
positivity thresholds of 2 or 4 points, the difference in VTE risk between high- and low-risk patients was not signifi-cant for any of the scores (Online Supplementary Appendix
text 3).
Sensitivity analyses
The sensitivity analysis restricted to symptomatic VTE in the total study group yielded comparable results (Online
Supplementary Appendix text 5). The 6-month risk of
symp-tomatic VTE in high-risk patients ranged from 3.7% (95%CI: 1.2-8.6%) for the Khorana score to 6.2% (95%CI: 3.8-9.4%) for the PROTECHT score.
In the sensitivity analysis restricted to the first 90 days of follow up, in which 34 of 876 patients (3.9%) devel-oped VTE, the discriminatory performance of all scores was slightly better (Online Supplementary Appendix text 6). The 90-day VTE incidence in high-risk patients (≥3 points) ranged from 3.6% (95%CI: 1.2-8.4%) for the Khorana score to 6.4% (95%CI: 3.7-10%) for the Vienna CATS score and 6.4% (95%CI: 4.0-9.6%) for the PROTECHT score. The results from the complete case analysis did not substantially differ from the analysis of the imputed datasets (Online Supplementary Appendix text 7).
Results of the multivariable analyses are shown in
Online Supplementary Appendix text 8. None of the Khorana
score items were significantly associated with VTE in any of the scores. In the Vienna CATS score, the dichotomized D-dimer result was significantly associated with VTE (SHR 2.4; 95%CI: 1.3-4.4), while in the PROTECHT score, both gemcitabine (SHR 3.7; 95%CI: 1.8-7.6) and plat-inum-based chemotherapy (SHR 2.8; 95%CI: 1.4-5.6) were associated with VTE conditional on the other items.
Discussion
This multinational, prospective cohort study provides a direct comparison of the performance of four clinical and biomarker-based prediction scores for VTE in patients with advanced solid cancer receiving chemotherapy. All scores had a poor discriminatory performance, although the Vienna CATS and PROTECHT scores were able to discriminate between high- and low-risk patients when used dichotomously in the complete study group. The 6-month VTE incidence among patients classified as high-risk by these two scores was approximately 2-fold higher than in low-risk patients.
The poor overall discriminatory performance of the scores could partly be explained by the findings of the multivariable analysis. Hemoglobin levels, white blood cell counts, and platelet counts were not significantly asso-ciated with VTE. In a large prospective cohort study, Posch and colleagues also showed that the predictive per-formance of these items was limited,22thereby
question-ing the relevance of these items for VTE risk prediction in cancer patients. In addition, in the present study, only 3% of patients had a BMI over 35 kg/m2, of whom none
devel-oped VTE. The low prevalence of obesity among cancer patients led Pelzer and colleagues to propose the CONKO score, in which BMI was replaced with World Health
Organization performance status.10However, we did not
observe any significant improvement in discriminatory performance of this modified score compared to the Khorana score.
The Vienna CATS and PROTECHT score were the only two scores that could identify high-risk patients when used dichotomously. However, this significant association was observed in the complete study group, but not in patients enrolled prior to chemotherapy. Since the charac-teristics of patients enrolled prior to and during chemotherapy were comparable, possible explanations include differences in unobserved confounders or impreci-sion in the estimates. The predictive performance of the two scores in the complete study group appeared to be predominantly driven by the predictive performance of D-dimer levels in the Vienna CATS score and type of chemotherapy in the PROTECHT score, which could explain why they performed better than the Khorana and CONKO scores. Drawbacks of the Vienna CATS score include measuring D-dimer and soluble P-selectin, which may be difficult in clinical practice, while the PROTECHT score is more complex than the Khorana score because another two items are added. Moreover, the risk of VTE patients classified as low-risk by these scores was still appreciable, with 6-month rates of 5-6%, compared to 8-10% in high-risk patients.
The Khorana score has already been extensively evalu-ated in various studies with different patient populations and duration of follow up. In studies restricting enrollment to single tumor types, such as pancreatic13,23and lung
can-cer,12the Khorana score was often not able to discriminate
between low- and high-risk patients, while other studies did confirm the score’s predictive ability.8,24,25 In addition,
in the present study, differences in case-mix compared to the derivation study may partly explain the poor perform-ance. For example, in the present study, the proportion of patients with esophageal cancer was higher and enrollment was restricted to patients with advanced can-cer. However, evaluating clinical prediction score in other settings and populations is the very essence of external validation studies; a score should maintain its predictive performance across a broad spectrum of patients, includ-ing those more recently treated, as well as different geo-graphical locations, before it can be adopted into clinical practice.
It has to be noted that the original Khorana score was derived in a study with a median follow up of only 2.5 months and that not all cancer types were represented. Whether results should be extrapolated to other tumor types, and whether clinical and laboratory information obtained prior to chemotherapy remains predictive beyond the initial cancer treatment period remains uncer-tain. This notion was supported by additional analyses, in which we observed that the area under the time-depen-dent ROC-curves decreased rapidly during the first weeks of follow up (data not shown). Similarly, in the sensitivity analysis restricted to the first three months of follow up, the discriminatory performance of the dichotomized Vienna CATS and PROTECHT scores appeared to improve somewhat compared to the complete follow-up period.
The present prospective study is one of the largest in which multiple prediction scores for cancer-associated VTE were evaluated in a representative sample of patients with various tumor types. By restricting enrollment to
patients with locally advanced or metastatic solid cancers, the majority of the patients received long-term palliative rather than short-term neoadjuvant chemotherapy, resem-bling the populations enrolled in trials evaluating throm-boprophylaxis in ambulatory cancer patients.26,27 Loss to
follow up was minimal and outcome events were central-ly verified blinded to the score results to prevent outcome bias. The multinational design of the study prevented potential single-center bias and strengthens the external validity of the findings.28
Our study has several limitations that merit considera-tion. We realize that the evaluated prediction scores all include pre-chemotherapy blood counts, while our study was designed to also include patients who had recently started chemotherapy. The main analysis was therefore restricted to 260 patients who were about to start their anticancer treatment. For patients who were receiving chemotherapy at enrollment, retrospectively collected pre-chemotherapy blood counts were used to calculate the scores to avoid potential effects of chemotherapy. The number of events observed in patients enrolled prior to chemotherapy (n=20) was sufficient to detect potential differences in VTE incidence between low- and high-risk patients, although the power may have been somewhat lower. Given the small difference in VTE risk between low- and high-risk patients, it is unlikely that a larger sam-ple of patients enrolled prior to chemotherapy would have altered our conclusions.
Along the same line, the enrollment of patients who had already started chemotherapy may have resulted in immortal time bias. Since the risk of VTE is usually high-est in the first months of chemotherapy, the high-estimate of the absolute VTE risk may have been conservative. In addition, if the scores were to have been truly predictive, the performance of the scores may have been underesti-mated. However, the findings in the complete study group were similar (and even slightly better) to those in the group enrolled prior to chemotherapy.
Sudden deaths were not routinely adjudicated for fatal PE, although PE was considered to be fatal if autopsy firmed the diagnosis or when PE was objectively con-firmed prior to death. Still, this approach may have result-ed in a conservative estimate of the VTE incidence. As the proportion of such lethal events among all events is often small, relative risk estimates are unlikely to be affected.
We realize that the evaluated scores were predominant-ly derived from observations of symptomatic events. Since treatment recommendations are similar for inciden-tal and for symptomatic events, thromboprophylaxis is just as important to prevent incidental VTE. These events were, therefore, included in the primary outcome. The findings of the sensitivity analysis restricted to sympto-matic events was comparable to those from the overall analysis, suggesting that the examined scores have similar performance in predicting incidental events.
A different D-dimer assay was used in the present study
than in the derivation study of the Vienna CATS score, which could have impacted on the discriminatory per-formance of the dichotomous D-dimer result. Nevertheless, D-dimer was one of the strongest predictors of VTE in the multivariable analysis, suggesting that the evaluated threshold of 1.44 mg/L may be a reasonable one, also for other assays.
What are the clinical implications of the present findings and the future steps for using prediction tools for cancer-associated VTE? A recent Cochrane systematic review demonstrated that LMWH in prophylactic doses reduces the relative risk of symptomatic VTE by 46% when com-pared to no thromboprophylaxis.1 Assuming that these
findings also apply to high-risk patients, the use of the Vienna CATS or PROTECHT scores to select patients for thromboprophylaxis could theoretically result in an absolute risk reduction of approximately 4-5% with a score of 20-25 needed in order to decide to start treatment. Subcutaneous injections for six months can be burden-some, perhaps even more for oncological patients with a limited life expectancy. The same Cochrane review also showed that LMWH thromboprophylaxis was associated with a non-significant 44% increase in the risk of major bleeding with a score of 125 needed before treatment is considered harmful; this should be carefully balanced against the potential benefits.
Future studies should aim to refine current risk predic-tion tools or develop new models in order to further improve the risk-benefit ratio of thromboprophylaxis in ambulatory cancer patients. Risk models that take into account the differences in baseline risk and prognostic fac-tors across various types of cancer would allow personal-ized risks to be calculated more precisely by only using predictors that are relevant for a specific cancer type. Whether thromboprophylaxis with direct oral anticoagu-lants is a safe, effective, and less burdensome alternative in ambulatory cancer patients is currently being investigated in several ongoing trials that use the Khorana score for risk stratification (e.g. clinicaltrials.gov identifiers: 02555878 and
02048865). Interestingly, one of the trials applies the
Khorana score at a lower positivity threshold of 2 points, which classifies a greater proportion of patients in the high-risk group, but in parallel may decrease the positive predictive value of the score.
The present findings do not support the use of any of the examined scores to select patients for thrombopro-phylaxis. The discriminatory performance of the dichotomized Vienna CATS and PROTECHT scores is somewhat encouraging, but confirmation in subsequent observational and intervention studies providing throm-boprophylaxis to high-risk patients is needed before they can be used in clinical practice.
Funding
This work was supported by unrestricted grants from the par-ticipating hospitals.
References
1. Di Nisio M, Porreca E, Candeloro M, De Tursi M, Russi I, Rutjes AW. Primary pro-phylaxis for venous thromboembolism in ambulatory cancer patients receiving
chemotherapy. Cochrane Database Syst Rev. 2016;12(2):CD008500.
2. Horsted F, West J, Grainge MJ. Risk of venous thromboembolism in patients with cancer: a systematic review and meta-analy-sis. PLoS Med. 2012;9(7):e1001275. 3. Khorana AA, Francis CW, Culakova E,
Kuderer NM, Lyman GH.
Thromboembolism is a leading cause of death in cancer patients receiving outpatient chemotherapy. J Thromb Haemost. 2007;5(3):632–634.
4. Lyman GH, Bohlke K, Khorana AA, et al. Venous Thromboembolism Prophylaxis and
Treatment in Patients With Cancer: American Society of Clinical Oncology Clinical Practice Guideline Update 2014. J Clin Oncol. 2013;31(17):654-656. 5. Mandala M, Falanga A, Roila F, Mandalà M,
Falanga A, Roila F. Management of venous thromboembolism (VTE) in cancer patients: ESMO Clinical Practice Guidelines. Ann Oncol. 2011;22 Suppl 6:vi85-92.
6. Farge D, Debourdeau P, Beckers M, et al. International clinical practice guidelines for the treatment and prophylaxis of venous thromboembolism in patients with cancer. J Thromb Haemost. 2013;11(1):56-70. 7. Khorana AA, Kuderer NM, Culakova E,
Lyman GH, Francis CW. Development and validation of a predictive model for chemotherapy-associated thrombosis. Blood. 2008;111(10):4902-4907.
8. Ay C, Dunkler D, Marosi C, et al. Prediction of venous thromboembolism in cancer patients. Blood. 2010;116(24):5377-5382. 9. Verso M, Agnelli G, Barni S, Gasparini G,
LaBianca R. A modified Khorana risk assess-ment score for venous thromboembolism in cancer patients receiving chemotherapy: the Protecht score. Intern Emerg Med. 2012;7(3):291-292.
10. Pelzer U, Sinn M, Stieler J, Riess H. [Primary pharmacological prevention of thromboem-bolic events in ambulatory patients with advanced pancreatic cancer treated with chemotherapy?]. Dtsch Med Wochenschr. 2013;138(41):2084-2088.
11. Simanek R, Vormittag R, Ay C, et al. High platelet count associated with venous thromboembolism in cancer patients: results from the Vienna Cancer and Thrombosis Study (CATS). J Thromb Haemost. 2010;8(1):114-120.
12. Mansfield AS, Tafur AJ, Wang CE, Kourelis T V., Wysokinska EM, Yang P. Predictors of
active cancer thromboembolic outcomes: validation of the Khorana score among patients with lung cancer. J Thromb Haemost. 2016;14(9):1773-1778.
13. Muñoz Martín AJ, García Alfonso P, Rupérez Blanco AB, Pérez Ramírez S, Blanco Codesido M, Martín Jiménez M. Incidence of venous thromboembolism (VTE) in ambulatory pancreatic cancer patients receiving chemotherapy and analysis of Khorana’s predictive model. Clin Transl Oncol. 2014;16(10):927-930.
14. von Elm E, Altman DG, Egger M, et al. The Strengthening the Reporting of Observational Studies in Epidemiology (STROBE) statement: guidelines for report-ing observational studies. Lancet. 2007; 370(9596):1453-1457.
15. Martín AJM, Ziyatdinov A, Rubio VC, et al. PO-04 - A new genetic risk score for predict-ing venous thromboembolic events in can-cer patients receiving chemotherapy. Thromb Res. 2016;140 Suppl:S177-178. 16. Putter H, Fiocco M, Geskus RB. Tutorial in
biostatistics: competing risks and multi-state models. Stat Med. 2007;26(11):2389-2430.
17. Choudhury JB. Non-parametric confidence interval estimation for competing risks analysis: application to contraceptive data. Stat Med. 2002;21(8):1129-1144.
18. Wolbers M, Blanche P, Koller MT, Witteman JCM, Gerds TA. Concordance for prognostic models with competing risks. Biostatistics. 2014;15(3):526-539.
19. Fine JP, Gray RJ. A Proportional Hazards Model for the Subdistribution of a Competing Risk. J Am Stat Assoc. 1999; 94(446):496.
20. Donders ART, van der Heijden GJMG, Stijnen T, Moons KGM. Review: a gentle introduction to imputation of missing
val-ues. J Clin Epidemiol. 2006;59(10):1087-1091.
21. Rubin DB. Inference and missing data. Biometrika. 1976;63(3):581-592.
22. Posch F, Riedl J, Reitter E-M, et al. Hypercoagulabilty, venous thromboem-bolism, and death in patients with cancer. A Multi-State Model. Thromb Haemost. 2016;115(4):1-10.
23. van Es N, Franke VF, Middeldorp S, Wilmink JW, Büller HR. The Khorana score for the prediction of venous thromboembolism in patients with pancreatic cancer. Thromb Res. 2017;150:30-32.
24. Srikanthan A, Tran B, Beausoleil M, et al. Large retroperitoneal lymphadenopathy as a predictor of venous thromboembolism in patients with disseminated germ cell tumors treated with chemotherapy. J Clin Oncol. 2015;33(6):582-587.
25. Mandala M, Clerici M, Corradino I, et al. Incidence, risk factors and clinical implica-tions of venous thromboembolism in cancer patients treated within the context of phase I studies: the “SENDO experience”. Ann Oncol. 2012;23(6):1416-1421.
26. Agnelli G, George DJ, Kakkar AK, et al. Semuloparin for thromboprophylaxis in patients receiving chemotherapy for cancer. N Engl J Med. 2012;366(7):601-609. 27. Agnelli G, Gussoni G, Bianchini C, et al.
Nadroparin for the prevention of throm-boembolic events in ambulatory patients with metastatic or locally advanced solid cancer receiving chemotherapy: a ran-domised, placebo-controlled, double-blind study. Lancet Oncol. 2009;10(10):943-949. 28. Unverzagt S, Prondzinsky R, Peinemann F.
Single-center trials tend to provide larger treatment effects than multicenter trials: A systematic review. J Clin Epidemiol. 2013; 66(11):1271-1280.