This is an Open Access article distributed under the terms of the Creative Commons Attribution License, which permits unrestricted use, distribution,
and antioxidant activity of commercial
orange juice
Efeitos do enriquecimento fenólico na vitamina C e atividade
antioxidante do suco de laranja comercial
Rosa Romeo1, Alessandra De Bruno1* , Amalia Piscopo1, Eduardo Medina2, Eva Ramírez2, Manuel Brenes2, Marco Poiana1
1University Mediterranea of Reggio Calabria, Department of Agraria, Reggio Calabria - Italy
2Consejo Superior de Investigaciones Científicas (CSIC), Instituto de la Grasa (IG), Food Biotechnology Department, Sevilla - Spain
*Corresponding Author: Alessandra De Bruno, Università Mediterranea di Reggio Calabria, Università degli Studi Mediterranea di Reggio Calabria (AGRARIA), Contrada Melissari, III Lotto Reggio Calabria, 89124, Reggio Calabria - Italia, e-mail: [email protected]
Cite as: Romeo, R., De Bruno, A., Piscopo, A., Medina, E., Ramírez, E., Brenes, M., & Poiana, M. (2020). Effects of phenolic enrichment on vitamin C and antioxidant activity of commercial orange juice. Brazilian Journal of Food
Technology, 23, e2019130. https://doi.org/10.1590/1981-6723.13019
Abstract
The autoxidation process of vitamin C in orange juice is the most important cause of quality loss during its storage. We evaluated the enrichment with different concentrations of a phenolic extract in a commercial orange juice for some qualitative parameters such as the content of vitamin C, phenolic compounds, and antioxidant activity. The lowest concentration of phenols produced the most stable enriched juice. In particular, we observed an inverse correlation between phenolic concentration and vitamin C retention in enriched juices. DPPH assay results confirmed this trend, correlated more to the vitamin antioxidant effect. TEAC results instead, were similar for the different juice samples, probably influenced by the phenolic content. The application of this study is the production for the industry of new functional drinks such as juices enriched with phenolic ingredients that show increased stability concerning those without addiction.
Keywords: Antioxidant activity; Enrichment; Phenolic compounds; Storage.
Resumo
O processo de autoxidação da vitamina C no suco de laranja é a causa mais importante da perda de qualidade durante o seu armazenamento. O enriquecimento com diferentes concentrações de um extrato fenólico em um suco de laranja comercial foi avaliado para alguns parâmetros qualitativos, como conteúdo de vitamina C, compostos fenólicos e atividade antioxidante. A menor concentração de fenóis produziu o suco enriquecido mais estável. Em particular, foi observada uma correlação inversa entre a concentração fenólica e a retenção de vitamina C em sucos enriquecidos. Os resultados do ensaio DPPH confirmaram esta tendência, mais correlacionados com o efeito antioxidante da vitamina C. Os resultados da TEAC, ao invés disso, foram semelhantes para as diferentes amostras de suco, provavelmente influenciados pelo conteúdo fenólico. A aplicação deste estudo é na produção indústrial de novas bebidas funcionais, como sucos enriquecidos com ingredientes fenólicos, que mostram uma maior estabilidade comparativamente àqueles sem adição.
1 Introduction
Clinical trials have demonstrated that the onset of different diseases and aging-related disorders is associated with a low intake of fruits and vegetables (Rapisarda et al., 2008). New scientific evidence about the connection between adequate nutrition and disease prevention has increased the interest in selected foods, which have specific health benefits (Singh et al., 2016; Cossu et al., 2012). Among fruits and fruit products, orange juice is one of the most popular marketed fruit juices. The commercial value of orange juice is due to its sensory qualities (i.e. flavour, taste, and colour) and above all, to the high content of natural antioxidants, as vitamin C (Rapisarda et al., 2001; Sicari et al., 2016). Phenolic acids and flavanones are the two main groups of phenolic compounds in orange juice (Kelebek & Selli, 2014). Significant quantities of hydroxycinnamic acid and its derived compounds, including ferulic, p-coumaric, sinapic, caffeic, and chlorogenic acids were found in orange juice. Different “in vitro” assays can be useful to assess the total antioxidant activity of food products and evaluate bioactive components, such as polyphenols (Bolling et al., 2013). Literature refers to the important role of phenolic compounds and vitamin C in orange to scavenge free radicals by DPPH and FRAP assays (Klimczak et al., 2007; Fawole & Opara, 2016; Sicari et al., 2018). Ramful et al. (2011) found a very high correlation between the total vitamin C content and the free radical scavenging capacities of commercial orange juices. It
ranges from 150 to 450 mg L-1 of juice and a glass of it (200 mL) can deliver about 30% to 80% of the
recommended daily intake of vitamin C (Pincemail et al., 2015). As other antioxidant compounds, vitamin C varies for plant genotype, environmental conditions, agronomic practices, fruit maturity, technological processes, and storage (Madrau et al., 2009; Stinco et al., 2015; Vieira et al., 2018). However, it is unstable, easily degrading in undesirable conditions, linked to oxygen, heat and light action, storage temperature, and time (Zappia et al., 2018; Guntarti & Hutami, 2019). Vitamin C degradation, microbial spoilage, and off flavours production cause quality loss and reduction of orange juice shelf life (Kaddumukasa et al., 2017). The use of synthetic and natural antioxidants in the formulation of functional foods is of great and actual interest to prevent or delay the autoxidation process (Faustino et al., 2019; Romeo et al., 2019).
Considering the increased importance of functional foods, it is interesting to understand the interactions of the different native and added antioxidants, in particular in new formulated foods. The present work aimed to evaluate the effect of different concentrations of commercial phenolic extracts added to orange juice in the oxidative process evolution, in particular toward vitamin C content under different storage times and temperatures.
2 Material and methods
2.1 Sampling
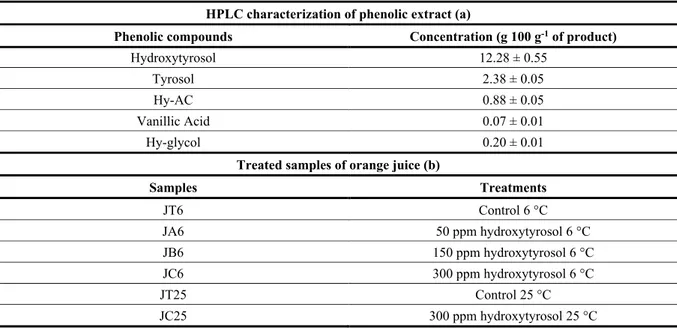
We used fresh orange juice (DAESA company, Valencia, Spain), packed in Tetra Pak (1 L) containers for an experimental study. Its original shelf-life was of 30 days under refrigeration temperatures. For orange juice enrichment, we used a phenol extract (Biomaslinic S.L. Escúzar, Granada-Spain) at three concentrations (50, 150, and 300 mg/kg of hydroxytyrosol). Table 1 reported phenolic composition of extract (a) and the sample denomination (b), and the fresh orange juice representing the control sample. All the samples were stored in 60 mL sterile glass bottles at 6 °C in darkness.
Table 1. HPLC characterization of phenolic extract (a) and treated samples of orange juice (b).
HPLC characterization of phenolic extract (a)
Phenolic compounds Concentration (g 100 g-1 of product)
Hydroxytyrosol 12.28 ± 0.55
Tyrosol 2.38 ± 0.05
Hy-AC 0.88 ± 0.05
Vanillic Acid 0.07 ± 0.01
Hy-glycol 0.20 ± 0.01
Treated samples of orange juice (b)
Samples Treatments JT6 Control 6 °C JA6 50 ppm hydroxytyrosol 6 °C JB6 150 ppm hydroxytyrosol 6 °C JC6 300 ppm hydroxytyrosol 6 °C JT25 Control 25 °C JC25 300 ppm hydroxytyrosol 25 °C
HPLC: High-Pressure Liquid Chromatography.
We used a higher storage temperature (25 ± 5 °C) for the sample enriched with the highest phenolic concentration (JC25) to evaluate the response of the highest antioxidant enrichment to stronger thermal conditioning. Two bottles for each sample were analyzed in duplicate on the 1st day and after the 15th, 30th, 45th, and 60th day of storage.
2.2 Physicochemical characterization of orange juice samples
We measured the pH of samples at room temperature using a pH-meter Model XS IP6. The Brix degrees were determined by the measurement of the refractive index with a refractometer (ATAGO 8269 Japan) at 25 °C.
Color measurements of 10 mL juice samples were performed using a BYK Gardner color-view 9000 Color Spectrophotometer, equipped with computer software to calculate the CIE L* (lightness), a* (redness), and b* (yellowness) parameters. We obtained colorimetric parameters for each sample by an average of 10 measurements.
2.3 Microbiological analysis
We analyzed the samples JT6, JT25, JC6, and JC25 for the aerobic mesophilic count during the storage. Both pour-plate (1 mL/plate, in duplicate), and surface inoculation (0.1 mL/plate) procedures were used in PCA (Plate Count Agar, Conda-Pronadisa, Spain). Inoculated plates were incubated at 32 °C up to 5 days before counting the colonies.
2.4 HPLC analysis
The determination of phenolic compounds in the orange juice samples was performed following the method reported by Ramírez et al. (2013). A mixture of 250 μL of the orange juice, 250 μL of internal standard (0.2 mM syringic acid), and 500 μL of deionized water were centrifuged at 9000 rpm for 5 min and filtered through a 0.2 μm pore size nylon filter. 20 μL of this solution were analyzed using a chromatographic system equipped with a Waters 717 plus autosampler, a Waters 600E pump, a Waters heater module (Waters Inc. Milford, MA), and a Spherisorb ODS2 (5 mm, 25 cm, 4.6 mm i.d. Waters Inc.) column maintained at
35 °C. A gradient elution (flow of 1 mL/min) was characterized by an initial composition of 90% of water (pH adjusted to 2.7 with phosphoric acid) and 10% methanol which increased to 30% in 10 min, maintained for 20 min, . then raised to 40% in 10 min, maintained for 5 min, and increased to 50%. Finally, methanol was increased up to 100% in 5 min. Phenolic compounds were recorded at 280 nm and the vitamin C at 245 nm using a Waters 996 diode array detector.
2.5 Antioxidant activity determination: DPPH˙ and ABTS assays
We obtained extracts for the antioxidant activity analysis following the procedure proposed by González-Molina et al. (2009), centrifuged at 9000 rpm for 5 min and then filtered through a 0.45-μm nylon filter before the analysis.
DPPH assay was performed using the method of Brand-Williams et al. (1995) which is based on the reaction mechanism between the DPPH˙ (2,2- diphenyl-1-picrylhydrazyl, Carlo Erba, MI, Italy) and the antioxidants present in the samples.
We added 20 µL of extract to 2980 µL of 6∙10-5 mmol/L of DPPH solution. The mixtures were incubated
for 5 min and then analyzed at 515 nm as reported by Tsai et al. (2007) with some modifications. As a percentage of inhibition, the results were calculated according to the Formula 1:
( 0 ) 0 At Ate % Inhibition = 100 At − ⋅ (1)
where Ate is the value of absorbance measured after 5 minutes while At0 is the value of absorbance of DPPH˙ solution at the initial time.
The Trolox Equivalent Antioxidant Capacity (TEAC) method used the method reported by De Bruno et al. (2018). This analysis evaluates the capacity of the studied sample to inhibit ABTS radical oxidation, comparing it with an antioxidant standard (Trolox). 10 µL of extract was allowed to react with 2990 µL
ABTS+ for 5 min at dark conditions, and then the absorbance was measured at 734 nm. TEAC values
(mmol L-1 of juice) expressed the results.
Shimadzu UV-1800 spectrophotometer (Kioto, Japan) determined DPPH and ABTS radical scavenging activity.
2.6 Sensory evaluation
We performed a triangle test following ISO 4120:2004 and choosing α=0.2, β=0.05, Pd=40%, and 8 panelists for sensory evaluation. The sensory evaluation was carried out on treated samples of orange juice (JA6) with the phenolic extract (50 ppm of hydroxytyrosol) versus control samples (JT6). Six different combinations were distributed in randomized order to the panelists and we used the forced-choice procedure. We also assessed the perception of “negative sensation” (abnormal flavor and bitter). For all sessions, 10 mL of JA6 and JT6 samples were placed in blue glasses and all samples were served at room temperature.
2.7 Statistical analysis
All experimental results in this study showed the mean values ± standard deviation (SD) of four measurements (n= 4). In these single-factor experiments, significant differences (p < 0.05) among treatment means were determined by one-way analysis of variance (ANOVA) and post-hoc Tukey’s test. SPSS Software (Version 15.0, SPSS Inc. Chicago, IL, USA) was used for data processing.
3 Results and discussion
3.1 Physicochemical results
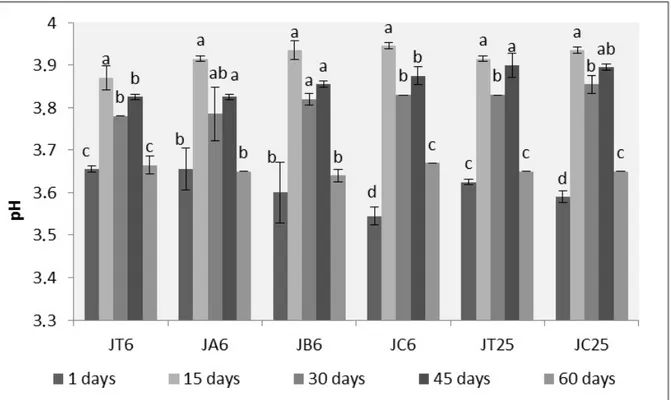
The critical factor affecting the juice spoilage includes the pH. The microbial spoilage in juices is represented by cloud loss, off-flavors development, CO2 production, and sensorial changes which result in product degradation (Aneja et al., 2014). For this reason, the determination of pH values is very important to evaluate the quality of juice. The measured pH values ranged from 3.50 to 3.97 in both enriched and not enriched samples (Figure 1). The observed pH trend was similar to those reported by Rapisarda et al. (2008) and Meléndez-Martínez et al. (2010) for stored orange juices. The increased pH values may be due to the citric acid decrease during acid, metabolism as observed by Mu et al. (2018). At the end of the storage period (60 days), the pH decreased, probably correlated to an increase of weak acid concentration as also reported by Eke-Ejiofor (2016).
Figure 1. pH values of different orange juices at 25 °C and 6 °C during storage. By Tukey’s multiple range test, small letters show differences in the sample at each monitoring time.
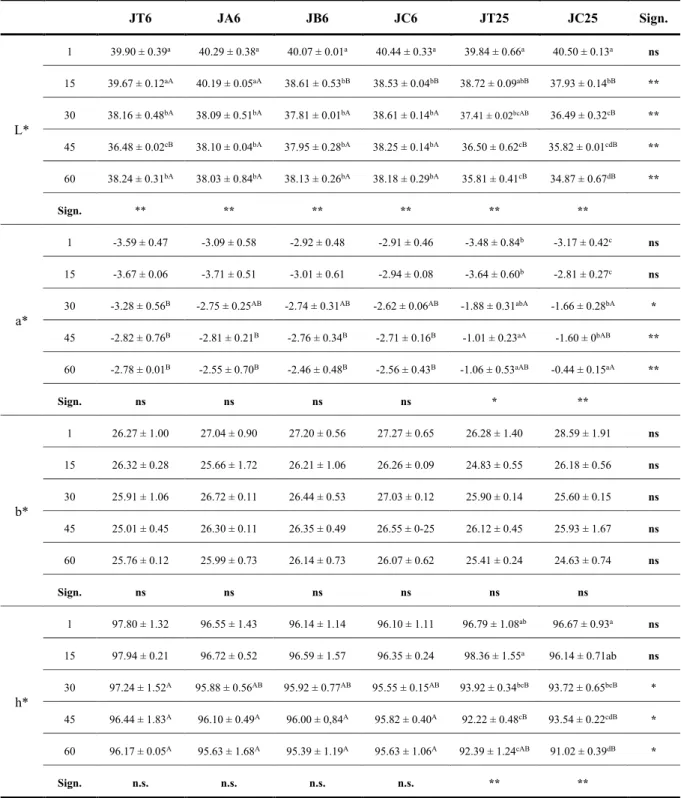
Table 2 shows the color determinations on different samples. The addition of phenolic extract did not affect the color parameters, and after one day of storage all samples did not show differences in each other. Absolute L* significantly decreased (p < 0.05) in all samples during storage time. The temperature seemed to affect L* and a* values: samples stored at 25 °C showed a strong decrease of L* from the start to the end of storage. The temperature of 6 °C did not affect the a* parameter of all samples, whereas an increase of a* was detected in those stored at 25 °C, during the storage. This increase was observed in fact in both enriched samples (JC25) and simple juice (JT25) and it is surely ascribed to a non- enzymatic browning reaction favored by temperature, with a slight affect shown by added phenols. However, all samples showed a* values <0, which indicates a shift of color towards green, according to Sadecka et al. (2014). The measured b* values were >0 and they maintained constant in all samples over time.
Table 2. Color analysis of orange juice enriched during storage time. JT6 JA6 JB6 JC6 JT25 JC25 Sign. L* 1 39.90 ± 0.39a 40.29 ± 0.38a 40.07 ± 0.01a 40.44 ± 0.33a 39.84 ± 0.66a 40.50 ± 0.13a ns 15 39.67 ± 0.12aA 40.19 ± 0.05aA 38.61 ± 0.53bB 38.53 ± 0.04bB 38.72 ± 0.09abB 37.93 ± 0.14bB ** 30 38.16 ± 0.48bA 38.09 ± 0.51bA 37.81 ± 0.01bA 38.61 ± 0.14bA 37.41 ± 0.02bcAB 36.49 ± 0.32cB ** 45 36.48 ± 0.02cB 38.10 ± 0.04bA 37.95 ± 0.28bA 38.25 ± 0.14bA 36.50 ± 0.62cB 35.82 ± 0.01cdB ** 60 38.24 ± 0.31bA 38.03 ± 0.84bA 38.13 ± 0.26bA 38.18 ± 0.29bA 35.81 ± 0.41cB 34.87 ± 0.67dB ** Sign. ** ** ** ** ** ** a* 1 -3.59 ± 0.47 -3.09 ± 0.58 -2.92 ± 0.48 -2.91 ± 0.46 -3.48 ± 0.84b -3.17 ± 0.42c ns 15 -3.67 ± 0.06 -3.71 ± 0.51 -3.01 ± 0.61 -2.94 ± 0.08 -3.64 ± 0.60b -2.81 ± 0.27c ns 30 -3.28 ± 0.56B -2.75 ± 0.25AB -2.74 ± 0.31AB -2.62 ± 0.06AB -1.88 ± 0.31abA -1.66 ± 0.28bA * 45 -2.82 ± 0.76B -2.81 ± 0.21B -2.76 ± 0.34B -2.71 ± 0.16B -1.01 ± 0.23aA -1.60 ± 0bAB ** 60 -2.78 ± 0.01B -2.55 ± 0.70B -2.46 ± 0.48B -2.56 ± 0.43B -1.06 ± 0.53aAB -0.44 ± 0.15aA ** Sign. ns ns ns ns * ** b* 1 26.27 ± 1.00 27.04 ± 0.90 27.20 ± 0.56 27.27 ± 0.65 26.28 ± 1.40 28.59 ± 1.91 ns 15 26.32 ± 0.28 25.66 ± 1.72 26.21 ± 1.06 26.26 ± 0.09 24.83 ± 0.55 26.18 ± 0.56 ns 30 25.91 ± 1.06 26.72 ± 0.11 26.44 ± 0.53 27.03 ± 0.12 25.90 ± 0.14 25.60 ± 0.15 ns 45 25.01 ± 0.45 26.30 ± 0.11 26.35 ± 0.49 26.55 ± 0-25 26.12 ± 0.45 25.93 ± 1.67 ns 60 25.76 ± 0.12 25.99 ± 0.73 26.14 ± 0.73 26.07 ± 0.62 25.41 ± 0.24 24.63 ± 0.74 ns Sign. ns ns ns ns ns ns h* 1 97.80 ± 1.32 96.55 ± 1.43 96.14 ± 1.14 96.10 ± 1.11 96.79 ± 1.08ab 96.67 ± 0.93a ns 15 97.94 ± 0.21 96.72 ± 0.52 96.59 ± 1.57 96.35 ± 0.24 98.36 ± 1.55a 96.14 ± 0.71ab ns 30 97.24 ± 1.52A 95.88 ± 0.56AB 95.92 ± 0.77AB 95.55 ± 0.15AB 93.92 ± 0.34bcB 93.72 ± 0.65bcB * 45 96.44 ± 1.83A 96.10 ± 0.49A 96.00 ± 0,84A 95.82 ± 0.40A 92.22 ± 0.48cB 93.54 ± 0.22cdB * 60 96.17 ± 0.05A 95.63 ± 1.68A 95.39 ± 1.19A 95.63 ± 1.06A 92.39 ± 1.24cAB 91.02 ± 0.39dB * Sign. n.s. n.s. n.s. n.s. ** **
The data are presented as means ± SDs. **Significance at p < 0.01. *Significance at p < 0.05; n.s. not significant. By Tukey’s multiple range test, small letters show differences in the sample at each monitoring time and capital letters show differences among the different samples.
3.2 Microbiological results
As expected, the commercial orange juice did not show measurable mesophilic aerobes. We detected microbial population, mainly moulds, and yeasts during the whole store in a concentration of less than 100 UFC/mL independently of the storage temperature. No differences were found among the control and enriched juices (data not shown). Indeed, the low pH may give the juice a good potential of inhibiting the growth of microorganism which cause spoilage (Ojo et al., 2013).
3.3 HPLC results
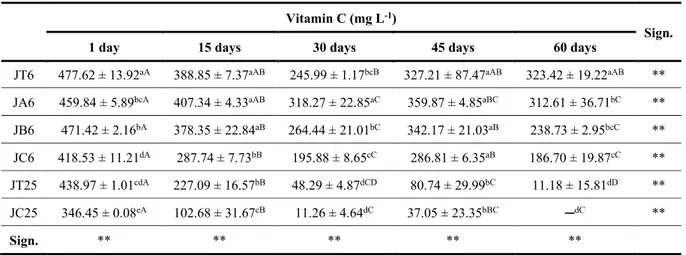
According to literature data, the content of Vitamin C decreased during storage related to temperature (Chaudhary et al., 2016). The concentration of Vitamin C of the control sample was following the values obtained by Plaza et al. (2006); this compound decreased faster at 25 °C than at 6 °C. At 6 °C, vitamin C decrement of 18% after 15 days and 32% after 60 days (Table 3) was observed for the control and the lower phenol concentrated samples (JA6). In contrast, more than 50% of Vitamin C was lost at the end of the storage in the sample enriched with the highest concentration of hydroxytyrosol. About 50% loss of vitamin C was observed in control and lower phenol-concentrated sample (JA6) at the end of the refrigerated storage. Furthermore, about 70% of vitamin C was lost after 15 days of storage at 25 °C and completely degraded after 60 days of storage in the JC25 sample. At the same temperature, the control showed a loss of 48% after 15 days while a loss of 97% at the end of the storage. The addition of hydroxytyrosol seemed to have a key role in the degradation of ascorbic acid. At both temperatures, the percentage of loss of ascorbic acid increased proportionally to the hydroxytyrosol concentration. At the end of storage, the loss of ascorbic acid was 32%, 49%, and 55% for the JA6, JB6, and JC6 samples respectively. HPLC analysis revealed that the time did not affect significantly the amount of hydroxytyrosol in the sample JA6 during storage (Table 4), while significant variations were detected for the other samples without a clear trend. The variation of hydroxytyrosol increased with its concentration on the sample, this observation could ascribe both to an absorption or complexation effect due to other juice’s components or interaction with ascorbic acid, as previously described. An increase of hydroxytyrosol and a decrease of ascorbic acid were detected on the 30th day for all samples. It has been proposed that in binary mixtures of ascorbic acid and different antioxidants, synergistic and antagonistic interactions occurred as a result of coupled reactions of regeneration depending on the efficiency of the considered antioxidant and on the conditions behind the evaluation (Aoun & Makris, 2012; Palafox-Carlos et al., 2012).
Table 3. Changes in the content of vitamin C measured by HPLC during storage.
Vitamin C (mg L-1)
Sign.
1 day 15 days 30 days 45 days 60 days
JT6 477.62 ± 13.92aA 388.85 ± 7.37aAB 245.99 ± 1.17bcB 327.21 ± 87.47aAB 323.42 ± 19.22aAB **
JA6 459.84 ± 5.89bcA 407.34 ± 4.33aAB 318.27 ± 22.85aC 359.87 ± 4.85aBC 312.61 ± 36.71bC **
JB6 471.42 ± 2.16bA 378.35 ± 22.84aB 264.44 ± 21.01bC 342.17 ± 21.03aB 238.73 ± 2.95bcC **
JC6 418.53 ± 11.21dA 287.74 ± 7.73bB 195.88 ± 8.65cC 286.81 ± 6.35aB 186.70 ± 19.87cC **
JT25 438.97 ± 1.01cdA 227.09 ± 16.57bB 48.29 ± 4.87dCD 80.74 ± 29.99bC 11.18 ± 15.81dD **
JC25 346.45 ± 0.08eA 102.68 ± 31.67cB 11.26 ± 4.64dC 37.05 ± 23.35bBC ─dC **
Sign. ** ** ** ** **
The data are presented as means ± SDs. **Significance at p < 0.01. By Tukey’s multiple range test, small letters show differences in the sample at each storage time and capital letters show differences among the different samples
Table 4. Changes in the content of phenolic compounds measured by HPLC in orange juice enriched during storage.
Compounds (mg Syringic Acid L-1) Time Samples days JT6 JA6 JB6 JC6 JT25 JC25 Hydroxytirosol 1 - 49 ± 4 133 ± 6.8 b 263 ± 1d - 285 ± 2b 15 - 56 ± 2 162 ± 8ab 293 ± 2.6bc - 359 ± 3a
Compounds (mg Syringic Acid L-1) Time Samples days JT6 JA6 JB6 JC6 JT25 JC25 30 - 62 ± 4 172 ± 7a 331 ± 12a - 345 ± 29a 45 - 48 ± 1 147 ± 10ab 278 ± 1cd - 359 ± 12a 60 - 48 ± 6 160 ± 12ab 307 ± 1b - 381 ± 1a Sign n.s. * ** ** Tyrosol 1 - 13 ± 1b 29 ± 2b 56 ± 0b - 61 ± 0 15 - 9 ± 1b 29.3 ± 2b 50 ± 3b - 63 ± 0 30 - 10 ± 2a 33 ± 2ab 66 ± 2a - 70 ± 8 45 - 19 ± 0b 37 ± 2a 57 ± 1ab - 71 ± 9 60 - 11 ± 1b 29 ± 2b 55 ± 4b - 64 ± 0 Sign ** * ** n.s. Vanillic acid 1 - 0.5 ± 0.2 0.5 ± 0.1c 1.5 ± 0.1b - 1.4 ± 0.1c 15 - 0.3 ± 0.0 1.2 ± 0.0b 2.1 ± 0.3b - 2.8 ± 0.1b 30 - 0.4 ± 0.1 1.7 ± 0.2a 3.2 ± 0.4a - 3.1 ± 0.3ab 45 - 0.3 ± 0.0 0.7 ± 0.1bc 1.7 ± 0.2b - 1.7 ± 0.3c 60 - 0.4 ± 0.1 1.2 ± 0.2a 3.2 ± 0.1a - 3.6 ± 0.1ab Sign. n.s. ** ** **
The data are presented as means ± SDs. **Significance at p < 0.01.*Significance at p < 0.05. n.s. not significant.
3.4 Antioxidant activity results
The antioxidant activity of different samples was evaluated using DPPH (Table 5) and ABTS (Table 6) assays. Different authors recommended the DPPH assay as an easy and accurate method for measuring the antioxidant activity of orange juices and other fruit products (Caridi et al., 2017; De Bruno et al., 2019; Villaño et al., 2007; Kelebek et al., 2009; Klimczak et al., 2007). Nevertheless, the ABTS assay has the advantage that it can be used in acidic conditions, unlike the DPPH method, which is sensitive to these conditions (Miguel et al., 2009). This study reported both of these determinations to evaluate possible differences. Table 5 shows the antioxidant activity measured as the percentage of inhibition. On the 1st day of storage, there were no significant differences for all the treated juice samples while the control showed lower radical inhibition. The increased concentration of added phenols did not show an increase of antioxidant activity of samples, the hydroxytyrosol exerted its ability at low concentrations when another antioxidant like ascorbic acid is present. For all samples, we observed a significant decrease of scavenging activity over time, which was faster at 25 °C than at 6 °C, according to what was observed for Vitamin C amount. At 6 °C, a decrease of 3% of DPPH inhibition was observed in JT6, while it ranged from 18 to 12% in the-enriched samples. These data were in agreement with Shivashankara et al. (2004), who evidenced a constant antioxidant activity in fruit juice up to 20 days of storage at low temperature and a further decrease in the time. JT25 sample stored at 25 °C reduced 12% its antioxidant activity, confirming the effect of temperature on it. The significant contributory role of ascorbic acid in the antioxidant activity performed by DPPH assay was underlined by the positive correlation between ascorbic acid and DPPH assay (r = 0.80). From this data about the DPPH assay, it is not clear if the binary system ascorbic acid-hydroxytyrosol gave a synergistic or antagonistic effect as Aoun & Makris (2012) reported.
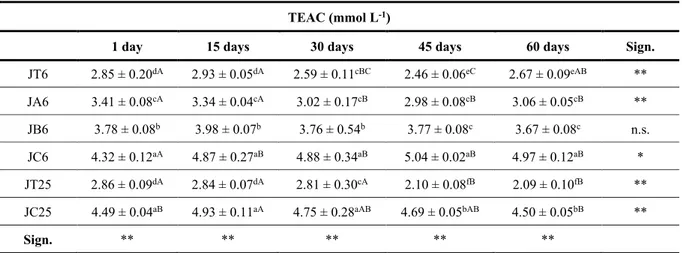
Concerning the ABTS assay, ANOVA analysis showed that TEAC values were significantly different among samples (Table 6). On the 1st day, the JT6 sample showed the minimum value (2.85 mmol L-1), while the sample added with the highest amount of hydroxytyrosol (JC6) showed the maximum result
(4.49 mmol L-1). Storage time did not affect the stability of the samples. the JB6 sample did not show
variations over time (p > 0.05), while the JC6 sample only had slight variations (p < 0.05). The slight increase of antioxidant activity measured after 60 days of storage in samples at high concentration of hydroxytyrosol (JC6) could be explained as the more adequacy of the assay, but also to a synergic effect of the binary system ascorbic acid-polyphenol.
Table 5. Antioxidant activity (measured by DPPH assay) in orange juice enriched during storage at different temperature.
DPPH(% of inhibition)
1 day 15 days 30 days 45 days 60 days Sign.
JT6 56.5 ± 1.1bAB 57.9 ± 0.4cA 54.9 ± 1.3abB 52.1 ± 0.5bC 54.3 ± 1.3bB ** JA6 60.9 ± 0.6aA 58.4 ± 1.2cA 54.2 ± 1.1bB 51.4 ± 1.9bC 49.2 ± 0.8cC ** JB6 60.1 ± 1.9aA 59.7 ± 1.6cbB 55.3 ± 1.5abC 54.1 ± 2.5abC 49.9 ± 1.5cD ** JC6 61.1 ± 1.4aB 64.9 ± 1.4aA 59.3 ± 1.8aAB 58.5 ± 0.5aBC 49.9 ± 1.6aC ** JT25 56.2 ± 1.5bA 50.8 ± 1.6dA 41.5 ± 4.5cB 30.1 ± 5.6dC 49.9 ± 1.9eC ** JC25 59.6 ± 0.4aA 61.8 ± 0.8bA 45.9 ± 0.4cB 42.1 ± 2.2cC 49.9 ± 0.9dD ** Sign. * ** ** ** **
The data are presented as means ± SDs. **Significance at p < 0.01.*Significance at p < 0.05. By Tukey’s multiple range test, small letters show differences in the sample at each storage time and capital letters show differences among the different samples. DPPH: 2,2-diphenyl-1-picrylhydrazyl.
Table 6. Antioxidant activity (measured by ABTS assay) in orange juice enriched during storage at different temperature.
TEAC (mmol L-1)
1 day 15 days 30 days 45 days 60 days Sign.
JT6 2.85 ± 0.20dA 2.93 ± 0.05dA 2.59 ± 0.11cBC 2.46 ± 0.06eC 2.67 ± 0.09eAB ** JA6 3.41 ± 0.08cA 3.34 ± 0.04cA 3.02 ± 0.17cB 2.98 ± 0.08cB 3.06 ± 0.05cB ** JB6 3.78 ± 0.08b 3.98 ± 0.07b 3.76 ± 0.54b 3.77 ± 0.08c 3.67 ± 0.08c n.s. JC6 4.32 ± 0.12aA 4.87 ± 0.27aB 4.88 ± 0.34aB 5.04 ± 0.02aB 4.97 ± 0.12aB * JT25 2.86 ± 0.09dA 2.84 ± 0.07dA 2.81 ± 0.30cA 2.10 ± 0.08fB 2.09 ± 0.10fB ** JC25 4.49 ± 0.04aB 4.93 ± 0.11aA 4.75 ± 0.28aAB 4.69 ± 0.05bAB 4.50 ± 0.05bB ** Sign. ** ** ** ** **
The data are presented as means ± SDs. **Significance at p < 0.01. *Significance at p < 0.05. n.s. not significant. By Tukey’s multiple range test, small letters show differences in the sample at each storage time and capital letters show differences among the different samples.
3.5 Sensory analysis results
Since sensory analysis is an integral part of the process of development of new food products, we compared the triangular to detect differences in flavor between JT6 and JA6 samples: The number of people who recognized differences between the samples were 38 out of 48 tested. Based on α (0.2), β (0.05), and Pd (40%), these values were higher than the expected maximum number of correct answers (22). These data
confirm that the samples were significantly different (p < 0.05) (Lawless & Heymann, 2010). We can conclude that the addition of hydroxytyrosol modified the flavor of the “conventional” orange juice. Based on the results of the triangle test, a study of the perception of “negative sensation” (abnormal flavor and bitterness) was also performed. No testers detected abnormal flavor while a light bitterness sensation was detected in all samples. Even though all samples were recognized as different from the conventional juice, the addition of hydroxytyrosol seemed to not change negatively the taste of the final product.
4 Conclusion
This manuscript shows that the addition of hydroxytyrosol seemed to play a key role in the degradation of ascorbic acid. At 6 °C, the vitamin C content decreased in enriched samples with the increasing of hydroxytyrosol concentration. Moreover, we observed a vitamin C loss of about 70% in the sample enriched and stored at 25 °C after two weeks; the vitamin completely disappeared after 60 days. These results could be linked to the antagonistic phenomena which occurred between ascorbic acid and hydroxytyrosol, assuming that the ascorbic acid has a protective effect on the hydroxytyrosol. We observed a strong correlation between antioxidant activity (DPPH assay) and vitamin C content whereas a very low correlation was observed with hydroxytyrosol concentration. In contrast, not significant variations or slight increases were detected for TEAC values over time, suggesting that the hydroxytyrosol content would have more influence on the antioxidant activity determined by the ABTS assay. This is also confirmed by the strong correlation between TEAC values and hydroxytyrosol while a negative correlation was obtained concerning ascorbic acid. This aspect points out the importance of a correct antioxidant assay. From the sensorial analysis, we concluded that the addition of hydroxytyrosol altered the flavor of “conventional” orange juice, but it did not adversely affect the taste of the final product.
References
Aneja, K. R., Dhiman, R., Aggarwal, N. K., Kumar, V., & Kaur, M. (2014). Microbes associated with freshly prepared juices of citrus and carrots. International Journal of Food Sciences, 2014, 408085. PMid:26904628.
http://dx.doi.org/10.1155/2014/408085
Aoun, M., & Makris, D. P. (2012). Binary mixtures of natural polyphenolic antioxidants with ascorbic acid: Impact of interactions on the antiradical activity. International Food Research Journal, 19(2), 603-606.
Bolling, B. W., Chen, Y. Y., & Chen, C. Y. O. (2013). Contributions of phenolics and added vitamin C to the antioxidant capacity of pomegranate and grape juices: synergism and antagonism among constituents. International Journal of Food Science &
Technology, 48(12), 2650-2658. PMid:24187439. http://dx.doi.org/10.1111/ijfs.12261
Brand-Williams, W., Cuvelier, M. E., & Berset, C. (1995). Use of free radical method to evaluate antioxidant activity.
Lebensmittel-Wissenschaft + Technologie, 28(1), 25-30. http://dx.doi.org/10.1016/S0023-6438(95)80008-5
Caridi, A., De Bruno, A., De Salvo, E., Piscopo, A., Poiana, M., & Sidari, R. (2017). Selected yeasts to enhance phenolic content and quality in red wine from low pigmented grapes. European Food Research and Technology, 243(3), 367-378.
http://dx.doi.org/10.1007/s00217-016-2750-9
Chaudhary, P. R., Yu, X., Jayaprakasha, G. K., & Patil, B. S. (2016). Influence of storage temperature and low‐temperature conditioning on the levels of health‐promoting compounds in Rio Red grapefruit. Food Science & Nutrition, 5(3), 545-553. PMid:28572940. http://dx.doi.org/10.1002/fsn3.429
Cossu, A., Posadino, A. M., Giordo, R., Emanueli, C., Sanguinetti, A. M., Piscopo, A., Poiana, M., Capobianco, G., Piga, A., & Pintus, G. (2012). Apricot melanoidins prevent oxidative endothelial cell death by counteracting mitochondrial oxidation and membrane depolarization. PLoS One, 7(11), e48817. PMid:23144984. http://dx.doi.org/10.1371/journal.pone.0048817
De Bruno, A., Romeo, R., Fedele, F. L., Sicari, A., Piscopo, A., & Poiana, M. (2018). Antioxidant activity shown by olive pomace extracts. Journal of Environmental Science and Health. Part. B, Pesticides, Food Contaminants, and Agricultural Wastes, 53(8), 526-533. PMid:29708834. http://dx.doi.org/10.1080/03601234.2018.1462928
De Bruno, A., Zappia, A., Piscopo, A., & Poiana, M. (2019). Qualitative evaluation of fermented olives grown in Southern Italy (cvs. Carolea, Grossa of Gerace and Nocellara Messinese). Emirates Journal of Food and Agriculture, 31(8), 587-596. http://dx.doi.org/10.9755/ejfa.2019.v31.i8.1985
Eke-Ejiofor, J. (2016). Microbial population and shelf life study of spiced water melon juice. European Journal of Food Science
and Technology, 4(4), 1-11.
Faustino, M., Veiga, M., Sousa, P., Costa, E. M., Silva, S., & Pintado, M. E. (2019). Agro-food byproducts as a new source of natural food additives. Molecules, 24(6), 1056-1078. PMid:30889812. http://dx.doi.org/10.3390/molecules24061056
Fawole, O. A., & Opara, U. L. (2016). Stability of total phenolic concentration and antioxidant capacity of extracts from pomegranate co-products subjected to in vitro digestion. BMC Complementary and Alternative Medicine, 16(1), 358. PMid:27618992. http://dx.doi.org/10.1186/s12906-016-1343-2
González-Molina, E., Moreno, D. A., & García-Viguera, C. (2009). A new drink rich in healthy bioactives combining lemon and pomegranate juices. Food Chemistry, 115(4), 1364-1372. http://dx.doi.org/10.1016/j.foodchem.2009.01.056
Guntarti, A., & Hutami, E. N. (2019). Validation and vitamin C testing in crystal guava (Psidium guajava L.) with variations of origin with the HPLC method (High Performance Liquid Chromatography). International Journal of Chemistry, 11(1), 52-59. http://dx.doi.org/10.5539/ijc.v11n1p52
Kaddumukasa, P. P., Imathiu, S. M., Mathara, J. M., & Nakavuma, J. L. (2017). Influence of physicochemical parameters on storage stability: Microbiological quality of fresh unpasteurized fruit juices. Food Science & Nutrition, 5(6), 1098-1105. PMid:29188037. http://dx.doi.org/10.1002/fsn3.500
Kelebek, H., & Selli, S. (2014). Identification of phenolic compositions and the antioxidant capacity of mandarin juices and wines. Journal of Food Science and Technology, 51(6), 1094-1101. PMid:24876641. http://dx.doi.org/10.1007/s13197-011-0606-7
Kelebek, H., Selli, S., Canbas, A., & Cabaroglu, T. (2009). HPLC determination of organic acids, sugars, phenolic compositions and antioxidant capacity of orange juice and orange wine made from a Turkish cv. Kozan. Microchemical Journal, 91(2), 187-192. http://dx.doi.org/10.1016/j.microc.2008.10.008
Klimczak, I., Małecka, M., Szlachta, M., & Gliszczyńska-Świgło, A. (2007). Effect of storage on the content of polyphenols, vitamin C and the antioxidant activity of orange juices. Journal of Food Composition and Analysis, 20(3), 313-322. http://dx.doi.org/10.1016/j.jfca.2006.02.012
Lawless, H. T., & Heymann, H. (2010). Sensory evaluation of food: Principles and practices. New York: Springer. http://dx.doi.org/10.1007/978-1-4419-6488-5.
Madrau, M., Piscopo, A., Sanguinetti, A. M., Del Caro, A., Poiana, M., Romeo, F. V., & Piga, A. (2009). Effect of drying temperature on polyphenolic content and antioxidant activity of apricots. European Food Research and Technology, 228(3), 441-448. http://dx.doi.org/10.1007/s00217-008-0951-6
Meléndez-Martínez, A. J., Escudero-Gilete, M. L., Vicario, I. M., & Heredia, F. J. (2010). Effect of increased acidity on the carotenoid pattern and colour of orange juice. European Food Research and Technology, 230(3), 527-532.
http://dx.doi.org/10.1007/s00217-009-1190-1
Miguel, M. G., Duarte, A., Nunes, S., Sustelo, V., Martins, D., & Dandlen, S. A. (2009). Ascorbic acid and flavanone glycosides in citrus: Relationship with antioxidant activity. Journal of Food Agriculture and Environment, 7(2), 222-227. Retrieved in 2019, May 23, from www.world-food.net
Mu, X., Wang, P., Du, J., Gao, Y. G., & Zhang, J. (2018). Comparison of fruit organic acids and metabolism-related gene expression between Cerasus humilis (Bge.) Sok and Cerasus glandulosa (Thunb.) Lois. PLoS One, 13(4), e0196537. PMid:29698526. http://dx.doi.org/10.1371/journal.pone.0196537
Ojo, R. J., Abaya, J. Y., Akintayo, C. O., & Seriki, S. (2013). Effects of nigerian market storage conditions on ascorbic acid contents of selected tetrapak packaged citrus fruit juice. Journal of Agricultural and Biological Science, 8(2), 179-183. Retrieved in 2019, May 23, from www.arpnjournals.com
Palafox-Carlos, H., Gil-Chávez, J., Sotelo-Mundo, R., Namiesnik, J., Gorinstein, S., & González-Aguilar, G. (2012). Antioxidant interactions between major phenolic compounds found in ‘Ataulfo’mango pulp: Chlorogenic, gallic, protocatechuic and vanillic acids. Molecules, 17(11), 12657-12664. PMid:23103532. http://dx.doi.org/10.3390/molecules171112657
Pincemail, J., Tabart, J., Defraigne, J. O., Dommes, J., & Kevers, C. (2015). The total antioxidant capacity of foods: A reappraisal. application to commercial orange juices. Journal of Antioxidant Activity, 1(2), 1-7.
http://dx.doi.org/10.14302/issn.2471-2140.jaa-15-715
Plaza, L., Sánchez-Moreno, C., Elez-Martínez, P., de Ancos, B., Martín-Belloso, O., & Cano, M. P. (2006). Effect of refrigerated storage on vitamin C and antioxidant activity of orange juice processed by high-pressure or pulsed electric fields with regard to low pasteurization. European Food Research and Technology, 223(4), 487-493. http://dx.doi.org/10.1007/s00217-005-0228-2 Ramful, D., Tarnus, E., Aruoma, O. I., Bourdon, E., & Bahorun, T. (2011). Polyphenol composition, vitamin C content and antioxidant capacity of Mauritian citrus fruit pulps. Food Research International, 44(7), 2088-2099.
http://dx.doi.org/10.1016/j.foodres.2011.03.056
Ramírez, E., García-García, P., de Castro, A., Romero, C., & Brenes, M. (2013). Debittering of black dry-salted olives.
European Journal of Lipid Science and Technology, 115(11), 1319-1324. http://dx.doi.org/10.1002/ejlt.201300167
Rapisarda, P., Bellomo, S. E., & Intelisano, S. (2001). Storage temperature effects on blood orange fruit quality. Journal of
Agricultural and Food Chemistry, 49(7), 3230-3235. PMid:11453756. http://dx.doi.org/10.1021/jf010032l
Rapisarda, P., Bianco, M. L., Pannuzzo, P., & Timpanaro, N. (2008). Effect of cold storage on vitamin C, phenolics and antioxidant activity of five orange genotypes [Citrus sinensis (L.) Osbeck]. Postharvest Biology and Technology, 49(3), 348-354. http://dx.doi.org/10.1016/j.postharvbio.2008.02.002
Romeo, R., De Bruno, A., Imeneo, V., Piscopo, A., & Poiana, M. (2019). Evaluation of enrichment with antioxidants from olive oil mill wastes in hydrophilic model system. Journal of Food Processing and Preservation, 43(11), e14211.
http://dx.doi.org/10.1111/jfpp.14211
Sadecka, J., Polovka, M., Kolek, E., Belajova, E., Tobolkova, B., Dasko, L., & Durek, J. (2014). Orange juice with pulp: Impact of pasteurization and storage on flavour, polyphenols, ascorbic acid and antioxidant activity. Journal of Food and Nutrition
Shivashankara, K. S., Isobe, S., Al-Haq, M. I., Takenaka, M., & Shiina, T. (2004). Fruit antioxidant activity, ascorbic acid, total phenol, quercitin, and carotene of Irwin mango fruits stored at low temperature after high electric field treatment. Journal of
Agricultural and Food Chemistry, 52(5), 1281-1286. PMid:14995134. http://dx.doi.org/10.1021/jf030243l
Sicari, V., Pellicanò, T. M., Giuffrè, A. M., Zappia, C., & Capocasale, M. (2016). Bioactive compounds and antioxidant activity of citrus juices produced from varieties cultivated in Calabria. Journal of Food Measurement and Characterization, 10(4), 773-780. http://dx.doi.org/10.1007/s11694-016-9362-8
Sicari, V., Pellicanò, T. M., Laganà, V., & Poiana, M. (2018). Use of orange by‐products (dry peel) as an alternative gelling agent for marmalade production: Evaluation of antioxidant activity and inhibition of HMF formation during different storage
temperature. Journal of Food Processing and Preservation, 42(2), e13429. http://dx.doi.org/10.1111/jfpp.13429 Singh, J. P., Kaur, A., Shevkani, K., & Singh, N. J. (2016). Composition, bioactive compounds and antioxidant activity of common Indian fruits and vegetables. Journal of Food Science and Technology, 53(11), 4056-4066. PMid:28035161. http://dx.doi.org/10.1007/s13197-016-2412-8
Stinco, C. M., Baroni, M. V., Di Paola Naranjo, R. D., Wunderlin, D. A., Heredia, F. J., Meléndez-Martínez, A. J., & Vicario, I. M. (2015). Hydrophilic antioxidant compounds in orange juice from different fruit cultivars: Composition and antioxidant activity evaluated by chemical and cellular based (Saccharomyces cerevisiae) assays. Journal of Food Composition and Analysis, 37, 1-10. http://dx.doi.org/10.1016/j.jfca.2014.09.006
Tsai, H. L., Chang, S. K., & Chang, S. J. (2007). Antioxidant content and free radical scavenging ability of fresh red pummelo [Citrus grandis (L.) Osbeck] juice and freeze-dried products. Journal of Agricultural and Food Chemistry, 55(8), 2867-2872. PMid:17373816. http://dx.doi.org/10.1021/jf0633847
Vieira, F. N., Lourenço, S., Fidalgo, L. G., Santos, S., Silvestre, A., Jerónimo, E., & Saraiva, J. A. (2018). Long-term effect on bioactive components and antioxidant activity of thermal and high-pressure pasteurization of orange juice. Molecules, 23(10), 2706. PMid:30347848. http://dx.doi.org/10.3390/molecules23102706
Villaño, D., Fernandez-Pachón, M. S., Moyá, M. L., Troncoso, A. M., & García-Parrilla, M. C. (2007). Radical scavenging ability of polyphenolic compounds towards DPPH free radical. Talanta, 71(1), 230-235. PMid:19071293.
http://dx.doi.org/10.1016/j.talanta.2006.03.050
Zappia, A., De Bruno, A., Torino, R., Piscopo, A., & Poiana, M. (2018). Influence of light exposure during cold storage of minimally processed vegetables (Valeriana sp.). Journal of Food Quality, 2018, 1-7. http://dx.doi.org/10.1155/2018/4694793
Funding: This work has been supported by AGER 2 Project. grant number 2016-0105.