Contents lists available atScienceDirect
Talanta
journal homepage:www.elsevier.com/locate/talanta
Dual-modality impedimetric immunosensor for early detection of
prostate-specific antigen and myoglobin markers based on antibody-molecularly
imprinted polymer
Pari Karami
a, Hasan Bagheri
b,∗, Mohammad Johari-Ahar
c,d, Hosein Khoshsafar
a,
Fabiana Arduini
e, Abbas Afkhami
faResearch and Development Department, Farin Behbood Tashkhis LTD, Tehran, Iran
bChemical Injuries Research Center, Systems Biology and Poisonings Institute, Baqiyatallah University of Medical Sciences, Tehran, Iran cBiosensors and Bioelectronics Research Center (BBRC), Ardabil University of Medical Sciences, Ardabil, Iran
dDepartment of Bioanalytical Sciences and Medicinal Chemistry, School of Pharmacy, Ardabil University of Medical Sciences, Ardabil, Iran eDepartment of Chemical Science and Technologies, University of Rome Tor Vergata, Via della Ricerca Scientifica, 00133, Rome, Italy fFaculty of Chemistry, Bu-Ali Sina University, Hamedan, Iran
A R T I C L E I N F O Keywords:
Impedimetric immunosensor Molecularly imprinted polymer Prostate-specific antigen Myoglobin marker Simultaneous determination
A B S T R A C T
A new dual-modality immunosensor based on molecularly imprinted polymer (MIP) and a nanostructured biosensing layer has fabricated for the simultaneous detection of two important markers including prostate-specific antigen (PSA) and myoglobin (Myo) in human serum and urine samples. In the first step, 3,3′-dithio-dipropionic acid di(N-hydroxysuccinimide ester) (DSP) was self-assembled on a gold screen printed electrode (SPE). Then, the target proteins were attached covalently to the DSP-SPE. The imprinted cocktail polymer ((MIP (PSA, Myo)-SPE)) was synthesized at the SPE surface using acrylamide as monomer, N,N′-methylenebisacryla-mide as a crosslinker, and PSA and Myo as the templates, respectively. The MIP-SPE was specific for the im-pedimetric sensing of PSA and Myo. After that, a nanocomposite (NCP) was synthesized based on the decorated magnetite nanoparticles with multi-walled carbon nanotube, graphene oxide and specific antibody for PSA (Ab). Then, NCP incubated with (MIP(PSA, Myo)-SPE. The modified electrodes and synthesized nanoparticles were characterized using electrochemical impedance spectroscopy, dynamic light scattering, surface plasmon re-sonance and scanning electron microscopy. The limits of detections were found to be 5.4 pg mL−1 and
0.83 ng mL−1with the linear dynamic ranges of 0.01–100 and 1–20000 ng mL−1for PSA and Myo, respectively.
The ability of proposed biosensor to detect PSA and Myo simultaneously with high sensitivity and specificity offers a powerful opportunity for the new generation of biosensors. This dual-analyte specific receptors-based device is highly desired for the integration with lab-on-chip kits to measure a wide panel of biomarkers present at ultralow levels during early stages of diseases progress.
1. Introduction
Prostate-specific antigen (PSA) is a protein that is expressed in high levels by malignant cells of the prostate gland. High content of PSA in men's blood is known as a biomarker for prostate cancer or in-flammation, rising age-dependently above 50. Therefore, PSA level is practical for tracing the evolution and response of cancer patients to chemotherapy. PSA test has risen rapidly amongst asymptomatic men worldwide because its determination offers more benefits over a rectal exam or transrectal ultrasonography in the screening of prostate can-cers. In contrast to these methods, PSA results are quantitative and
reliable, as well as the processes are more acceptable to cancer sufferers [1]. Although PSA is one of the valuable biomarkers in the field of oncology, its blood concentration increases in other prostate disease such as benign prostatic hyperplasia (BPH). There is no specific normal or abnormal level of PSA in the blood, and levels may vary over time in the same man. In the past, PSA levels of 4.0 ng mL−1and lower was
considered as normal values. Therefore, in PSA level above 4.0 ng mL−1, a prostate biopsy was often recommend to determine
whether prostate cancer was present. However, in some studies prostate cancer have been reported in cases with PSA levels below 4.0 ng mL−1,
and many men with higher PSA levels did not have prostate cancer [2].
https://doi.org/10.1016/j.talanta.2019.04.061
Received 15 March 2019; Received in revised form 22 April 2019; Accepted 23 April 2019
∗Corresponding author.
E-mail addresses:[email protected],[email protected](H. Bagheri).
Talanta 202 (2019) 111–122
Available online 27 April 2019
0039-9140/ © 2019 Elsevier B.V. All rights reserved.
For myoglobin (Myo), its plasma concentration measured using im-munoenzymatic sandwich assay has been reported to be in the normal range of 0–70 ng mL−1. In references, the reported value for normal
range of plasma Myo differs slightly [3–5]. However, Myo has been shown to increase above the normal range in prostate cancer patients [6,7].
One strategy to overcome this limitation is to analyze Myo as a biomarker being co-expressed with PSA in prostate cancer. Myo ex-pression is significantly associated with steroid hormone signaling and markers of hypoxia in prostate cancer cases and is of great value as a biomarker in early stage diagnosis [6,7].
Until now, several analytical techniques have been developed for determination of PSA and Myo individually. These include chromato-graphy [8,9], mass spectroscopy [10,11], fluorescence spectroscopy [12,13], nuclear magnetic resonance spectroscopy [14,15], white light reflectance spectroscopy [16,17], capillary electrophoresis [18], che-miluminescence [19], enzyme-linked immunosorbent assays (ELISA) [20,21], electrochemiluminescence [22,23], radioimmunoassay [24,25], time-resolved immunofluorometric assay [26], surface plasmon fluorescence immunoassay [27], bioluminescent immunoassay [28], electrochemical [29], surface-enhanced Raman scattering [24,30] and microcantilever method [31]. Of these methods, biosensors espe-cially electrochemical types can offer some advantages in contrast to the commonly used sensing tools, including simultaneous analysis of biomarkers, capability of miniaturization, lower cost and simplicity of analysis [32–34].
Among electrochemical techniques used in biosensors development, electrochemical impedance spectroscopy (EIS) has attracted attention of analytical scientists due to its capability of monitoring electrode surface changes, allowing the sense of complicated interfacial bio-re-cognition events. Due to the non-destructive nature of EIS, analysis of binding events at the electrode surface with study of interfacial electron transfer leads to the minimum damage on bio-recognition elements and bio-analytes used in biosensor development, and more reproducible results can be recorded from the developed biosensor [35].
Screen-printed electrodes (SPE) are innovative strips designed for working with microvolumes of samples. In this type of electrode, working, reference and counter electrodes are printed on a polymeric substrate with a reduced sizes in contrast to conventional electrodes, showing some advantages such as lower cost, disposability and flex-ibility of analysis [36,37].
From bio-recognition elements used such as antibody, aptamer, nucleic acid hybridizing stands, molecularly imprinted polymers (MIPs), as synthetic receptors, is encouraging an alternative to biomo-lecules in the construction of biosensors. Such materials are synthesized in the presence of functional monomers, cross-linker and analyte (template) by covalent and noncovalent mechanisms [38,39]. The ad-vantages of MIPs compared to biological counterparts, are their re-sistance to high temperatures and acidic or basic conditions, ease of construction, low cost and reusability [40,41].
In this work, we report a novel, low cost, MIP-based biosensor to detect PSA and Myo in serum and urine samples simultaneously. The sensing strategy was designed by the combination of a molecularly imprinted technique and immunoassay method on the disposable SPE surface. MIP is prepared with methyl acrylate as monomer and ethylene glycol dimethacrylate as a crosslinker in the presence of PSA and Myo as templates. Nanocomposite was synthesized based on the Fe3O4
na-noparticles decorated with multi-walled carbon nanotube (MWCNT), graphene oxide (GO), MWCNT-GO and specific antibody for PSA (Ab). The determination process of analytes includes two steps: (1) Imprinted sensor was exposed to the solutions of PSA and Myo. Then recognition signal of PSA and Myo on the MIP sensor was detected using electro-chemical impedance spectroscopy (EIS) technique. (2) In the following step, the MIP was exposed to synthesized nanocomposite (NCP). After
an immune reaction between MIPs, PSA and the NCP, the im-munocomplex was formed, and the Rct values were measured. The
signal in the first step is proportional to the PSA and Myo concentration and the signal in the second step is proportional to the PSA con-centration. Furthermore, the difference in electrical resistance of two-step was proportional to the amount of Myo binding. All fabrication steps of the engineered biosensor are schematically illustrated in Scheme 1. The developed impedimetric sensor showed a high re-cognition capability toward PSA and Myo as well as a wide linear range and a low detection limit under optimized conditions.
2. Materials and methods
2.1. Chemicals
Potassium ferrocyanide (K4[Fe(CN)6]), Potassium ferricyanide
(K3[Fe(CN)6]), Potassium hydrogen phosphate (K2HPO4) and
Potassium dihydrogen phosphate (KH2PO4) obtained from Merck.
Ammonium persulphate, N, N′-methylenebisacrylamide (NNMBA) and acrylamide (AAM) purchased from Fluka. Sodium chloride, 3,3′-di-thiodipropionic acid di(N-hydroxysuccinimide ester) (DSP), potassium chloride, 3-(Trimethoxysilyl)-propylamine (APTS), Myo ELISA kit, hy-droquinone, oxalic acid (OxA) and Myo obtained from Sigma. Monoclonal anti-PSA antibody and PSA obtained from HyTest. PSA ELISA kit purchased from Abcam. Carboxylate multi-walled carbon nanotube (MWCNT), magnetite (Fe3O4), graphene oxide (GO)
pur-chased from Us-Nano. All solutions prepared in deionized water.
2.2. Preparation of NCP (Ab-GO-MWCNT-Fe3O4)
The aqueous solution containing Fe3O4(0.5 mg mL−1) and acetic
acid (0.01% v/v) were prepared and APTS solution (0.5% v/v) was added to this solution. The mixture stirred for 72 h which lead to par-ticles precipitation. The resulting modified APTS-Fe3O4 parpar-ticles were collected using a magnet and then were washed three times with deionized water. The washed precipitate stored in deionized water.
To activate carboxylic functional groups of MWCNT and GO, the borate buffer solution (pH 9) containing 20 mg mL−1 EDC and
10 mg mL−1NHS was added to solution of 1 mg mL−1MWCNT and GO
under stirring and incubated for 30 min at room temperature. To covalently attach APTS-Fe3O4nanoparticles with MWCNT and
GO, the activated nanoparticles incubated with APTS-Fe3O4
(0.2 mg mL−1) at room temperature and dark overnight. The prepared
MWCNT-GO-Fe3O4particles were collected using a magnet and then
were washed three times with deionized water to remove excess free and non-attached GOs and MWCNTs. The product stored in deionized water.
To covalently attach MWCNT-GO-Fe3O4 nanoparticles with Ab,
MWCNT-GO-Fe3O4 were dispersed in Ab solution at 8 °C and dark
under shaking (60 rpm) for 24 h. The prepared Ab-MWCNT-GO-Fe3O4
nanoparticles transferred to PBS buffer solution (10 mmol L−1)
con-taining sodium azide (0.1%) at 4 °C for following applications.
2.3. Architecture of MIP-SPE
All construction steps of developed biosensor are schematically demonstrated inScheme 1. DSP monolayer was self-assembled on SPE by soaking electrodes in the solution of DSP (10 mmol L−1) under
stirring at room temperature for 60 h. DSP-SPE were investigated using ESI, and charge transfer resistance (Rct) values were calculated. The
obtained DSP-SPE was washed with deionized water and then dried via nitrogen stream.
To form covalent bond on the surface of electrode, DSP-SPE was reacted with Myo and PSA (ratio: 1:1) and incubated for 24 h. Then
DSP-SPE surface blocking was carried out by soaking it in 10% w v−1
solution of AAM monomer for 24 h. In the next step, ammonium per-sulphate (APS) was used to polymerize AAM and NNMBA to form MIP on the SPE (DSP(PSA, Myo)-SPE) [31]. The imprinting process was performed using 10 mmol L−1AAM solution (25 μL) and 70 mmol L−1
NNMBA (25 μL) in the presence of DSP-SPE. Then 10 μL PBS (pH 7.4) solution containing 60 mmol L−1of APS was added. The hydroquinone
in ethanol (1% w/v) was used as stop solution. The Myo and PSA (template Molecules) were washed from MIP(PSA, Myo)-SPE by in-cubation with OxA (1 mol L−1) solution for 12 h. OxA was able to break
peptide bonds, allowing a successful removal of the template molecules from the imprinted layer [42]. The EIS was used to monitor whole process.
2.4. EIS analysis
All electrochemical experiments and EIS investigations were carried out using a CompactStat h 1030 Electrochemical Analyzer (Ivium Technologies). The Single-use screen-printed gold electrodes were purchase
from Metrohm Co. (Schiedam, Netherland, code: 6.1208.210) comprising a working electrode (gold, diameter of 4 mm) and carbon-based counter electrode and silver pseudo-reference electrode. The connection of SPE to the Ivium is provided by a specific homemade connector. The investiga-tions were carried at ambient temperature by drop-casting a solution (50 μL) onto the working electrode surface. All EIS experiments, which were performed within a frequency range of 0.1 Hz–100 kHz at the formal potential of redox couple Fe(CN)64−/3−(0.17 V), were recorded in the
solution containing 5 mmol L−1K
3[Fe(CN)6]/K4[Fe(CN)6] (1:1) and PBS
(0.1 mol L−1, pH 7). The impedance data were represented in the form of a
complex plot (Nyquist plot), and the fitting program of CompactStat h 1030 Electrochemical Analyzer was used to analyze the impedance spectra with an appropriate equivalent electrical circuit.
2.5. Dynamic light scattering (DLS) analysis
To determine the dynamic diameterof prepared nanoparticles, DLS investigations were performed using Nanotrac Wave™ (Microtrac). Data analysis was perform by fitting the data to a polydispersed model using Scheme 1. Illuatration of the assembly and performance of the developed sensor and immunosensor.
the Dynamics software version 5.26.
2.6. Scanning electron microscopy (SEM) analysis
SEM analysis was carried out to detect morphology of NCP, SPE, MIP-SPE and NCP-MIP-SPE. Scanning electron microscope model MIRA3 FEG-SEM Tescan was used and samples were gold plated before to analysis to avoid charge accumulation.
2.7. Surface plasmon resonance (SPR) analysis
SPR analysis were carried out using a Biacore T100 system. To rinse the gold surface, the chip was first soaked in piranha solution (10 mL, 70% H2SO4: 30% H2O2) for 5 min followed by washing with amounts of
ethanol and deionized water. Clean chip instead of working electrode connected to electrochemical analyzer and the polymerization process was performed the same as see section2-3. The SPR investigations were started by injecting the running buffer (10 mmol L−1 Tris-HCl,
1 mmol L−1EDTA, and 1 mol L−1NaCl; pH 7.4) into the system (rate:
30 μL min−1) until the baseline became stable. One channel was
un-modified MIP-Au chip to provide an additional reference surface; the other channel on the MIP-Au chip was incubate with PSA (MIP(PSA)-Au chip) or Myo (MIP(Myo)-Au chip) (30 μL of 5 or 100 ng mL−1
respec-tively) in 1 mol L−1PBS (pH 7) at a rate of 30 μL min-1. Subsequently,
5 mmol L−1Tris-HCl buffer containing10 mmol L−1NaCl (pH 7.4) was
introduced to wash out the free, unbound PSA or Myo. Then one
channel was unmodified MIP(PSA)-Au chip to provide an additional reference surface; the other channel on the MIP(PSA)-Au chip was modified with NCP solution (NCP-MIP(PSA)-Au chip) at a rate of 30 μL min−1. Subsequently, 5 mmol L−1 Tris-HCl buffer
con-taining10 mmol L−1NaCl (pH 7.4) was introduced to wash out the free,
unbound NCP. Finally, the SPR data were evaluated using Biacore T100 evaluation software (v. 1.1.1) to calculate the values of the kinetic parameters Kaand Kd.
2.8. The amount of Ab immobilized on NCP
The amount of Ab immobilized on MWCNT-GO-Fe3O4(6.2 ng g−1of
NCP) was measured indirectly using Pierce BCA protein assay kit.
2.9. Assessment of biosensor performance
To evaluate performance of the developed biosensor MIP-SPE was immersed into solutions of PSA and Myo for 60 min at ambient tem-perature and then rinsed with buffer solution to form MIP(PSA, Myo)-SPE (Scheme 1). The Rct of MIP-SPE and MIP(PSA, Myo)-SPE were
measured using EIS and the difference in the Rct values between
(ΔRct(1)) MIP-SPE and MIP(PSA, Myo)-SPE were indirectly indicative of
sum of PSA and Myo concentrations.
Next, MIP(PSA, Myo)-SPE were incubated with NCP for 90 min at 37 °C, and after being washed with buffer solution. EIS was carried out to measure Rctvalues. Difference in the Rctvalues of MIP(PSA,
Fig. 1. (A to G) EIS and SEM analysis for step by step fabrication of impedimetric sensor (NCP, bare SPE, DSP-SPE, DSP(PSA, SPE, MIP-SPE, MIP(PSA, Myo)-SPE, NCP-MIP(PSA, Myo)-SPE respectively). Equivalent circuits obtained by fitting Nyquist plots of (H) the NCP-MIP(PSA, Myo)-SPE and (I) other modified elec-trodes.
SPE and NCP-MIP(PSA, Myo)-SPE (ΔRct(2)) were indirectly indicative
of PSA concentrations.Scheme 1demonstrates the assembly and per-formance of the proposed biosensor.
3. Results and discussion
3.1. Characterization 3.1.1. EIS analysis
EIS is a very robust method that is broadly applied to investigate the binding of molecules upon a sensor surface.Fig. 1depicts the Nyquist plots of bare SPE (curve B), DSP-SPE (curve C), DSP (PSA, Myo)-SPE (curve D), MIP-SPE (curve E), MIP(PSA, Myo)-SPE (curve F), NCP-MIP (PSA, Myo)-SPE (curve G). In the Nyquist plot, semicircles diameter illustrates a faradaic resistance displaying electron transfer resistance (Rct). Furthermore, at low frequencies, Warburg impedance can be
seen. When DSP was self-assembled on the SPE, Rct value increased
significantly (curve B), revealing the high insulating capability of DSP. Also, the Rctvalue raised slightly after the attachment of PSA and Myo
with DSP-SPE in the presence of PSA and Myo, slightly raised (curve C) representing the increased resistance of the double layer. As can be seen in curve e, when MIP was formed on the surface of the electrode, leads to an increase in Rctvalue. After template removal from the imprinted
polymer using OxA, the Rct value of MIP-SPE was notably declined
(curve D). It seems that the removal of analytes from the MIP cavity,
allows electrons to be easily transferred through the formed cavities at the surface of the sensor, leading in an improvement of the charge transfer rate. When the MIP-SPE was incubated with templates (PSA and Myo), the Rctvalue remarkably increased, which proved that
spe-cific interaction between analytes and MIP cavities take place. Subsequently, the interaction of MIP(PSA, Myo)-SPE with NCP (curve F) decreased the Rctvalues because of the high conductivity of
GO and MWCNT that they can facilitate the electron transfer through the sensing layer. Interestingly, two semicircles appeared for NCP-MIP (PSA, Myo)-SPE, which is probably the result of the poor binding at the interface between NCP and MIP(PSA, Myo)-SPE. However, only one semicircle appeared in the Nyquist plot of MIP(PSA, Myo)-SPE. The semicircle is closely associate with the electron-transfer process and the electrical conductivity of the sensor material. The two semicircles were observed because of the partial coating of GO surface by oxygen-con-taining functional groups and show that the two different steps of the reaction take place in the electron transfer process [43,44].Fig. 1(H and I) indicates the equivalent circuits used to fit the EIS spectra. In the equivalent circuit, Rsis the resistance of the solution. The Rctand C
represent the resistance of the charge transfer and the double layer Fig. 2. DLS characterization of (A) Fe3O4, (B) APTS-Fe3O4and (C) NCP.
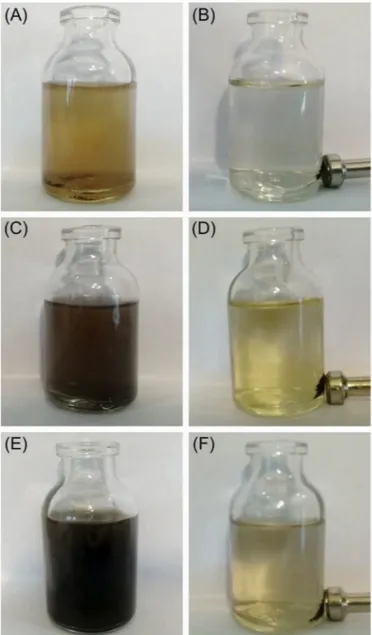
Fig. 3. The prepared Fe3O4(A and B), APTS-Fe3O4(C and D) and NCP (E and
F), before (A, C and E) and after (B, D and F) magnet separation.
capacitance at the electrodes respectively, and W is the Warburg im-pedance. The calculated values of Rs, Rct, C and W were listed inTable
S1.
3.1.2. SEM analysis
To characterize surface features of NCP, SPE, MIP-SPE, and NCP-MIP-SPE, SEM analysis was performed. SEM image of the synthesized NCP is represented inFig. 1, Panel A. The results indicates the presence of MWCNT, GO, and Fe3O4nanoparticles. Fe3O4can be distributed on
the MWCNT and GO surface and/or placed inside MWCNT and GO structure. Panel B shows a SEM image of bare SPE with smooth sur-faces. Panel E illustrates a SEM image of MIP-SPE with a dense, scaly, and porous surface appeared, which was distributed homogeneously on
the surface of SPE. As can be seen in Panel G, NCPs are successfully attached to the MIP-SPE. This binding can be the result of an immune reaction between antibody conjugated NCP and PSA.
3.1.3. DLS analysis
As can be seen inFig. 2, evaluation of size distribution demonstrated the mean diameters of Fe3O4 (Panel A) and Fe3O4modified with
3-(Trimethoxysilyl)-propylamine (APTS) (Panel B) were 27 and 30 nm, respectively. These results display that the Fe3O4and APTS-Fe3O4have
a similar size distribution. Modification of the APTS-Fe3O4 using
MWCNT, GO and Ab (Panel C), leads to the slightly increase in the mean diameters and appearance of two size distribution with the mean center of 75 nm and 6.8 μm related to length and diameters of NCP. Table 1
The SPR fitting data results.
Binding site Ligand Ka(M−1s−1) Kd(s−1) KD(M) KA(M−1)
MIP-SPE PSA 1.01 × 10⁴ 3.59 × 10⁻⁵ 3.55 × 10⁻⁹ 2.82 × 10⁸
MIP-SPE Myo 2.54 × 10⁴ 2.35 × 10⁻⁵ 9.25 × 10⁻¹⁰ 1.08 × 10⁹
MIP(PSA)-SPE NCP 3.23 × 10⁴ 3.87 × 10⁻⁶ 1.20 × 10⁻¹⁰ 8.33 × 10⁹
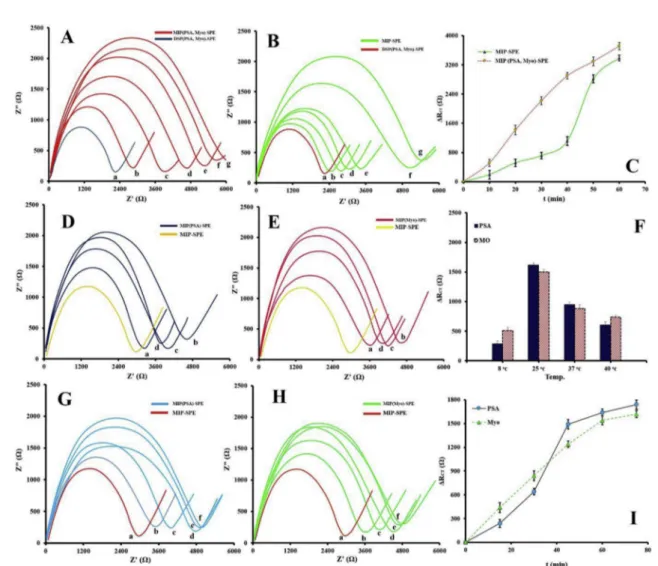
Fig. 4. EIS analysis results performed on DSP(PSA, Myo)-SPE during polymerization of MIP before (A) and after (B) incubation with OxA for different time points (0, 10, 20, 30, 40, 50 and 60 min (a–g)). (C) The corresponding ΔRctresults. EIS results from the study on temperature optimization for the interaction of (D) PSA and (E)
Myo with MIP-SPE at incubation temperatures 8, 25, 37 and 40 °C (a–d) in present of 4.5 ng mL−1PSA and 250 ng mL−1Myo. (F) R
ctvalues from the study on
temperature optimization for the interaction of templates (PSA and MYO) with MIP-SPE. EIS results from the study on time optimization for the interaction of (G) PSA and (H) Myo with MIP-SPE at incubation time 0, 15, 30, 45, 60 and 75 min (a–e) in present of 4.5 ng mL−1PSA and 250 ng mL−1Myo. (I) R
ctvalues from the study on
To further investigate the quality of synthesized Nanomaterials, they were dispersed in the water, and the effect of external magnetic field on the solutions was investigated.Fig. 3(Panel A), represents the solution obtained after the dispersion of Fe3O4nanoparticles in water.
Panel B indicates that the separation of nanoparticles can be achieved by an external magnetic field. When APTS modified the Fe3O4, Panel C,
showed better dispersibility and can be recovered using the external magnetic field (Panel D). Furthermore, NCP was dispersed in water, resulting in a black dispersionFig. 3(Panel E). Then a magnet was placed near the vessel to collect the nanoparticles within about 3 min, the nanoparticles were completely collect to the cuvette wall, and the dispersion turns to the clear and transparent solution. The results showed that Fe3O4nanoparticles decorated with MWCNT-GO and the
obtained composite mantained the stability and magnetic properties a long time.
3.1.4. SPR analysis
To evaluate the binding affinity of MIP toward an analytical sample (PSA and Myo) and affinity between PSA and NCP, the kinetic function of an SPR spectrometer used to calculate the binding parameters. The resulting data (Table 1) was fitted to a simple bimolecular model, and the ka(association) and kd(dissociation) were obtained. The
dissocia-tion constant (KD) and the association constant (KA) were determined
based on the ratio kd/kaand ka/kdrespectively. The results showed that
affinity MIP to Myo is higher than PSA and affinity between PSA and NCP is higher than that of PSA and MIP.
3.2. Optimization of the experimental parameters 3.2.1. Self-assembly of DSP on SPE
Self-assembly of organic functional groups is a very versatile route for the construction of films with high stability and organization on the solid electrodes [43,45]. The sulfhydryl group in the DSP structure offers a helpful tool for the binding of proteins to the surface of the gold electrodes. Furthermore, there is an ester group in the DSP structure which can bind to thiol or amine containing agents. To form the first layer on the electrode, the DSP was self-assembled on the SPE, and the peak density of DSP was tested using EIS to monitor the process com-pletion.Fig. S1represents the results of EIS analysis obtained during the self-assembly of DSP on the SPE at different incubation times.
The results showed that the Rctvalue increased with incubation time
up to 60 h, and then remained constant revealed that surface of SPE completely covered by self-assembled DSP. More investigations with the fitting of electrochemical impedance spectra proved that the elec-trode surface was anchored uniformly with DSP.
3.2.2. The optimum time for assembling of PSA and Myo on DSP-SPE
To fabricate the second layer of the sensing platform, PSA and Myo were allowed to covalently attach on the DSP-SPE, and EIS investigated the completion of the process. The influence of incubation time on the EIS signal was also studied. As can be seen fromFig. S2, as the in-cubation time increased up to 24 h, the Rctincreased. For longer
in-cubation time, Rct reached to the constant value. More investigation
Fig. 5. (A) EIS results for different concentrations of PSA (0.01–100 ng mL−1) using MIP(PSA)-SPE and NCP-MIP(PSA)-SPE (B) Calibration curve of the PSA analysis
using MIP(PSA)-SPE and NCP-MIP(PSA)-SPE (C) EIS results for different concentrations of Myo (1–20000 ng mL−1) using MIP(Myo)-SPE (D) Calibration curve of the
Myo analysis.
with the fitting of electrochemical impedance spectra showed that the DSP-SPE surface was covered uniformly with PSA and Myo.
3.2.3. Engineering the thickness of polymerized MIP
The influence of the imprinted polymer thickness on the response of the sensor was studied.Fig. 4(Panel A–C) illustrates EIS analysis results obtained during polymerization of MIP on the DSP(PSA, Myo)-SPE before and after incubation with OxA. The polymerization was stopped at different time intervals by adding stop solution that leads to the formation of MIP with different width. As can be seen, the continuous growth of the thickness of MIP causes an increase in the Rctvalue, and
the best result obtained when the polymerization process was allowed to proceed for 40 min. Therefore, the optimum time of polymerization was chosen as 40 min it seems that the effective interaction between analytes and the solution take place in this thickness and more rise in polymerization time can mask the templates surface and notably in-crease Rct.
3.2.4. Temperature and time optimization for the interaction of templates with MIP-SPE
EIS methods were applied to investigate the complexation between templates (PSA and Myo) and MIP-SPE at five different temperatures. As shown inFig. 4(D-F) an increase in temperature cause rise in Rct,
reaching its highest value at 25 °C, revealing that maximum binding of templates to the MIP cavities take place at this temperature. However, at the higher temperature, a remarkable decline in Rctwas observed,
suggesting that, the elevated temperature may affect the interaction of MIP and templates. Therefore, the optimized temperature was chosen as 25 °C.
Furthermore, the effect of incubation time of MIP-SPE with analytes on the EIS responses was evaluated. It is found that (Fig. 4(G-I)), the optimal incubation time is 60 min and it was chosen for the subsequent experiment.
3.2.5. Temperature and time optimization for the interaction of NCP with MIP(PSA)-SPE
To examine the effect of incubation temperature on the EIS response of the MIP(PSA)-SPE, the imprinted sensor was incubated with NCP at five different temperatures. As shown in Fig. S3, the ΔRct value
in-creased with the increasing temperatures and reached a maximum at 37 °C. However, when raising the temperature from 37 °C to 45 °C, the ΔRctsignificantly declined. This is presumably due to decreasing
Anti-body stability with increasing temperature. So the incubation tem-perature of 37 °C was chosen as the optimal temtem-peratures in the ex-periment.
The influence of incubation time with NCP from 0 to 150 min was studied (Fig. S4). The results showed that the MIP(PSA)-SPE response surged as the incubation time increased from 0 to 90 and no significant change was observed from 90 to 150 min, proving that nearly all binding sites on MIP(PSA)-SPE were covered. Therefore, an incubation time of 90 min was used in the following experiment.
3.3. Analytical application 3.3.1. Calibration curve and LOD
Fig. 5(A, B) illustrates the EIS and ΔRct results of different
con-centrations of PSA using MIP(PSA)-SPE and NCP-MIP(PSA)-SPE. The obtained signals were found to be linear in the ranges of 0.01–100 ng mL−1with LOD of 5.4 pg mL−1for PSA with the linear
regression equations of ΔRct(1) = 355.42[PSA]+0.608 (R2= 0.9902
(n = 3)) and ΔRct(2) = 151.7[PSA]+0.479 (R2= 0.9915 (n = 3))
using MIP(PSA)-SPE and NCP-MIP(PSA)-SPE respectively.
Fig. 5(C and D) represents the EIS and ΔRct results of different
concentrations of Myo using MIP(Myo)-SPE. The linear range of the calibration curve is obtained from 1 to 20000 ng mL−1with a LOD of
830 pg mL−1 for Myo with the linear regression equations of
ΔRct(3) = 6.0168[Myo]+0.464 (R2= 0.9929 (n = 3)) using MIP
(Myo)-SPE. Table 2
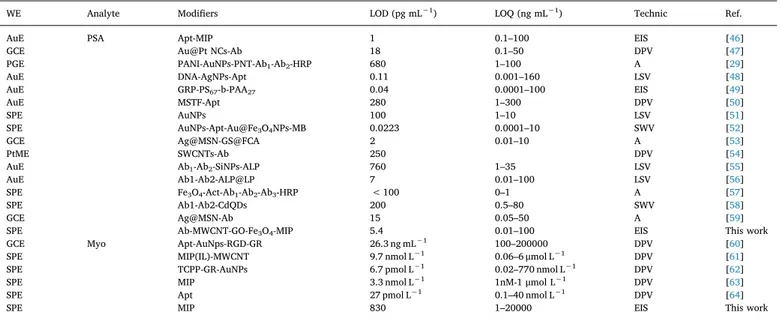
Comparison of the proposed method with previously published electrochemical methods used for detection of PSA and Myo.
WE Analyte Modifiers LOD (pg mL−1) LOQ (ng mL−1) Technic Ref.
AuE PSA Apt-MIP 1 0.1–100 EIS [46]
GCE Au@Pt NCs-Ab 18 0.1–50 DPV [47]
PGE PANI-AuNPs-PNT-Ab1-Ab2-HRP 680 1–100 A [29]
AuE DNA-AgNPs-Apt 0.11 0.001–160 LSV [48]
AuE GRP-PS67-b-PAA27 0.04 0.0001–100 EIS [49]
AuE MSTF-Apt 280 1–300 DPV [50]
SPE AuNPs 100 1–10 LSV [51]
SPE AuNPs-Apt-Au@Fe3O4NPs-MB 0.0223 0.0001–10 SWV [52]
GCE Ag@MSN-GS@FCA 2 0.01–10 A [53]
PtME SWCNTs-Ab 250 DPV [54]
AuE Ab1-Ab2-SiNPs-ALP 760 1–35 LSV [55]
AuE Ab1-Ab2-ALP@LP 7 0.01–100 LSV [56]
SPE Fe3O4-Act-Ab1-Ab2-Ab3-HRP < 100 0–1 A [57]
SPE Ab1-Ab2-CdQDs 200 0.5–80 SWV [58]
GCE Ag@MSN-Ab 15 0.05–50 A [59]
SPE Ab-MWCNT-GO-Fe3O4-MIP 5.4 0.01–100 EIS This work
GCE Myo Apt-AuNps-RGD-GR 26.3 ng mL−1 100–200000 DPV [60]
SPE MIP(IL)-MWCNT 9.7 nmol L−1 0.06–6 μmol L−1 DPV [61]
SPE TCPP-GR-AuNPs 6.7 pmol L−1 0.02–770 nmol L−1 DPV [62]
SPE MIP 3.3 nmol L−1 1nM-1 μmol L−1 DPV [63]
SPE Apt 27 pmol L−1 0.1–40 nmol L−1 DPV [64]
SPE MIP 830 1–20000 EIS This work
A: amperometry Ab: antibody, ACT: alpha 1-antichymotrypsin, AgNPs: silver nanoparticles, Ag@MSN: silver hybridized mesoporous silica nanoparticles, ALP: alkaline phosphatase, Apt: aptamer, AuE: gold electrode, AuNPs: gold nanoparticles, Au@Pt NCs: bimetallic core-shell Au@Pt nanocrystals, CdQDs: cadmium quantum dots, DPV: differential pulse voltammetry, EIS: electrochemical impedance spectroscopy, GCE: glassy carbon electrode, GO: graphene oxid, GR: grapheme, GRP: graphene nanoplatelets, GS@FCA: graphene sheet-ferrocenecarboxaldehyde composite, HRP: horseradish peroxidase, IL: ionic liquid, LP: liposome, LSV: linear sweep voltammetry, MB: methylene blue, MIP: molecularly imprinted polymer, MSTF: mesoporous silica thin film, MWCNT: multi-walled carbon nanotubes PANI: polyaniline, PGE: pencil graphite electrode, PNT: peptide nanotube composite, SPE: screen printed electrode, PS67-b-PAA27: diblock co-polymer, PtME: Pt microelectrode, RGD: arginine-glycine-aspartic, SiNPs: silica nanoparticles, SWNTs: single-walled carbon nanotubes, SWV: Square-Wave Voltammetry, TCPP: meso-tetra (4-carboxyphenyl) porphyrin.
In comparison to reported PSA and Myo sensors/biosensors, are shown inTable 2, developed immunosensor exhibits some superiorities regarding sensitivity, selectivity, reproducibility, and LOD over other PSA and Myo biosensors.
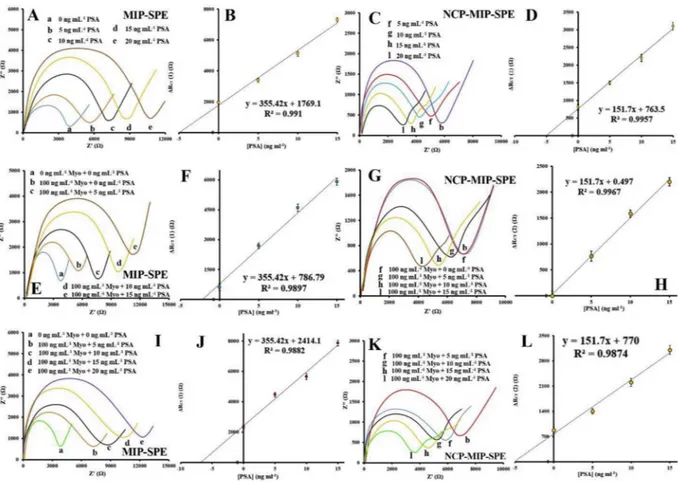
Also, determination of PSA and Myo concentration in the presence of each other were investigated. To this end, first, we determined the
original content of PSA in the sample by the standard addition method using MIP(PSA, Myo)-SPE and NCP-MIP(PSA, Myo)-SPE. The con-centration of PSA ([PSA]) was determined using a value of ΔRct(2) by
NCP-MIP(PSA)-SPE with the linear regression equations of ΔRct(2) = 151.7[PSA]+0.479. Then ΔRct(3) for Myo was calculated
using MIP(PSA, Myo)-SPE and ΔRct(1) by linear regression equations of
Fig. 6. Standard addition of PSA to the solution containing PSA. EIS results for standard addition of different concentrations of PSA (0 (a), 5 (b, f), 10 (c, g), 15 (d, h) and 20 ng mL−1(e, I) using (A) MIP-SPE (C) NCP-MIP-SPE. Correspond calibration curve of (B) MIP-SPE (D) NCP-MIP-SPE. Standard addition of PSA for a solution
containing Myo. EIS results for standard addition of different concentrations of PSA (0 (a, b, F), 5 (c, g), 10 (d, h) and 15 ng mL−1(e, I) in the absent (a) and present
(b-I) of 100 ng mL−1Myo using (E) MIP-SPE (G) NCP-MIP-SPE. Correspond calibration curve of (F) MIP-SPE (H) NCP-MIP-SPE. Standard addition of PSA for a
solution containing PSA and Myo. EIS results for standard addition of different concentrations of PSA (0 (a), 5 (b, f), 10 (c, g), 15 (d, h) and 20 ng mL−1(e, I) in the
absent (a) and present (b-I) of 100 ng mL−1Myo using (I) MIP-SPE (K) NCP-MIP-SPE. Correspond calibration curve of (J) MIP-SPE (L) NCP-MIP-SPE.
Fig. 7. Interference study for the sensor and immunosensor. The ΔRctof the MIP-SPE (a) and the NCP-MIP-SPE (b) for 10 ng mL−1PSA and 450 ng mL−1Myo in the
presence of 6000 ng mL−1, EGFR, VEGF, COR, NSE, PSA, HTR, HAS, BSA, AgTR and AgCE.
ΔRct(3) = ΔRct(1)-(355.42[PSA]+0.608). Finally, the concentration of
Myo ([Myo]) was determined using the value of ΔRct(3) and linear
regression equations of ΔRct(3) = 6.0168[Myo]+0.464. The
cross-ef-fect of PSA and Myo on the calibration curves was investigated, and the results showed that there are no significant differences between slopes of the calibration curves (Fig. 6andTable S2).
3.3.2. Interference study
To evaluate the selectivity of the MIP, different biomarkers such as bovine serum albumin (BSA), cortisol (COR), epidermal growth factor receptor (EGFR), carcinoembryonic antigen (AgCE), thrombin antigen (AgTA), human thrombin (HTR), vascular endothelial growth factor (VEGF), human albumin serum (HAS) and neuron-specific enolase (NSE) were used and comparison of performance of the proposed im-pedimetric immunosensor for determination of analytes and above-mentioned biomarkers was performed.Fig. 7depicts the results of EIS investigation of the developed MIP-SPE in the presence of potential interferences. The calculated ΔRctvalues of the MIP-SPE and
NCP-MIP-SPE in the solution of biomarkers were lower than those of PSA and Myo (p < 0.06). The calculated ΔRct values of NCP-MIP-SPE in the
solution of biomarkers were lower than those of PSA (p < 0.04). The obtained results confirmed that the fabricated MIP has highly specific binding capacity to target analytes and fabricated NCP has highly specific binding capacity to PSA.
3.3.3. Real sample analysis
To assess the analytical efficiency of developed immunosensor, de-termination of PSA and Myo concentration in serum and urine samples was performed. As can be seen in Table 3, the results obtained from developed impedimetric immunosensor and ELISA are in good agree-ment without significant difference (p < 0.05). Furthermore, it should be noted that selectivity and sensitivity of the proposed method were not notably affected be other proteins present in the serum or urine samples.
3.3.4. Accuracy, reproducibility, stability, and regeneration of the sensor and immunosensor
In the repeated PSA or Myo analysis using the engineered sensor, the MIP-SPE and NCP-MIP-SPE can remain completely stable in the next PSA or Myo determination. Relative standard deviation (RSD) of this regeneration was found to be about 4.2 and 3.9 (n = 5) for PSA and Myo analysis respectively using MIP-SPE and 5.1 (n = 5) for PSA using NCP-MIP-SPE. Moreover, reproducibility of sensor and immunosensor construction process were studied through the examination of MIP or NCP modified electrodes prepared independently. Inter-assay precision was found to be less than 4.9 and 5% for MIP-SPE and NCP-MIP-SPE respectively. The stability of the sensor and immunosensor were in-vestigated during 45 days by coefficient variation percentage (CV %). In
addition, the engineered MIP-SPE was highly stable during 30 days after preparation with CV% less than 4.8%. After 45 days, CV% of measurements was less than 6%. The engineered NCP was found to be extremely stable during 30 days post-fabrication with CV% less than 5.2%. After 45 days, CV% of measurements was less than 6.8%. All the obtained results on reproducibility, stability, and regeneration con-firmed that the sensor and immunosensor engineering method as a sound sensing approach for detection of Myo and PSA in biological samples.
4. Conclusion
In this work, we described a novel impedimetric sensor and im-munosensor for the dual detection of PSA and Myo using MIP-SPE and NCP-MIP-SPE. The polymer modified electrode (MIP-SPE) is highly sensitive for PSA and Myo. Engineered NCP provides high conductivity as the sensing interface, which could be sensitive for PSA. The sensor and immunosensor exhibited reasonable sensitivity, selectivity, and stability. An LDR 0.01–100 pg mL−1and from 1 to 20000 pg mL-1 were
achieved for PSA and Myo respectively. The LOD was as low as 5.4 pg mL−1and 0.83 ng mL−1for PSA and Myo respectively. The
im-munosensor could be used for the detection of PSA and Myo in real samples.
Acknowledgement
The authors would like to thank National Institute for Medical Research Development (NIMAD) for the financial support this work (Grant No. 957699).
Appendix A. Supplementary data
Supplementary data related to this article can be found athttps:// doi.org/10.1016/j.talanta.2019.04.061.
References
[1] M.J. Barry, Prostate-specific–antigen testing for early diagnosis of prostate cancer, N. Engl. J. Med. 344 (2002) 1373–1377,https://doi.org/10.1056/
nejm200105033441806.
[2] I.M. Thompson, D.K. Pauler, P.J. Goodman, C.M. Tangen, M.S. Lucia, H.L. Parnes, L.M. Minasian, L.G. Ford, S.M. Lippman, E.D. Crawford, J.J. Crowley, C.A. Coltman, Prevalence of prostate cancer among men with a prostate-specific antigen level ≤4.0 ng per milliliter, N. Engl. J. Med. 350 (2004) 2239–2246,https://doi.org/10. 1056/NEJMoa031918.
[3] M.J. Stone, M.R. Waterman, D. Harimoto, G. Murray, N. Willson, M.R. Platt, G. Blomqvist, J.T. Willerson, Serum myoglobin level as diagnostic test in patients with acute myocardial infarction, Br. Heart J. 39 (1977) 375,https://doi.org/10. 1136/hrt.39.4.375LP – 380.
[4] T.G. Rosano, M.A. Kenny, A radioimmunoassay for human serum myoglobin: method development and normal values, Clin. Chem. 23 (1977) 69 LP – 75http://
Table 3
Real samples analysis and comparison of the developed biosensor with a standard ELISA assay. Patient type Sample type ELISA [PSA] (ng
mL−1) ELISA [Myo] (ngmL−1) Added [PSA](ng mL−1) (ng mLAdded [Myo]−1) Found [PSA] (ngmL−1) Found [Myo] (ngmL−1) PSA R(%) Myo R(%)
CS Serum 2.3 ± 0.6 65.6 ± 1.2 0 0 2.27 ± 0.32 67.52 ± 1.45 98.70 102.93 Serum 2.3 ± 0.6 65.6 ± 1.2 10 100 12.27 ± 0.16 165.7 ± 0.98 99.76 100.06 Serum 2.3 ± 0.6 65.6 ± 1.2 5 50 7.39 ± 0.25 116.92 ± 1.01 101.23 101.14 Urine ND ND 0 0 0 0 ND ND PC Serum 10.4 ± 0.2 86.4 + 2.3 0 0 10.21 ± 0.23 87.10 ± 1.54 98.17 100.81 Urine 52.8 ± 0.5 ND 0 0 52.13 ± 0.64 0 98.73 ND BPH Serum 5.1 ± 0.3 34.7 ± 0.9 0 0 5.23 ± 0.78 35.26 ± 0.67 102.55 101.61 Serum 5.1 ± 0.3 34.7 ± 0.9 5 50 10.24 ± 0.92 83.89 ± 1.14 101.39 99.04 Serum 5.1 ± 0.3 34.7 ± 0.9 10 100 15.41 ± 0.94 133.21 ± 1.20 102.05 98.89 urine 94.6 ± 0.8 ND 0 0 95.21 ± 0.35 0 100.64 ND BLMS Serum 3.8 ± 0.1 75.1 ± 0.9 0 0 3.91 ± 0.41 74.85 ± 0.36 102.89 99.68 urine 123.4 ± 0.7 435.9 ± 0.6 0 0 124.11 + 1.2 437.15 ± 2.25 100.58 102.87
clinchem.aaccjnls.org/content/23/1/69.abstract.
[5] A.H. Wu, Y.J. Feng, J.H. Contois, S. Pervaiz, Comparison of myoglobin, creatine kinase-MB, and cardiac troponin I for diagnosis of acute myocardial infarction, Ann. Clin. Lab. Sci. 26 (1996) 291–300http://www.annclinlabsci.org/content/26/4/ 291.abstract.
[6] S. Meller, A. Bicker, M. Montani, K. Ikenberg, B. Rostamzadeh, V. Sailer, P. Wild, D. Dietrich, B. Uhl, T. Sulser, H. Moch, T.A. Gorr, C. Stephan, K. Jung, T. Hankeln, G. Kristiansen, Myoglobin expression in prostate cancer is correlated to androgen receptor expression and markers of tumor hypoxia, Virchows Arch. 465 (2014) 419–427,https://doi.org/10.1007/s00428-014-1646-y.
[7] A. Bicker, A.M. Brahmer, S. Meller, G. Kristiansen, T.A. Gorr, T. Hankeln, The distinct gene regulatory network of myoglobin in prostate and breast cancer, PLoS One 10 (2015) e0142662, ,https://doi.org/10.1371/journal.pone.0142662. [8] A. Lindsay, S. Carr, N. Draper, S.P. Gieseg, Urinary myoglobin quantification by
high-performance liquid chromatography: an alternative measurement for exercise-induced muscle damage, Anal. Biochem. 491 (2015) 37–42,https://doi.org/10. 1016/j.ab.2015.09.001.
[9] H.C.B. Graves, M. Kamarei, T.A. Stamey, Identity of prostate specific antigen and the semen protein p30 purified by a rapid chromatography technique, J. Urol. 144 (1990) 1510–1515,https://doi.org/10.1016/S0022-5347(17)39788-4.
[10] B.M. Mayr, O. Kohlbacher, K. Reinert, M. Sturm, C. Gröpl, E. Lange, C. Klein, C.G. Huber, Absolute myoglobin quantitation in serum by combining two-dimen-sional liquid chromatography-electrospray ionization mass spectrometry and novel data analysis algorithms, J. Proteome Res. 5 (2006) 414–421,https://doi.org/10. 1021/pr050344u.
[11] J.J. Hlavaty, A.W. Partin, F. Kusinitz, M.J. Shue, A. Stieg, K. Bennett, J. V Briggman, Mass spectroscopy as a discovery tool for identifying serum markers for prostate cancer, Clin. Chem. 47 (2001) 1924 LP – 1926http://clinchem.aaccjnls.org/ content/47/10/1924.abstract.
[12] A. Clerico, M.G. Del Chicca, G.C. Zucchelli, L. Salutini, A. Mercuri, M. Scarlattini, Performance of a fully automated fluorometric enzyme immunoassay for serum myoglobin measurement, J. Nucl. Biol. Med. 37 (1993) 83–87http://europepmc. org/abstract/MED/8373838.
[13] Y. Wang, A. Brunsen, U. Jonas, J. Dostálek, W. Knoll, Prostate specific antigen biosensor based on long range surface plasmon-enhanced fluorescence spectroscopy and dextran hydrogel binding matrix, Anal. Chem. 81 (2009) 9625–9632,https:// doi.org/10.1021/ac901662e.
[14] E.E. Kline, E.G. Treat, T.A. Averna, M.S. Davis, A.Y. Smith, L.O. Sillerud, Citrate concentrations in human seminal fluid and expressed prostatic fluid determined via 1H nuclear magnetic resonance spectroscopy outperform prostate specific antigen in prostate cancer detection, J. Urol. 176 (2006) 2274–2279,https://doi.org/10. 1016/j.juro.2006.07.054.
[15] J.H. Bradbury, S.L.M. Deacon, M.D. Ridgway, Histidine residues of myoglobin studied by 1H nuclear magnetic resonance spectroscopy, J. Chem. Soc., Chem. Commun. (1979) 997–998,https://doi.org/10.1039/C39790000997. [16] G. Koukouvinos, A. Metheniti, C.E. Karachaliou, D. Goustouridis, E. Livaniou,
K. Misiakos, I. Raptis, A. Kondili, P. Miniati, P. Petrou, S. Kakabakos, White light reflectance spectroscopy biosensing system for fast quantitative prostate specific antigen determination in forensic samples, Talanta 175 (2017) 443–450,https:// doi.org/10.1016/j.talanta.2017.07.074.
[17] M.J. Donohue, M.B. Satterfield, J.J. Dalluge, M.J. Welch, J.E. Girard, D.M. Bunk, Capillary electrophoresis for the investigation of prostate-specific antigen hetero-geneity, Anal. Biochem. 339 (2005) 318–327,https://doi.org/10.1016/j.ab.2005. 01.043.
[18] W. Jin, Q. Dong, D. Yu, X. Ye, Monitoring myoglobin by capillary zone electro-phoresis with end‐column amperometric detection, Electrophor. An Int. J. 21 (2000) 1535–1539.
[19] L. Niu, Z. Song, X. He, A study of the chemiluminescence behavior of cephalos-porins with luminol and its analytical application, Drug Metab. Lett. 3 (2009) 144–151,https://doi.org/10.2174/187231209789352157.
[20] L.I. Stowell, L.E. Sharman, K. Hamel, An enzyme-linked immunosorbent assay (ELISA) for prostate-specific antigen, Forensic Sci. Int. 50 (1991) 125–138,https:// doi.org/10.1016/0379-0738(91)90141-5.
[21] T. Kitao, S. Miyaishi, H. Ishizu, Identification of human skeletal muscle from a tissue fragment by detection of human myoglobin using a double-sandwich ELISA, Forensic Sci. Int. 71 (1995) 205–214,https://doi.org/10.1016/0379-0738(94) 01667-4.
[22] M. Weber, M. Rau, K. Madlener, A. Elsaesser, D. Bankovic, V. Mitrovic, C. Hamm, Diagnostic utility of new immunoassays for the cardiac markers cTnI, myoglobin and CK-MB mass, Clin. Biochem. 38 (2005) 1027–1030,https://doi.org/10.1016/j. clinbiochem.2005.07.011.
[23] F. Zhang, L. Mao, M. Zhu, Ultrasensitive immunoassay for free prostate-specific antigen based on ferrocenecarboxylate enhanced cathodic
electro-chemiluminescence of peroxydisulfate, Microchim. Acta. 181 (2014) 1285–1291, https://doi.org/10.1007/s00604-014-1240-7.
[24] L.E. Roxin, P. Venge, L. Wide, A fast and sensitive radioimmunoassay of human myoglobin for use in the early diagnosis of heart infarction, Clin. Chim. Acta 107 (1980) 129–134,https://doi.org/10.1016/0009-8981(80)90422-2.
[25] G. Sun, H. Liu, Y. Zhang, J. Yu, M. Yan, X. Song, W. He, Gold nanorods-paper electrode based enzyme-free electrochemical immunoassay for prostate specific antigen using porous zinc oxide spheres-silver nanoparticles nanocomposites as labels, New J. Chem. 39 (2015) 6062–6067,https://doi.org/10.1039/c5nj00629e. [26] T. Soukka, J. Paukkunen, H. Härmä, S. Lönnberg, H. Lindroos, T. Lövgren,
Supersensitive time-resolved immunofluorometric assay of free prostate-specific antigen with nanoparticle label technology, Clin. Chem. 47 (2001) 1269–1278. [27] T. Kaya, T. Kaneko, S. Kojima, Y. Nakamura, Y. Ide, K. Ishida, Y. Suda,
K. Yamashita, High-sensitivity immunoassay with surface plasmon field-enhanced fluorescence spectroscopy using a plastic sensor chip: application to quantitative analysis of total specific antigen and GalNAcβ1-4GlcNAc-linked prostate-specific antigen for prost, Anal. Chem. 87 (2015) 1797–1803,https://doi.org/10. 1021/ac503735e.
[28] Y. Seto, T. Iba, K. Abe, Development of ultra-high sensitivity bioluminescent en-zyme immunoassay for prostate-specific antigen (PSA) using firefly luciferase, Luminescence 16 (2001) 285–290,https://doi.org/10.1002/bio.654. [29] T. Vural, Y.T. Yaman, S. Ozturk, S. Abaci, E.B. Denkbas, Electrochemical
im-munoassay for detection of prostate specific antigen based on peptide nanotube-gold nanoparticle-polyaniline immobilized pencil graphite electrode, J. Colloid Interface Sci. 510 (2018) 318–326,https://doi.org/10.1016/j.jcis.2017.09.079. [30] Z. Chaloupková, A. Balzerová, J. Bařinková, Z. Medříková, P. Šácha, P. Beneš,
V. Ranc, J. Konvalinka, R. Zbořil, Label-free determination of prostate specific membrane antigen in human whole blood at nanomolar levels by magnetically assisted surface enhanced Raman spectroscopy, Anal. Chim. Acta 997 (2018) 44–51,https://doi.org/10.1016/j.aca.2017.10.008.
[31] J.H. Lee, K.S. Hwang, J. Park, K.H. Yoon, D.S. Yoon, T.S. Kim, Immunoassay of prostate-specific antigen (PSA) using resonant frequency shift of piezoelectric na-nomechanical microcantilever, Biosens. Bioelectron. 20 (2005) 2157–2162,https:// doi.org/10.1016/j.bios.2004.09.024.
[32] M.R. Majidi, P. Karami, M. Johari-Ahar, Y. Omidi, Direct detection of tryptophan for rapid diagnosis of cancer cell metastasis competence by an ultra-sensitive and highly selective electrochemical biosensor, Anal. Methods. 8 (2016) 7910–7919, https://doi.org/10.1039/c6ay02103d.
[33] H. Bagheri, A. Afkhami, H. Khoshsafar, A. Hajian, A. Shahriyari, A. Hajian, Protein capped Cu nanoclusters-SWCNT nanocomposite as a novel candidate of high per-formance platform for organophosphates enzymeless biosensor, Biosens. Bioelectron. 89 (2016) 829–836,https://doi.org/10.1016/j.bios.2016.10.003. [34] A. Afkhami, P. Hashemi, H. Bagheri, J. Salimian, A. Ahmadi, T. Madrakian,
Impedimetric immunosensor for the label-free and direct detection of botulinum neurotoxin serotype A using Au nanoparticles/graphene-chitosan composite, Biosens. Bioelectron. 93 (2017) 124–131,https://doi.org/10.1016/j.bios.2016.09. 059.
[35] M. Johari-Ahar, M.R. Rashidi, J. Barar, M. Aghaie, D. Mohammadnejad, A. Ramazani, P. Karami, G. Coukos, Y. Omidi, An ultra-sensitive impedimetric immunosensor for detection of the serum oncomarker CA-125 in ovarian cancer patients, Nanoscale 7 (2015),https://doi.org/10.1039/c4nr06687a.
[36] P. Karami, M.R. Majidi, M. Johari-Ahar, J. Barar, Y. Omidi, Development of screen-printed tryptophan-kynurenine immunosensor for in vitro assay of kynurenine-mediated immunosuppression effect of cancer cells on activated T-cells, Biosens, Bioelectron 92 (2017) 287–293,https://doi.org/10.1016/j.bios.2016.11.010. [37] M.R. Majidi, Y. Omidi, P. Karami, M. Johari-Ahar, Reusable potentiometric
screen-printed sensor and label-free aptasensor with pseudo-reference electrode for de-termination of tryptophan in the presence of tyrosine, Talanta 150 (2016) 425–433, https://doi.org/10.1016/j.talanta.2015.12.064.
[38] J.G. Pacheco, M.S.V. Silva, M. Freitas, H.P.A. Nouws, C. Delerue-Matos, Molecularly imprinted electrochemical sensor for the point-of-care detection of a breast cancer biomarker (CA 15-3), Sensor. Actuator. B Chem. 256 (2018) 905–912,https://doi. org/10.1016/j.snb.2017.10.027.
[39] M. Johari-Ahar, P. Karami, M. Ghanei, A. Afkhami, H. Bagheri, Development of a molecularly imprinted polymer tailored on disposable screen-printed electrodes for dual detection of EGFR and VEGF using nano-liposomal amplification strategy, Biosens. Bioelectron. 107 (2018) 26–33,https://doi.org/10.1016/j.bios.2018.02. 005.
[40] P. Palladino, M. Minunni, S. Scarano, Corrigendum to “Cardiac Troponin T capture and detection in real-time via epitope-imprinted polymer and optical biosensing”, Biosens. Bioelectron. 106 (2018) 93–98,https://doi.org/10.1016/j.bios.2018.01. 068S0956566318300812, Biosens. Bioelectron. 130 (2019) 427. doi:10.1016/j. bios.2019.02.011.
[41] R. Jalili, M. Amjadi, Bio-inspired molecularly imprinted polymer–green emitting carbon dot composite for selective and sensitive detection of 3-nitrotyrosine as a biomarker, Sensor. Actuator. B Chem. 255 (2018) 1072–1078,https://doi.org/10. 1016/j.snb.2017.08.145.
[42] F. Bonini, S. Piletsky, A.P.F. Turner, A. Speghini, A. Bossi, Surface imprinted beads for the recognition of human serum albumin, Biosens. Bioelectron. 22 (2007) 2322–2328,https://doi.org/10.1016/j.bios.2006.12.034.
[43] B. Yuan, C. Xu, D. Deng, Y. Xing, L. Liu, H. Pang, D. Zhang, Graphene oxide/nickel oxide modified glassy carbon electrode for supercapacitor and nonenzymatic glu-cose sensor, Electrochim. Acta 88 (2013) 708–712,https://doi.org/10.1016/j. electacta.2012.10.102.
[44] E. Casero, A.M. Parra-Alfambra, M.D. Petit-Domínguez, F. Pariente, E. Lorenzo, C. Alonso, Differentiation between graphene oxide and reduced graphene by elec-trochemical impedance spectroscopy (EIS), Electrochem. Commun. 20 (2012) 63–66,https://doi.org/10.1016/j.elecom.2012.04.002.
[45] M. Frasconi, F. Mazzei, T. Ferri, Protein immobilization at gold-thiol surfaces and potential for biosensing, Anal. Bioanal. Chem. 398 (2010) 1545–1564,https://doi. org/10.1007/s00216-010-3708-6.
[46] P. Jolly, V. Tamboli, R.L. Harniman, P. Estrela, C.J. Allender, J.L. Bowen, Aptamer-MIP hybrid receptor for highly sensitive electrochemical detection of prostate specific antigen, Biosens. Bioelectron. 75 (2016) 188–195,https://doi.org/10. 1016/j.bios.2015.08.043.
[47] R. Wang, A.J. Wang, W.D. Liu, P.X. Yuan, Y. Xue, X. Luo, J.J. Feng, A novel label-free electrochemical immunosensor for ultra-sensitively detecting prostate specific antigen based on the enhanced catalytic currents of oxygen reduction catalyzed by core-shell Au@Pt nanocrystals, Biosens. Bioelectron. 102 (2018) 276–281,https://
doi.org/10.1016/j.bios.2017.11.041.
[48] P. Miao, Y. Jiang, Y. Wang, J. Yin, Y. Tang, An electrochemical approach capable of prostate specific antigen assay in human serum based on exonuclease-aided target recycling amplification, Sensor. Actuator. B Chem. 257 (2018) 1021–1026,https:// doi.org/10.1016/j.snb.2017.11.064.
[49] M.S. Khan, K. Dighe, Z. Wang, I. Srivastava, E. Daza, A.S. Schwartz-Dual, J. Ghannam, S.K. Misra, D. Pan, Detection of prostate specific antigen (PSA) in human saliva using an ultra-sensitive nanocomposite of graphene nanoplatelets with diblock-: Co -polymers and Au electrodes, Analyst 143 (2018) 1094–1103, https://doi.org/10.1039/c7an01932g.
[50] W. Argoubi, A. Sánchez, C. Parrado, N. Raouafi, R. Villalonga, Label-free electro-chemical aptasensing platform based on mesoporous silica thin film for the detec-tion of prostate specific antigen, Sensor. Actuator. B Chem. 255 (2018) 309–315, https://doi.org/10.1016/j.snb.2017.08.045.
[51] V. Escamilla-Gómez, D. Hernández-Santos, M.B. González-García, J.M. Pingarrón-Carrazón, A. Costa-García, Simultaneous detection of free and total prostate specific antigen on a screen-printed electrochemical dual sensor, Biosens. Bioelectron. 24 (2009) 2678–2683,https://doi.org/10.1016/j.bios.2009.01.043.
[52] C.Y. Lee, H.T. Fan, Y.Z. Hsieh, Disposable aptasensor combining functional mag-netic nanoparticles with rolling circle amplification for the detection of prostate-specific antigen, Sensor. Actuator. B Chem. 255 (2018) 341–347,https://doi.org/ 10.1016/j.snb.2017.08.061.
[53] Y. Li, J. Han, R. Chen, X. Ren, Q. Wei, Label electrochemical immunosensor for prostate-specific antigen based on graphene and silver hybridized mesoporous si-lica, Anal. Biochem. 469 (2015) 76–82,https://doi.org/10.1016/j.ab.2014.09.022. [54] J. Okuno, K. Maehashi, K. Kerman, Y. Takamura, K. Matsumoto, E. Tamiya,
Label-free immunosensor for prostate-specific antigen based on single-walled carbon nanotube array-modified microelectrodes, Biosens. Bioelectron. 22 (2007) 2377–2381,https://doi.org/10.1016/j.bios.2006.09.038.
[55] B. Qu, X. Chu, G. Shen, R. Yu, A novel electrochemical immunosensor based on colabeled silica nanoparticles for determination of total prostate specific antigen in human serum, Talanta 76 (2008) 785–790,https://doi.org/10.1016/j.talanta.2008. 04.026.
[56] B. Qu, L. Guo, X. Chu, D.H. Wu, G.L. Shen, R.Q. Yu, An electrochemical
immunosensor based on enzyme-encapsulated liposomes and biocatalytic metal deposition, Anal. Chim. Acta 663 (2010) 147–152,https://doi.org/10.1016/j.aca. 2010.01.050.
[57] P. Sarkar, D. Ghosh, D. Bhattacharyay, S.J. Setford, A.P.F. Turner, Electrochemical immunoassay for free prostate specific antigen (f-PSA) using magnetic beads, Electroanalysis 20 (2008) 1414–1420,https://doi.org/10.1002/elan.200804194. [58] J. Wang, G. Liu, H. Wu, Y. Lin, Quantum-dot-based electrochemical immunoassay
for high-throughput screening of the prostate-specific antigen, Small 4 (2008) 82–86,https://doi.org/10.1002/smll.200700459.
[59] H. Wang, Y. Zhang, H. Yu, D. Wu, H. Ma, H. Li, B. Du, Q. Wei, Label-free electro-chemical immunosensor for prostate-specific antigen based on silver hybridized mesoporous silica nanoparticles, Anal. Biochem. 434 (2013) 123–127,https://doi. org/10.1016/j.ab.2012.11.012.
[60] C. Li, J. Li, X. Yang, L. Gao, L. Jing, X. Ma, A label-free electrochemical aptasensor for sensitive myoglobin detection in meat, Sensor. Actuator. B Chem. 242 (2017) 1239–1245,https://doi.org/10.1016/j.snb.2016.09.087.
[61] Y. Wang, M. Han, X. Ye, K. Wu, T. Wu, C. Li, Voltammetric myoglobin sensor based on a glassy carbon electrode modified with a composite film consisting of carbon nanotubes and a molecularly imprinted polymerized ionic liquid, Microchim. Acta. 184 (2017) 195–202,https://doi.org/10.1007/s00604-016-2005-2.
[62] G. Zhang, Z. Liu, L. Wang, Y. Guo, Electrochemical aptasensor for myoglobin-spe-cific recognition based on porphyrin functionalized graphene-conjugated gold na-nocomposites, Sensors (Switzerland) 16 (2016) 1803,https://doi.org/10.3390/ s16111803.
[63] V.V. Shumyantseva, T.V. Bulko, L.V. Sigolaeva, A.V. Kuzikov, A.I. Archakov, Electrosynthesis and binding properties of molecularly imprinted poly-o-phenyle-nediamine for selective recognition and direct electrochemical detection of myo-globin, Biosens. Bioelectron. 86 (2016) 330–336,https://doi.org/10.1016/j.bios. 2016.05.101.
[64] N.M. Danesh, M. Ramezani, A.S. Emrani, K. Abnous, S.M. Taghdisi, A novel elec-trochemical aptasensor based on arch-shape structure of aptamer-complimentary strand conjugate and exonuclease I for sensitive detection of streptomycin, Biosens. Bioelectron. 75 (2016) 123–128,https://doi.org/10.1016/j.bios.2015.08.017.