Long live the alien: studying the fate of the genomic diversity along the
long-term dynamics of an extremely successful invader, the crested
porcupine.
Authors:
Emiliano Trucchi1,2, Benoit Facon3, Paolo Gratton4, Emiliano Mori5, Nils Christian Stenseth1, Sissel Jentoft1
Affiliations:
1. Centre for Ecological and Evolutionary Synthesis, Department of Biosciences, University of Oslo, P.O. Box 1066 Blindern NO-0316, Norway
2. Division of Systematics and Evolutionary Botany, Department of Botany, University of Vienna, Rennweg 14, 1030, Vienna, Austria
3. INRA, UMR1062, CBGP, Avenue du Campus Agropolis, 34980 Montferrier-sur-Lez, France.
4. Department of Primatology, Max Planck Institute for Evolutionary Biology, Deutscher Platz 6, 04130, Leipzig, Germany
5. Department of Agriculture, Forest and Food Science, University of Turin, L.go P. Braccini 2, 10095, Grugliasco, Italy
Keywords: Invasive species, Demographic dynamics, Inbreeding, RAD sequencing, Gene
surfing.
Corresponding: Emiliano Trucchi; Division of Systematics and Evolutionary Botany,
Department of Botany, University of Vienna, Rennweg 14, 1030, Vienna, Austria; [email protected]
Abstract
Describing long-term evolutionary trajectories of alien species is a fundamental, although rarely possible, step to understand the pivotal drivers of successful invasions. Here, we tackled this task by investigating the genetic structure of the crested porcupine (Hystrix
cristata), whose invasion of Italy started about 1500 years ago. Using genome-wide RAD
markers, we explored the demographic processes that shaped, and are shaping, the gene pool of the expanding invasive populations and compared their genetic diversity with that of native and invasive populations of both African porcupine species (crested and Cape, H.
africaeaustralis). Through coalescence-based demographic reconstructions, we demonstrated
that bottleneck at introduction was mild and did not severely affect the reservoir of genetic diversity. Our data also highlighted a marked geographic structure in the invasive populations, indicating that they are likely the results of multiple introduction events. Nevertheless, both the invasive populations and its source show a lower level of diversity relative to other native populations from Sub-Saharan and South Africa, suggesting that demographic history before introduction may have played a role in forging a successful invader. Finally, we showed that the current spatial expansion at the northern boundary of the range is following a leading-edge model characterized by a general reduction of genetic diversity towards the edge of the
expanding range. Consistently, random fixation of alleles through gene-surfing seems a more likely explanation than adaptive divergence for the distribution of the few outlier loci with highly divergent frequencies between core and newly colonized areas.
Introduction
One of the most relevant and debated aspects when studying invasive biology concerns the importance of standing genetic diversity for successful invasions and colonization of a novel range (Reed & Frankham 2003, Frankham 2004, Facon et al. 2006, Roman and Darling 2007). In addition to the initial bottleneck at introduction, which may (Schmid-Hempel et al. 2007, Dlugosch & Parker 2008, Ciosi et al. 2008, Chapple et al. 2013) or may not (Kolbe et
al. 2004, Roman & Darling 2007, Estoup & Guillemaud 2010, Hufbauer et al. 2013) decrease
the genetic diversity of the introduced propagule, subsequent demographic processes related with range expansion (Edmonds et al. 2004, White et al. 2013) can also negatively affect diversity, thus limiting the adaptive potential of invasive populations and, ultimately, their further spread and/or persistence (Shine et al. 2011). Yet, other factors related to ecological traits of the exotic species and/or of the invaded ecosystem and coincidental events may be more important than initial genetic diversity in determining the success of an invasive population (Zayed et al. 2007). Past investigations have often reported cases of successful biological invasions despite low genetic diversity. However, the vast majority of studies of biological invasions has so far concerned systems with a recent history of introduction, lacking a deep temporal perspective (Strayer et al. 2006), and assessments of the long-term adaptive potential of successful biological invaders are still lacking (but see Cooling et al. 2011).
Crested porcupine (Hystrix cristata) was introduced to Italy (Italian peninsula and Sicily) in historical times, making it an excellent study system to test the importance of initial genetic diversity for an invasive population to persist and spread over time and space. A genetic survey based on three mitochondrial genes, identified the most likely source
and 1500 years ago (Trucchi & Sbordoni 2009). Independent analyses of archaeological evidences and iconographic documentation suggested the introduction to have occurred in late Antiquity or early middle ages (1500-1200 years ago) and that the presence in Sicily is not supported before early modern times (Masseti et al. 2010). Therefore, the first introduction of the crested porcupine into the peninsular Italy likely occurred at least around 1500 years ago. Moreover, the morphological differences between Sicilian and peninsular populations (Angelici et al. 2003) together with the relatively large mitochondrial diversity in the whole introduced range (Trucchi & Sbordoni 2009) raise the hypothesis that several independent events of introduction took place, possibly from different North Africa sources.
Historical records of the distribution of the porcupine in Italy highlight a dramatic range expansion in the last 40-50 years (Mori et al. 2013). The invasive population crossed the Apennines and colonized the eastern side of the Italian peninsula, passing the Po river in the Padana plain and getting as far north as the southern edge of the Alps. Intriguingly, the newly colonized area is climatically distinct from the pre-expansion range: warm temperate continental climate vs. Mediterranean coastal climate (Blasi et al. 2014). As the former climate type is not present in the source area (North Africa), this sudden range shift may have been driven by a novel adaptation. In stark contrast with the range expansion in northern Italy, the extant populations in North Africa are currently declining due to the intense anthropic pressure (Saleh & Basuony 1998, Nowak 1999, Cuzin 2003; Mohamed 2011) and to the ongoing aridification of the region (Thuiller et al. 2006, Kröpelin et al. 2008). On the other hand, the species still commonly occurs in Sub-Saharan Africa, from Senegal to Ethiopia and Tanzania, and a sibling species, the Cape porcupine (H. africaeaustralis), is found in austral Africa, from the Democratic Republic of Congo and Tanzania to South Africa (Nowak, 1999).
By means of vast genomic data, we here describe the genetic structure and the demographic dynamics of the invasive Italian crested porcupines in relation to native populations of both African species. First, we test if the long-lasting success of the invasive populations can be attributed to a high genetic diversity in the founding populations either from different propagules admixing in the invasive range or through a moderate bottleneck at introduction. We then genetically investigate the small-scale geographic pattern of the ongoing northward expansion and assess how the expansion process is affecting the genetic diversity along the colonization trajectory.
Methods
Sampling
More than 300 porcupines samples were collected in South Africa, Morocco and Italy from 2004 to 2012 or generously provided by colleagues and collaborators from Egypt, Tunisia, Senegal, Burkina Faso, Ivory Coast, Nigeria, Tanzania, Mozambique, Zambia and Namibia. Most of the samples were quills collected on the ground while only a few of them were muscle/blood tissue. Age and quality of preservation varied greatly across samples. DNA was extracted using the DNAase Blood and Tissue kit (Qiagen) following manufacturer's instructions. Quality and quantity of DNA was checked to identify high-quality samples suitable for genomic analysis. Concentration of DNA was measured using a fluorimetric method (Qubit, Invitrogen) whereas quality was checked by a spectroscopic method (Nanodrop) and by visual inspection of degradation after gel electrophoresis. Given the uneven quality of the sampled material and of the conservation status, ca. 75% of the samples were discarded as unsuitable to genomic analyses and ca. 10% of the remaining samples
failed in the sequencing run.
RAD sequencing
A total of 50 samples of crested porcupine (38 from the invasive Italian populations and 12 from native African populations) and 11 samples of Cape porcupine from native African populations were selected for RAD sequencing (see Figure 1 for the distribution of the samples; http://dx.doi.org/10.6084/m9.figshare.1356173). The RAD sequencing protocol from Baird et al. (2008) was slightly modified to prepare the libraries: i) approximately 100 ng of genomic DNA per sample were digested with the restriction enzyme SbfI (NEB); ii) each sample was ligated to a unique barcoded P1 adapter prior to pooling in a single library;
iii) libraries were sheared by sonication on a Bioruptor (Diagenode) where the target size
range fraction (300-500 bp) was achieved after seven cycles of sonication (30 seconds ON, 30 seconds OFF); iv) after concentration to 25 µl by DNA capture on magnetic beads (beads solution:DNA = 0.8:1), libraries were size selected by gel electrophoresis and manual excision; v) capture on magnetic beads (beads solution:DNA = 0.8:1) was then employed in all following purification steps (i.e. after blunt-end repairing, poly-A tailing, P2 adapter ligation and library enrichment by PCR); vi) PCR amplification was performed in 8 x 12.5 µl aliquots pooled after the amplification in order to reduce amplification bias on few loci due to random drift; vii) libraries were quantified by a fluorimetric-based method (Qubit, Invitrogen) and molarity checked on an Agilent Bioanalyzer chip (Invitrogen). A final volume of ca. 20 µl per library with a DNA concentration of 20-25 ng/µl was submitted for a paired-end 100 bp sequencing (two lanes on a ILLUMINA HiSeq2000) at the Norwegian Sequencing Centre, University of Oslo.
Bioinformatic analyses
Raw reads were processed using the scripts included in the Stacks package (Catchen et al. 2013) running on the server facility of the ABEL cluster, University of Oslo. Raw reads were quality filtered and demultiplexed according to individual barcodes. The parameters setting used to build the catalogs included: default values for the quality checking when using “process_radtags.pl”; -m 5-10, -n 7, -M 7 when running “denovo_map.pl”. In order to capture different levels of genetic variability within and between populations of the two species, we built three separate catalogs to accomplish downstream analyses: i) one including a subset of the Italian samples and all African samples (global, 39 samples), ii) one including all Italian and North Africa samples (invasive, 42 samples), and iii) one including a subset of the Italian samples with the highest amount of raw reads (invasive_reduced, 16 samples). The function
export_sql.pl in the Stacks package was used to extract loci information from each catalog
(maximum number of missing sample per locus = 25-50%; maximum number of SNP per locus = 10). Custom python scripts (available here) were employed to generate the final datasets and the input files for downstream analyses by further filtering the dataset in order to exclude loci with more than 2 alleles per individual, with heterozygosity above 0.75 or deleveraged by Stacks algorithm. Any SNP recorded in the last 10 base pairs of each locus was considered unreliable and removed. Further filtering to reduce missing data was applied on a case-by-case basis, according to the analysis performed (see below).
Global genetic structure across both species
The global dataset was used to infer the overall structure among native and invasive populations of the two porcupine species. Analyses were replicated allowing for both 50%
and 25% missing samples per locus. Following Wagner et al. (2013), loci were concatenated in a single sequence per sample coding heterozygosities as ambiguities in agreement with the IUPAC code. The whole sequence in each locus was included in order to get empiric estimates of base composition and percentage of invariant sites. A Maximum-Likelihood algorithm with a GTR + G + I substitution model was employed to reconstruct the phylogenetic tree of our samples using 100 rapid bootstrap inferences and thereafter a thorough ML search in RAXML 7.2.8 (Stamatakis 2006). Results were visualized and edited in FigTree 1.4 (http://tree.bio.ed.ac.uk/software/figtree/). Even if this cannot be considered as a true phylogenetic reconstruction, this random concatenation of recombining genomic fragments has proven to be informative (Wagner et al., 2013).
Recent demography of invasive populations
We used RAD sequences to reconstruct the demographic history of the invasive population following an approach recently proposed by Trucchi et al. (2014) that is effective in retrieving recent demographic processes. In short, a subset of highly variable RAD loci (more than 3 SNPs per locus) are used as short sequences in a coalescent-theory based multi-locus analysis (Extended Bayesian Skyline plot; Heled & Drummond 2008) implemented in BEAST 1.7.4 (Drummond & Rambaut 2007). Four random selections of 50 loci with 4 to 9 SNPs (none of the loci with 10 SNPs passed our filtering criteria) from the invasive_reduced dataset were employed as replicates to describe the past demography of the invasive crested porcupine population. The datasets were analyzed with the following settings of parameters and priors:
i) nucleotide substitution models, clock models and tree prior models were unlinked across
iii) a strict molecular clock was set for each marker with a uniform prior distribution on
substitution rate, bounded within 0.5 and 0.005 sub/s/Myr; iv) the Extended Bayesian Skyline Plot (EBSP) was selected as a tree prior model. 200 million iterations were set as run length.
In addition, we ran the EBSP analyses on three data sets including 50 RAD loci and mtDNA sequences published by Trucchi & Sbordoni (2009) using a Control Region substitution rate 0.2 substitution/site/Myr to calibrate our demographic reconstruction. An HKI with Gamma (4 classes) and Invariant site substitution model and a strict clock model were implemented. All analyses were run on a 24 CPUs server at the University of Oslo. Results were checked on Tracer 1.6 (http://tree.bio.ed.ac.uk/software/tracer) and the plot of the EBSP data was drawn in R (R Development Core Team 2011). As the invasive population showed a strong genetic structure (see Results), we ran again the EBSP using samples from one of the groups only (north Italy).
Genetic structure in the invasive population
The invasive dataset was used to study both the relationships between the invasive and source populations, and the fine-scale geographic structure of the invasive Italian population. First, using all the SNPs per locus and all samples in the dataset, we performed a Neighbor-Joining Network (NeighborNet) analysis (Bryant & Moulton 2004) based on uncorrelated p-distances in Splitstree (Huson & Bryant 2006). Then, extracting only one random SNP per locus and filtering samples with more than 50% missing loci we ran a Principal Component Analysis (PCA). The strict filtering in this second analysis was necessary because samples with too many missing loci tend to be unassigned (at the centre of the axes). The glPca function in the R packages “adegenet” was used for calculations. The fully Bayesian approach developed by
Foll & Gaggiotti (2008) and implemented in the software Bayescan was used to estimate the probability that each specific locus is subject to selection in the expanding population. For this test we included the samples from the north Italy population (except LLA01 and LLA02 that clustered more in between the two populations, and ITA09 that was genetically identified as belonging to the central Italy population – see below for more details) and the samples from central Italy (except MOL02 that was genetically identified as belonging to the northern population – see below for more details). Median-joining networks for the significant loci were then drawn in Splitstree including all samples in the invasive dataset. No minor allele frequency filtering was applied in this case. Sequences of outlier loci were used in a blast query on the GenBank Blast webtool using the blastn algorithm filtering with an e-value of 0.0001.
Heterozygosity estimates
Events of translocation and introduction into a new range are expected to induce a reduction in heterozygosity in the invasive population, and quick range expansions could produce a further clinal reduction in heterozygosity towards the expansion front. Nevertheless, levels of individual heterozygosity ultimately depend on levels of inbreeding, and are influenced by a variety of demographic process at different temporal and spatial scales. In order to test for the effect of introduction/translocation and recent range expansion on the levels of heterozigosity in crested porcupine populations, we used linear models in R and grouped individuals according to the geographic/genetic structure in our data as follows:
- To test for the long-term effect of introduction/translocation, we analysed the global dataset considering the following partition of samples: H. africaeaustralis samples (cape), H. cristata
samples from Sub-Saharan regions (Sub-Saharan), H. cristata samples from North Africa (source), and H. cristata samples from Italy (invasive).
- To test for local effects on the different invasive populations, we used the invasive dataset, grouping the samples according to the region of occurrence (In Italy: north, central, south, and Sicily) and including the source population as reference.
- To test for the short-term effect of the current range expansion in north Italy, we performed a separate test by partitioning samples included in the north Italy genetic cluster according to the age of invasion of their sampling area (stable viable population according to Angelici et
al. 2003 and Mori et al. 2013): 1959, 1999, 2012.
Despite their relevance as proxies for levels of inbreeding (Slate & Pemberton 2002), accurate estimates of individual heterozygosity from multilocus data are still a matter of debate (e.g. Aparicio et al 2006). We first estimated individual observed heterozygosity (Ho ind) simply as the number of heterozygous loci in a sample divided by the number of scored
loci in that sample. However, as our RADseq datasets were not mapped to a reference genome, a fraction of non-orthologous loci could have been included in the analysis and may appear in the data set as putative loci with artificially high Ho. We then estimated the
individual heterozygosity addressing this potential bias: an estimate (Ho ind-norm)
down-weighted for loci with higher heterozygosity was also calculated. While summing up the number of heterozygous loci in each sample, the contribution of each locus to the sum was first multiplied by 1 - locus Ho, where locus Ho is the observed heterozygosity at that locus
scored across all samples in the population. This provided a measure of heterozigosity that was not dependent on the identity of the loci genotyped for each individual and directly comparable across individuals. Since the probability of scoring heterozygotes is a function of coverage at any given locus, we included the amount of coverage information per sample (i.e.
number of reads) as a predictor in our analyses. As the likelihood of retrieving both alleles in a heterozygous will plateau as the number of reads increases, this predictor was
log-transformed. All analyses were replicated allowing for up to 50% and 25% missing samples per locus while datasets were not filtered to a priori remove loci with Ho > 0.75.
Absolute levels of expected heterozygosity or gene diversity (He) in a population
calculated on a set of loci are primarily influenced by the ascertainment bias introduced when those loci are selected. Therefore, in order to compare different populations, He must be
calculated on the same set of loci. We used the global and the invasive dataset respectively to estimate He and Ho in studied populations/groups of individuals (global: cape, Sub-Saharan,
source, invasive, invasive-north; invasive: source, Sicily, south, centre, north, north-1959, north-1999, north-2012). A minimum number of 3 samples per population/group was set as a requirement to include a locus in the analysis. A summary of the individuals included in each group and of the valid loci per group is reported in Table 1. Contrarily to Ho, He is less biased
by the individual coverage as only rare alleles may be lost when the coverage of a locus is consistently low across all individuals in a population. Given the stochasticity of the RADseq approach, no correction for coverage was applied when estimating He according to Nei
(1978).
Results
After de-multiplexing, the average number of single reads retained per sample was between ca. 500,000 and ca. 7,100,000. The starting quality of the samples’ DNA strongly influenced the low evenness across samples with the blood/tissue samples associated with higher sequencing yield. When allowing for loci with 50% of missing samples, the number of loci
retained in each catalog after filtering was: 52,108 in the invasive_reduced dataset (http://dx.doi.org/10.6084/m9.figshare.1356184), 65,739 in the invasive dataset (http://dx.doi.org/10.6084/m9.figshare.1356185) and 89,386 in the global dataset
(http://dx.doi.org/10.6084/m9.figshare.1356186). The higher number of loci scored in the
global dataset likely depends on the inclusion, in the latter, of phylogenetically distant
populations. In fact, due to mutations in the restriction site, the allele drop-out grows with the phylogenetic distance among populations/species (Gautier et al. 2013), and the overall number of loci in the dataset grows as well.
The global catalog was employed in a Maximum-Likelihood tree reconstruction
without any additional filtering (89,386 loci – up to 50% missing samples per locus). Replicated analyses using a reduced dataset (19,559 loci – up to 25% missing samples per locus) were also performed and produced highly similar results on main nodes (not shown). As expected, the tree shows a clear differentiation between the cape and the crested
porcupines (Figure 2a); the samples belonging to the cape species form a cluster of mostly unresolved relationships where there is little or no geographical structure in the genetic diversity, characteristic of a population with a high level of admixture. On the other hand, the crested porcupine populations show a higher level of geographic differentiation. The genetic diversity follows the distribution of the species from East Africa where it overlaps with the cape species (Tanzania and Ethiopia) to the West (Nigeria, Ivory Coast, Burkina Faso and Senegal) and then northward, to the Mediterranean coast of Africa and Italy (Morocco, Tunisia, Egypt, Italy). The invasive Italian population stands out for its geographic structure. Several clusters are recognizable across the invasive samples: one in the south of the Italian peninsula, one in Sicily where samples from Tunisia and Egypt also cluster, one in central Italy and one in the north of the peninsula.
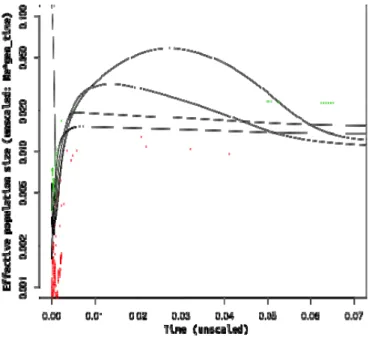
When analyzing the information about the past demography inferred from the invasive samples (Figure 3), a clear signature of a recent bottleneck is detected. As this event likely corresponds to the introduction, the population decrease does not appear to have been as strong as expected (only 5x decrease in population size corresponding to a few hundreds individuals). Our analysis suggests a very recent time for the bottleneck within the last 2000 years, taking into account the confidence interval and assuming a mutation rate of 0.2 substitutions/site/Myr for the mitochondrial Control Region. Suggestively, the calibrated demography shows a decrease in population size starting well before the bottleneck that can be traced back to the end of the African Humid Period (AHP), when the green Sahara turned into a desert again (deMenocal et al., 2000). The bottleneck is also detected when the
mitochondrial marker is not included in the analyses (Fig. S1) but it is not retrieved when the mtDNA is analyzed on its own (Trucchi & Sbordoni 2009). Independent runs employing only samples from the north Italy population produced the same demographic reconstruction ruling out the structure in the invasive population as a source of the observed pattern (not shown).
The structure of the genetic diversity in the invasive population (using the invasive dataset) was investigated with respect to the samples from the source areas (NeighborNet; Figure 4a) or focusing only on the invaded range (PCA; Figure 4b). Given that the PCA is very sensitive to missing data (in this case, missing loci per individual), we further filtered the
invasive dataset removing four individuals with more than 50% missing loci (EMR01, ITA09,
SSC01, LRM03). Results were consistent with each other and with the ML tree estimated on the global dataset: the same four clusters (Sicily + North Africa – the latter only visible in the NeighborNet -, south Italy, central Italy, and north Italy) are recognizable in the NeighborNet and in the PCA. Only two samples did not cluster according to their geographic origin:
Italy and MOL02, sampled in central Italy. These two samples cluster with the central and the north populations, respectively. The search for outliers loci (i.e. loci showing higher than average FST) when comparing the expanding population in north Italy with the resident
population in central Italy showed 5 loci over the significance threshold assuming 5% of False Discovery rate (Fig. 5). A median-joining network for each of them is also shown. No
significant hit on the GenBank database was obtained through the blast search.
Residuals of the model Ho ind ~ log(raw reads) are plotted in Figure 2b, 4c, 6b
according to the grouping strategy mentioned in the section Methods, Heterozygosity
estimates. In this analysis, results were not different when analyzing datasets with 25% or
50% missing samples (only the latter are reported) or when applying the correction (down-weighting) for the loci with high Ho (Ho ind-norm). Heterozygosity is higher in the cape and
Sub-Saharan groups than in the source and invasive ones (Fig. 2b). In the invasive range, all populations, with the exception of south Italy, show higher heterozygosity than the source but quite different from one another (Fig. 4c). However, it has to be noted that only four samples are included in the source group. Interestingly, the Sicily population (3 samples), likely introduced at a later stage and clustering closer to the source, shows the highest average heterozygosity. When investigating the fate of the heterozygosity along the recent range expansion in the north Italy population (Fig. 6), our results show a consistent decrease in heterozygosity from the core to the edge of the recently invaded area. The decrease is particularly evident in the most recently occupied area (stable viable population
acknowledged in 2012). Population/group levels of He are reported in Table 1. Considering
the situation in the native range (estimated on the global dataset), He is maximum in the
Sub-Saharan while is minimum in the sample from North Africa (source). When compared with the source areas, the expected heterozygosity in the invasive range shows similar values in the
centre and north populations but lower in the south and Sicily populations. At the leading edge of the current invasive range expansion (invasive-north-2012 and north-2012 in the
global and invasive dataset analysis respectively), He level is lower than at the core of the expansion (invasive-north and north-1959, respectively; Tab. 1b). Notably, the minimum He
level in the invasive range was recorded in the population from Sicily, in stark contrast with the high level shown for individual observed heterozygosity (Ho ind, see above).
Discussion
Understanding the pivotal drivers of a successful invasion
The crested porcupine populations naturalized, and currently expanding, in Italy are the result of a long-lasting and successful invasion (Trucchi & Sbordoni 2009, Masseti et al. 2010, Mori
et al. 2013). Our present study shows that both gene diversity (He) and observed
heterozygosity (Ho ind) in the whole invasive sample are higher than in the most likely source
population, a rather unexpected result. The genetic diversity indexes for the Italian
populations, however, are clearly lower than in other natural populations of the two African porcupine species (Fig. 2b, Tab. 1a), and both indexes of genetic diversity vary strongly across the range (Fig. 4c, Tab. 1b) indicating that local demographic processes play a major role in shaping diversity patterns in these species. Indeed, as more than a thousand years have passed since the first introduction in Italy, it is likely that the current diversity in the North Africa source populations is lower than at the time of the introduction, as a consequence of the anthropogenic collapse of the species in the area (Nowak 1999, Cuzin 2003). While more data from North Africa populations are needed to conclude on this aspect, the EBSP analysis of Italian populations clearly recovered a bottleneck that can be associated with the
introduction (Fig. 3), but at the same time highlighted that this bottleneck was relatively mild, with minimum estimated effective sizes in the order of several hundred individuals.
Therefore, our data point out that the invasive Italian population of H. cristata traces the origins of its genetic diversity to a relatively large number of founders, probably the result of several episodes of introduction.
In fact, even if the large effective population size estimated by our approach shows that the origins of the genetic diversity of Italian porcupines, as a whole, trace back to a relatively large number of founders, this does not mean that the initial outbreaks of invasion were composed by many individuals: a scenario with many, small propagules seems more likely than a single, massive, introduction and naturalization of hundreds of individuals. These small initial populations would have been strongly inbred, so that a successful invasion would have still depended on how well they could stand their genetic load. As mentioned above, comparing samples from North Africa and Italy with those from Sub-Saharan Africa and South Africa (H. africaeaustralis) shows that genetic diversity is much higher in the latter (Fig. 2b). This suggests that the introduction was carried out from populations that had
already lost some of their genetic diversity. In fact, North Africa populations were (and still are) suffering from the ongoing desertification of the Sahara, which started approximately 6000 years ago (deMenocal et al. 2000). This long history of habitat fragmentation after the African Humid period is likely to have caused contraction and isolation of North Africa populations, thus increasing inbreeding and decreasing (local) genetic diversity. After a long period of inbreeding, selection can purge the genetic load by wiping out recessive alleles that are deleterious when in homozygous state (Charlesworth & Willis 2009). Of course, very few populations can stand the negative effects of inbreeding and most of them will likely go extinct. The surviving populations, however, can be more tolerant of high inbreeding level in
the future and in some cases have higher fitness than less inbred ones (Crow 1970). Effectiveness and magnitude of fitness rebound caused by purging the genetic load is still unclear and largely debated (see Crnokrak & Barret 2002 for a review). Nevertheless, the importance of this process in shaping invasiveness potential was demonstrated in laboratory experiments where higher fitness was measured in invasive populations that experienced mild bottlenecks compared to native populations (Facon et al. 2011, Tayeh et al. 2013). We here suggest that the past history of contraction and fragmentation of crested porcupine
populations in the source range could have forged an optimal invader with high tolerance to increased inbreeding level (Fig. 2).
Structure and dynamics of invasive populations.
Our results reveal a complex genetic structure in the crested porcupine invasive range in Italy and show a decrease in genetic diversity along the recent spatial expansion occurring at the northern edge of the distribution. Porcupine populations in peninsular Italy are partitioned in three groups (Fig. 4a,b): one in the south, one in the centre and one in the north. Exceptions in our dataset are one sample collected in northern Italy (ITA09), at an early stage of the range expansion, and one collected in central Italy (MOL02) that cluster with the central and northern groups respectively. While the latter can likely be the result of locality mislabeling, the former could also be the result of long-distance human-mediated introductions of this species (summarized by Mori et al. 2013). Nevertheless, our data show that this stepping-stone introduction did not contribute in the gene pool of the naturally expanding population. Our results support the hypothesis, drawn from historical records (Masseti et al. 2010), that Sicily was colonized from a separate source area. Individuals from this population are
genetically closer to those from North Africa than to other Italian samples (Fig. 2, 4a). Indeed, porcupines from southern Italy and Sicily are also closer to the North Africa populations at a morphological level (Angelici et al. 2003). The other two populations in peninsular Italy (north and centre) likely have a different, previous, origin on the basis of the results of our clustering analysis (Fig. 4a). However, given our limited sampling in North Africa, we could not locate the most probable source (if this population still exists). In general, the clear geographic structure in the invasive Italian populations supports multiple introduction events at different times and likely from different sources. In addition, limited gene flow (i.e. limited propagule admixture) must have followed in order to observe this structure after a long time since introduction.
Additionally, our data demonstrated that the dramatic range expansion recorded in the last 50 years is following a leading-edge pattern (Hewitt 1996), with the north Italian
population acting as the only colonization source (Fig. 1, 4, 6). Moreover, our analyses showed a clear decrease in the genetic diversity with the year of presumed colonization (Fig. 6), mainly in terms of individual observed heterozygosity but also in terms of gene diversity at the northernmost edge of the expansion (Tab. 1). Such a pattern is definitely consistent with expectations from the gene surfing model (Edmonds et al. 2004, DeGiorgio et al. 2011). According to this model, genetic diversity is reduced at the leading edge of the expansion, whereas local gene flow and admixture is expected to balance the diversity loss at the trailing edge. However, if there is any spatial constraint in the newly colonized area (mountain ridges, rivers) that can slow down the gene flow between the leading and the trailing part of the expanding population, it will then be more difficult to re-establish the level of diversity present at the original core of the expansion (Excoffier et al. 2009). The mountain ridge along the Italian peninsula (Apennines) and the main river in the Padana plain (Po) could act as
constraints to future gene flow. Another interesting aspect concerns the rate of spatial expansion of the invasive population, which was particularly high in the last decade (Mori et
al. 2013). It has been shown that, when the speed of an expansion is too high, phenotypes that
are advantageous for the expansion can accumulate at the front edge (Phillips et al. 2006) whereas the same phenotype can have a much lower fitness when the population stops expanding (Shine et al. 2011). Our outlier analyses (Fig. 5) revealed a few loci showing a higher than background FST when the expanding population in north Italy was compared with
the central population. In all cases but one (Locus 5 in Figure 5), the allele at high frequency in the expanding range was also present in at least one of the other populations in Italy or North Africa. The pattern observed at these loci is more likely the result of a demographic process that led one allele to fixation in the expanding population (i.e. gene surfing) than the signature of a novel emerging adaptation. In fact, the strong drift acting at the edge of the expansion front causes intense fluctuation in allele frequencies likely leading to fixation. Nevertheless, results from our study do not allow any conclusive inference on the drivers of this range expansion. At least three hypotheses need to be further investigated: i) the reduced anthropic pressure due to the massive abandonment of the countryside after the Second World War and legal protection since 1980; ii) the effect of ongoing climate change (for analyses of climate change in Italy cf. Brunetti et al. 2006) or iii) an emerging adaptation in the northern Italian population that allowed the colonization despite relatively novel climate conditions (from Mediterranean sub-coastal to warm temperate areas; Blasi et al. 2014). Based on the solid background about the structure and the dynamics of the neutral genetic diversity provided in this paper, further analyses will be focused on putative adaptive response in the expanding invasive population aiming at disentangling the effects of demographic processes from those of selection.
Acknowledgements
We would like to thank all the colleagues and friends that kindly helped providing samples from all over Africa. We thank Ovidiu Paun for helpful comments on early versions of the manuscript. This study was supported by Marie Curie Intra European Fellowships (FP7-PEOPLE-IEF-2010, European Commission; project no. 252252 to E.T.) and by the Centre for Ecological and Evolutionary Synthesis, Department of Biosciences, University of Oslo, Norway.
References
Angelici F.M., & Amori G. (1999) Distribution of the Crested porcupine Hystrix cristata L., 1758 in peninsular Italy and Sicily. Bollettino del Museo Regionale di Scienze Naturali
(Torino), 16, 83-88.
Angelici FM, Capizzi D, Amori G, Luiselli L (2003) Morphometric variation in the skulls of the crested porcupine Hystrix cristata from mainland Italy, Sicily, and northern Africa.
Mammalian Biology - Zeitschrift für Säugetierkunde, 68, 165–173.
Aparicio JM, Ortego J, Cordero PJ (2006) What should we weigh to estimate heterozygosity, alleles or loci? Molecular Ecology, 15, 4659–4665.
Baird NA, Etter PD, Atwood TS et al. (2008) Rapid SNP Discovery and Genetic Mapping Using Sequenced RAD Markers. PLoS ONE, 3, e3376.
Blasi C, Capotorti G, Copiz R et al. (2014) Classification and mapping of the ecoregions of Italy. Plant Biosystems - An International Journal Dealing with all Aspects of Plant
Biology, 148, 1255–1345.
Brunetti M, Maugeri M, Monti F, Nanni T (2006) Temperature and precipitation variability in Italy in the last two centuries from homogenised instrumental time series. International
Journal of Climatology, 26, 345–381.
Bryant D, Moulton V (2004) Neighbor-Net: An Agglomerative Method for the Construction of Phylogenetic Networks. Molecular Biology and Evolution, 21, 255–265.
Catchen J, Hohenlohe PA, Bassham S, Amores A, Cresko WA (2013) Stacks: an analysis tool set for population genomics. Molecular Ecology, 22, 3124–3140.
Chapple DG, Miller KA, Kraus F, Thompson MB (2013) Divergent introduction histories among invasive populations of the delicate skink (Lampropholis delicata): has the importance of genetic admixture in the success of biological invasions been overemphasized? Diversity and Distributions, 19, 134–146.
Charlesworth D, Willis JH (2009) The genetics of inbreeding depression. Nature Reviews
Genetics, 10, 783–796.
Ciosi M, Miller NJ, Kim KS et al. (2008) Invasion of Europe by the western corn rootworm,
Diabrotica virgifera virgifera: multiple transatlantic introductions with various reductions
of genetic diversity. Molecular Ecology, 17, 3614–3627.
Cooling M, Hartley S, Sim DA, Lester PJ (2011) The widespread collapse of an invasive species: Argentine ants (Linepithema humile) in New Zealand. Biology Letters, rsbl20111014.
Crnokrak P, Barrett SCH (2002) Perspective: Purging the genetic load: A review of the experimental evidence. Evolution, 56, 2347–2358.
Crow JF (1970) Genetic loads and the cost of natural selection In: Mathematical Topics in Population Genetics. Springer, New York.
Cuzin F (2003) Les grands mammifères du Maroc méridional (Haut Atlas, Anti Atlas et Sahara): Distribution, Ecologie et Conservation. Ph.D. Thesis, Laboratoire de
Biogéographie et Ecologie des Vertèbrés, Ecole Pratique des Hautes Etudes, Université Montpellier II.
DeGiorgio M, Degnan JH, Rosenberg NA (2011) Coalescence-Time Distributions in a Serial Founder Model of Human Evolutionary History. Genetics, 189, 579–593.
deMenocal P, Ortiz J, Guilderson T et al. (2000) Abrupt onset and termination of the African Humid Period:: rapid climate responses to gradual insolation forcing. Quaternary Science
Reviews, 19, 347–361.
Dlugosch KM, Parker IM (2008) Invading populations of an ornamental shrub show rapid life history evolution despite genetic bottlenecks. Ecology Letters, 11, 701–709.
Drummond AJ, Rambaut A (2007) BEAST: Bayesian evolutionary analysis by sampling trees. BMC Evolutionary Biology, 7, 214.
Edmonds CA, Lillie AS, Cavalli-Sforza LL (2004) Mutations arising in the wave front of an expanding population. Proceedings of the National Academy of Sciences of the United
States of America, 101, 975–979.
Estoup A, Guillemaud T (2010) Reconstructing routes of invasion using genetic data: why, how and so what? Molecular Ecology, 19, 4113–4130.
Excoffier L, Foll M, Petit RJ (2009) Genetic Consequences of Range Expansions. Annual
Review of Ecology, Evolution, and Systematics, 40, 481–501.
Facon B, Genton BJ, Shykoff J et al. (2006) A general eco-evolutionary framework for understanding bioinvasions. Trends in Ecology & Evolution, 21, 130–135.
Facon B, Hufbauer RA, Tayeh A et al. (2011) Inbreeding Depression Is Purged in the Invasive Insect Harmonia axyridis. Current Biology, 21, 424–427.
Foll M, Gaggiotti O (2008) A Genome-Scan Method to Identify Selected Loci Appropriate for Both Dominant and Codominant Markers: A Bayesian Perspective. Genetics, 180, 977–993.
Frankham R (2004) Resolving the genetic paradox in invasive species. Heredity, 94, 385– 385.
Gautier M, Gharbi K, Cezard T et al. (2012) The effect of RAD allele dropout on the estimation of genetic variation within and between populations. Molecular Ecology, 22, 3165-3178.
Heled J, Drummond AJ (2008) Bayesian inference of population size history from multiple loci. BMC Evolutionary Biology, 8, 289.
Hewitt GM (1996) Some genetic consequences of ice ages, and their role in divergence and speciation. Biological Journal of the Linnean Society, 58, 247–276.
Hufbauer RA, Rutschmann A, Serrate B, Vermeil de Conchard H, Facon B (2013) Role of propagule pressure in colonization success: disentangling the relative importance of demographic, genetic and habitat effects. Journal of Evolutionary Biology, 26, 1691–1699. Huson DH, Bryant D (2006) Application of Phylogenetic Networks in Evolutionary Studies.
Molecular Biology and Evolution, 23, 254–267.
Kolbe JJ, Glor RE, Rodríguez Schettino L et al. (2004) Genetic variation increases during biological invasion by a Cuban lizard. Nature, 431, 177–181.
Kröpelin S, Verschuren D, Lézine A-M et al. (2008) Climate-Driven Ecosystem Succession in the Sahara: The Past 6000 Years. Science, 320, 765–768.
Masseti M, Albarella U, De Grossi Mazzorin J (2010) The crested porcupine, Hystrix cristata L., 1758, in Italy. Anthropozoologica 45, 27–42.
Mohamed WF (2011) The Crested Porcupine Hystrix cristata (Linnaeus, 1758) in Misurata, Libya. European Journal of Biological Sciences, 3, 9–12.
Mori E, Sforzi A, Di Febbraro M (2013) From the Apennines to the Alps: recent range expansion of the crested porcupine Hystrix cristata L., 1758 (Mammalia: Rodentia: Hystricidae) in Italy. Italian Journal of Zoology, 80, 469–480.
Nei M (1978) Estimation of average heterozygosity and genetic distance from a small number of individuals. Genetics, 89, 583-590
Nowak RM (1999) Walker's Mammals of the World. The Johns Hopkins University Press, Baltimore and London.
Phillips BL, Brown GP, Webb JK, Shine R (2006) Invasion and the evolution of speed in toads. Nature, 439, 803–803.
R Development Core Team (2011) R Foundation for Statistical Computing, Vienna, URL http://www.R-project.org.
Reed DH, Frankham R (2003) Correlation between Fitness and Genetic Diversity.
Conservation Biology, 17, 230–237.
Roman J, Darling JA (2007) Paradox lost: genetic diversity and the success of aquatic invasions. Trends in Ecology & Evolution, 22, 454–464.
Saleh MA, & Basuony M (1998) A contribution to the mammalogy of the Sinai Peninsula.
Mammalia, 62, 557–575.
Schmid-Hempel P, Schmid-Hempel R, Brunner PC, Seeman OD, Allen GR (2007) Invasion success of the bumblebee, Bombus terrestris, despite a drastic genetic bottleneck. Heredity,
99, 414–422.
Shine R, Brown GP, Phillips BL (2011) An evolutionary process that assembles phenotypes through space rather than through time. Proceedings of the National Academy of Sciences,
108, 5708–5711.
Slate J, Pemberton JM (2002) Comparing molecular measures for detecting inbreeding depression. Journal of Evolutionary Biology, 15, 20–31.
Stamatakis A (2006) RAxML-VI-HPC: maximum likelihood-based phylogenetic analyses with thousands of taxa and mixed models. Bioinformatics, 22, 2688–2690.
Strayer DL, Eviner VT, Jeschke JM, Pace ML (2006) Understanding the long-term effects of species invasions. Trends in Ecology & Evolution, 21, 645–651.
Tayeh A, Estoup A, Hufbauer RA et al. (2013) Investigating the genetic load of an emblematic invasive species: the case of the invasive harlequin ladybird Harmonia
axyridis. Ecology and Evolution, 3, 864–871.
Thuiller W, Broennimann O, Hughes G et al. (2006) Vulnerability of African mammals to anthropogenic climate change under conservative land transformation assumptions. Global
Change Biology, 12, 424–440.
Trucchi E, Gratton P, Whittington JD et al. (2014) King penguin demography since the last glaciation inferred from genome-wide data. Proceedings of the Royal Society B: Biological
Sciences, 281, 20140528.
Trucchi E, Sbordoni V (2009) Unveiling an ancient biological invasion: molecular analysis of an old European alien, the crested porcupine (Hystrix cristata). BMC Evolutionary
Biology, 9, 109.
Wagner CE, Keller I, Wittwer S et al. (2013) Genome-wide RAD sequence data provide unprecedented resolution of species boundaries and relationships in the Lake Victoria cichlid adaptive radiation. Molecular Ecology, 22, 787–798.
White TA, Perkins SE, Heckel G, Searle JB (2013) Adaptive evolution during an ongoing range expansion: the invasive bank vole (Myodes glareolus) in Ireland. Molecular
Ecology, 22, 2971–2985.
Zayed A, Constantin ŞA, Packer L (2007) Successful Biological Invasion despite a Severe Genetic Load. PLoS ONE, 2, e868.
Data accessibility
Data are publicly available here: http://dx.doi.org/10.6084/m9.figshare.1356174 Author contributions
Designed research: ET, NCS; performed research: ET; contributed analytical tools and sampling ET, EM, SJ, PG; analyzed data: ET; wrote the paper: ET, BF, PG, NCS, SJ.
Tables
Table 1. Expected heterozygosity (He) estimated using the global dataset (a) and the invasive
dataset. The percentage of valid loci (see Methods for filtering criteria) of the specific dataset used in each group/population is reported in brackets.
Figures
Figure 1. Distribution of the successfully genotyped samples in Africa (a) and Italy (b).
Colors identify H. africaeaustralis (pale blue), H. cristata from Sub-Saharan regions (orange), H. c. from North Africa, source population, (purple), H. c. from the invasive range according to its genetic structure: Sicily (blue), south Italy (black), central Italy (green), and north Italy (red). A digital elevation model is also shown on both maps (altitude classification is not the same).
Figure 2. Global genetic structure and diversity of the African porcupines.
Maximum-Likelihood tree (a) where nodes with bootstrap support > 99% are indicated (grey filled circles) and residuals of the model Ho ind ~ log(raw reads) per species/population (b). Colors
Figure 3. Recent demography of the invasive population. Extended Bayesian Skyline plot
using 16 samples from the invasive range. Results of three independent runs including 50 RAD loci and the mitochondrial data are shown. The median (black), as well as the lower (red) and the upper (green) boundaries of the 95% credible region are given. Time is given in years before present (x-axis) while effective population size is in individuals (y-axis).
Figure 4. Structure and diversity of the invasive population. Neighbor-Joining Network (a),
principal component analysis (b) and residuals of the model Ho ind ~ log(raw reads) per
population (c). N.B. Not all samples in the NeighborNet are included in the PCA analysis (see text for further details). Colors are the same as in Figure 1.
Figure 5. Fst outlier loci in the comparison between the expanding (north Italy) and a resident
(Central Italy) population. A median-joining network is shown for the loci passing the probability threshold (1-5) including samples from any population in the invasive dataset (no minor allele frequency filtering applied). Colors are the same as in Figure 1.
Figure 6. Heterozygosity decrease along the recent range expansion. Timeline of the recent
spatial expansion from 1959 to 2012 (a) modified from Angelici and Amori (1999) and Mori et al., (2013), repartition of the samples in the north Italy population according to the year the area they were sampled in was acknowledged as colonized (b), and residuals of the model Ho ind ~ log(raw reads) per group (c).
Figure S1. Recent demography of the invasive population. Extended Bayesian Skyline plot
using 16 samples from the invasive range. Results of four independent runs including 50 RAD loci only are shown. The median (black), as well as the lower (red) and the upper (green) boundaries of the 95% credible region are given. Time and effective population size are not scaled.