A Parts Per Billion (ppb) Sensor for NO
2
with Microwatt (W)
Power Requirements based on Micro Light Plates
Olga Casals
1,*, Nicolai Markiewicz
1,2, Cristian Fabrega
1, Isabel Gràcia
4, Carles Cané
4,
Hutomo Suryo Wasisto
2,3, Andreas Waag
2,3, Joan Daniel Prades
11 MIND-IN2UB, Department of Electronic and Biomedical Engineering, Universitat de Barcelona, E-08028 Barcelona 2 IHT-LENA, Technische Universität Braunschweig, D-38106 Braunschweig, Germany
3 Epitaxy Competence Center (ec2), Technische Universität Braunschweig, D-38106 Braunschweig, Germany 4 IMB-CNM (CSIC), Institut de Microelectrònica de Barcelona, Campus UAB, E-08193 Bellaterra, Spain
ABSTRACT: A film of gas sensitive ZnO nanoparticles has been coupled with a low-power micro light plate (µLP) to achieve a NO2-parts-per-billion conductimetric gas sensor operating at room
temperature. In this µLP configuration, an InGaN-based LED (emitting at 455 nm) is integrated at a few hundred nanometers dis-tance from the sensor material, leading to sensor photoactivation with well controlled, uniform and high irradiance conditions, and very low electrical power needs. The response curves to different NO2 concentrations as a function of the irradiance displayed a bell‐
like shape. Responses of 20% to 25 ppb of NO2 were already
ob-served at irradiances of 5 mWatts·cm-2 (applying an electrical
power as low as 30 µW). In the optimum illumination conditions (around 60 mWatts · cm-2, or 200 µW of electric power), responses
of 94% to 25 ppb were achieved, corresponding to a lower detec-tion limit of 1 ppb of NO2. Higher irradiance values worsened the
sensor response in all the parts-per-billion range of NO2
concentra-tions. The responses to other gases such as NH3, CO and CH4 were
much smaller, showing a certain selectivity towards NO2. The
ef-fects of humidity on the sensor response are also discussed.
KEYWORDS: Gas Sensor, Nitrogen Dioxide (NO2), High
Sensi-tivity, Photo/Light Activation, Micro Light Plate (LP), Light Emitting Diode (LED), InGaN, Ultra Low Power.
Nitrogen dioxide (NO2) is a pollutant gas produced in many of
the combustion processes1 related to heating, industry and
transpor-tation, which is object of societal awareness in densely populated areas, especially after public controversies around its emission from diesel engines.
NO2 is harmful to human health even at concentrations as low as
a few hundred parts per billion (ppb)2, therefore its monitoring
re-quires highly sensitive methods, with very low detection limits. Among the different solutions present in the market, electrochemi-cal and semiconductor sensors are the most widespread. The former ones offer detection limits down to 100 ppb and good specificity (with some cross-sensitivity to O3 3); but are relatively bulky,
some-how fragile, and require frequent calibration4,5. The latter ones offer
similar detectivities in a more robust and much cheaper configura-tion, but lack of proper specificity and require higher amounts of power to reach the high temperatures needed to come into opera-tion6,7. To avoid the need of such heating, it is well-known that
some metal oxide (MOX) semiconductor sensors can be operated at room temperature with the help of light activation8–12. In fact, it
has been demonstrated that light-activated metal oxide sensors can
render sensing performances fully equivalent to those obtained with heating13.
To date, there is a broad literature available reporting light acti-vated MOX sensors for NO28,9,21–29,13–20. These works investigate
the use of different MOXs (like SnO2, ZnO, In2O3) and MOXs
combinations (binary MOX composites, composites of MOXs with catalysts and molecular surface functionalization of MOXs) under different illumination conditions (wavelengths and irradiance lev-els), and device arrangements (integrated vs. discrete components), being the lowest detection limits reported to date above 100 ppb13,16. None of these works addresses the optimization of the
power needed to illuminate the sensor material, and either report figures typically above 10 mW or just provide no information about that.
On this regard, we have recently reported on the micro light plate configuration (LP), which is a sensor architecture built around a miniaturized LED30. In the LP, the sensor material is placed
di-rectly on top of a planar LED structure, only separated by a few hundred nanometers to insulate it electrically. Consequently, al-most all the light emitted by the LED impinges on the sensor MOX, allowing for very well controlled, uniform and high irradiances, with a reduced electrical power consumption.
In this work, we report on a new NO2 sensor based on the micro
light plate configuration, capable of detecting NO2 in
concentra-tions ranging from a few parts per billion (ppb) to parts per million (ppm), with power requirements as low as 30 W. To the best of our knowledge, this is the lowest detection limit reported for light activated metal oxide sensors, and the lowest power consumption as well.
Figure 1.a shows a general view of the LPs we fabricated. A detailed description about their design and fabrication process can be found elsewhere30 The LP exposed four independent pads: two
to operate the blue InGaN LED (455 nm peak emission), and two more to measure the electrical resistance of the sensor material ly-ing across a pair of interdigitated electrodes (IDE). As a sensor ma-terial, we choose to work with ZnO nanoparticles (maximum size 130 nm, according the specifications provided, Aldrich Prod. No. 721085, CAS Number 1314-13-2)31,32. The nanoparticles were
de-posited on top of the IDEs by micro-drop casting. To that end, we suspended them in diethylene-glycol (CAS Number 111-46-6), which was left to dry in open air at 150C after the deposition. Fol-lowing this deposition method, the ZnO nanoparticles displayed a broad light absorption edge in the visible range31, that overlaps with
Figure 1. Details of the μLP used in this work. (a) Global view of the device. Metal pads to the p-GaN anode, n-GaN cathode and the IDE pair are shown. The area of the p-GaN mesa can also be seen as a slightly pink-shaded pol-ygon under the IDE-1, p-GaN and IDE-2 pads. The active portion of the μLP device is restricted to the IDE area, containing the sensor material on top, and the LED emitter underneath. See magnified details in (b) bare IDE, (c) ZnO material deposited on top of the IDE , and (d) LED lit on. (e) Light emission spectrum ϕe,λ of the InGaN LED in the µLP and light
transmis-sion spectrum T of a layer of ZnO NP deposited on a bare sapphire sub-strate.
To investigate the response to gases of these devices, we intro-duced them in a gas tight chamber flowing gas blends prointro-duced by means of a set of Mass Flow Controllers (MFC, Bronkhorst) at a constant total rate of 400 ml/minute. Reference atmospheres were produced by diluting certified gas patterns in dry synthetic air (SA) (20% O2 + 80% N2 in volume ratio, with a purity of 99.999%, H2O
< 5ppm, CnHm < 1ppm). Patterns of 10 ppm of NO2, 100 ppm of
NH3, 100 ppm CO and 1% of CH4 were used to incorporate the
target gases. Relative humidity (RH) −considered at 20ºC and 1 atm− was introduced in some experiments by means of a Con-trolled Evaporator and Mixer system (CEM, Bronkhorst) by evap-orating ultrapure water (> 18 MΩ · cm). The gas chamber was equipped with feedthrough electrical connections to drive the LEDs and to measure the electrical resistance of the MOX layer, by means of a Keithley 2400 sourcemeter SMU. LEDs driving and resistance measurements were carried out under constant current conditions. Ten devices were produced and investigated along several weeks, displaying sensor signal differences of less than 10% before and after the measurement campaign. More details about this experi-mental set-up can be found elsewhere33.
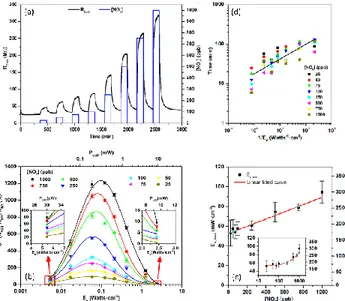
Figure 2.a shows a representative resistance record of one of our devices exposed to increasing concentrations of NO2 ranging from
25 ppb to 1 ppm under steady light irradiance. Clearly, the device is sensitive even to the lowest concentrations available in our setup (25 ppb). A signal to noise ratio analysis suggests that it could be sensitive to concentrations as low as 1 ppb‡ under the most favora-ble illumination conditions (i.e. peak sensitivities achieved at 60 mWatts · cm-2 with 200 µW of electric power§). Figure 2.b
summa-rizes the responses** 𝑆 we obtained to the previous NO
2
concentra-tions at different optical power levels, expressed in terms of the ir-radiances E𝑒 impinging on the sensor material. The corresponding
values of electric power P𝐿𝐸𝐷 needed to obtain these irradiance
val-ues are shown in the top x-axis (notice that in the case of InGaN-LEDs the relationship between E𝑒 and P𝐿𝐸𝐷 is not directly
propor-tional34). Clearly, the response to gases exhibits a complex
‡ To estimate the detection limit, we assumed that signal detection
is feasible at values 5 times larger than the noise to signal ratio, which is a common practice in the literature. Since we have a noise level of around 2% (relative to the baseline signal value), we have considered a signal change of at least 10% to extrapolate the lower detection limit.
shaped dependence with the irradiance/power values, with a maxi-mum signal at E𝑒 values of around 60 mWatts · cm-2, which
corre-sponds to P𝐿𝐸𝐷 of 200 W. As discussed in the following lines, this
trend is consistent with the models for the photoactivated response of metal oxides to oxidizing gases reported to date, both qualita-tively10, and quantitatively15.
In the case of NO2, according to the current literature10,35, light
facilitates charge exchanges with the surface of n-type MOXs fol-lowing a process like:
𝑁𝑂2(𝑔𝑎𝑠)+ 𝑒(𝑝ℎ)− → 𝑁𝑂2(𝑎𝑑)−
𝑁𝑂2(𝑎𝑑)− → 𝑁𝑂(𝑔𝑎𝑠)+ 𝑂(𝑎𝑑)−
𝑁𝑂2(𝑎𝑑)− + 𝑒(𝑝ℎ)− → 𝑁𝑂(𝑔𝑎𝑠)+ 𝑂(𝑎𝑑)2−
} (1)
where 𝑒(𝑝ℎ)− indicates a free electron in the semiconductor material,
generated upon photoexcitation. Real sensing is however carried out in the presence of the oxygen background in air, and O2 can
undergo a similar light-induced process36:
𝑂2(𝑔𝑎𝑠)+ 𝑒(𝑝ℎ)− → 𝑂2(𝑎𝑑)− (2)
Both processes end up trapping negative charges at the MOX surfaces around ionized oxygen adsorbates (𝑂(𝑎𝑑)− , 𝑂(𝑎𝑑)2− and
𝑂2(𝑎𝑑)− , among others), which can transit trough different
molecu-lar and oxidation states until equilibrium is reached, if a supply of free electrons is available (like the ones in the conduction band of an n-type MOX):
Figure 2. (a) Resistance record of our ZnO NP sensors built on a LP to increasing concentrations of NO2, operated at an irradiance E𝑒 of 123
mWatts · cm-2. (b) Summary of the responses 𝑆 obtained to NO
2
concentra-tions ranging from 25 ppb to 1 ppm with increasing irradiance/power levels. Bell-shaped solid lines correspond to the fittings to eq.(5). (c) Irradiances E𝑒,𝑀𝐴𝑋 at which the maximum response 𝑆𝑀𝐴𝑋 is reached, as a function of
the NO2 gas concentration. Experimental data follows the linear trend
pre-dicted by the models. Experimental data was taken from the fittings in (b), using eq.(6). Error bars were estimated from the statistical fitting uncertain-ties. Inset shows a semi-log representation of the same dataset. (d) Summary of the response times (defined as the 10% to 90% of the signal rise time) obtained to NO2 concentrations ranging from 25 ppb to 1 ppm as a function
§ Optical power units are indicated as Watts (and not as W), in order
to easily distinguish them from the electrical power.
** We defined the response to gases 𝑆 as the relative resistance
chance in the presence of the target gas, with respect to the value in clean dry SA: 𝑆 =𝑅𝑔𝑎𝑠𝑅−𝑅𝑆𝐴
of the invers irradiance (1 E⁄ 𝑒). Despite the higher levels of uncertainty,
experimental data qualitatively follow the linear trend predicted by eq.(7).
𝑂2(𝑎𝑑)− + 𝑒−↔ 2𝑂(𝑎𝑑)−
𝑂(𝑎𝑑)− + 𝑒−↔ 𝑂(𝑎𝑑)2−
} (3)
Anyhow, both oxidizing species (NO2 and O2) lead to resistance
changes in the same direction: increasing the resistance of an n-type MOX by trapping electrons on the surface.
These light-activated detection processes (adsorption) compete with a light-activated desorption around the oxygen adsorbates re-sulting from both processes, in the form36:
𝑂2(𝑎𝑑)− + ℎ(𝑝ℎ)+ → 𝑂2(𝑔𝑎𝑠) (4)
where ℎ(𝑝ℎ)+ indicates a hole in the valence band, generated by an
impinging photon.
Therefore, under real operating conditions, the detection of NO2
is ruled by the competition between (1) NO2-related oxygen
ad-sorbates, eq.(1), (2) air-related oxygen adad-sorbates, eq.(2), and (3) their final desorption, eq.(4). Thus, light acts as a moderator of the competition between these reaction paths. These mechanisms have quantitatively predicted the responses 𝑆 to different concentrations of nitrogen dioxide [𝑁𝑂2] observed experimentally in n-type
MOXs under different light intensities15.
However, it is only possible to conclude analytic solutions to this model in very simple geometrical configurations (e.g. like one sin-gle monocrystalline nanowire). In our case (a thin film of ZnO nanocrystals) the model becomes mathematically untreatable due to the complexity of the electron transport between adjacent ran-domly-organized crystalline domains. Therefore, we can only ex-pect to fit the dependence of the response 𝑆 under increasing irra-diance E𝑒 levels to a phenomenological bell-shaped trend, that
ac-counts for the counter-balancing of the photoactivated adsorption (that increases with the light intensity, increasing the response) and the photoactivated desorption (that also increases with the light in-tensity, decreasing the response). Figure 2.b also shows the fitting of our experimental data to a log-normal distribution, in the form:
𝑆(E𝑒) ∝ 1
E𝑒𝜎√2𝜋 ∙ 𝑒𝑥𝑝 {−[𝑙𝑛(E𝑒) − 𝜇]
2⁄2𝜎2} (5)
(where µ and stand for the mean and standard deviation of 𝑙𝑛(E𝑒), respectively) observing a good apparent matching (𝑟 >
0.99 in all cases). Such fitting was purely phenomenological, but allowed us to estimate more accurately the irradiance levels E𝑒,𝑀𝐴𝑋
at which photoadsorption and photodesorption optimally compen-sate, leading to a maximum in the response 𝑆𝑀𝐴𝑋, with
E𝑒,𝑀𝐴𝑋= 𝑒𝑥𝑝 {𝜇 − 𝜎2} . (6)
Figure 2.c shows that E𝑒,𝑀𝐴𝑋 increases with the gas
concentra-tion [𝑁𝑂2], following a linear trend (𝑟 = 0.992), as predicted by
the models15. This is a striking difference compared to
convention-ally heated sensors, where the temperature that maximizes the re-sponse is independent of the gas concentration. This is because, the response of light activated devices involves individual energy packages (the photons) triggering adsorption and desorption events of individual molecules. In contrast, thermal activation has to do with the thermal equilibrium conditions at which the sensor mate-rial, as a whole, statistically behaves.
In terms of power consumption, it is remarkable that values as low as 30 W are enough to observe clear responses to ppb con-centrations, with signals well above the noise level. Clearly, slightly higher power values are helpful to develop larger sensor responses (i.e. favoring adsorption processes, eq.(1)), but they still fall in the sub-milliwatt regime (e.g. peak responses 𝑆𝑀𝐴𝑋 observed
between 170 and 300 W for the gas concentrations investigated). Due to the competitive mechanism discussed before, higher light irradiances lead to lower sensor responses (i.e. excessive
desorption, eq.(4)), producing signals below the noise level, and making it pointless to operate the devices at higher power level.
Concerning the dynamic response of the sensors, Figure 2.d sum-marizes the response times 𝑡10%→90% observed for different gas
concentrations [𝑁𝑂2] and under varying irradiance levels E𝑒. In
this case, the response times decrease monotonously with the light intensity15, or in other words,
𝑡10%→90% ∝ 1 E𝑒
. (7)
This is because at higher photon arrival rates, the steady balance between photoadsorption and photodesorption of the different mo-lecular species is reached faster. In Figure 2.d, data points were plotted as a function the invers irradiance 1 E⁄ 𝑒 showing again that
experimental data agrees well with pre-existing models for this kind of MOX sensors15.
It is worth mentioning that our results were obtained with blue light, i.e. with photon energies below the nominal bandgap of ZnO. While this observation is not completely new21, it is still widely
assumed in the literature that electron-hole pair generation by direct bandgap absorption is needed to activate the response to gases of this kind of sensors. The results presented here, however suggest that such assumption might not be necessary, as long as the sensor material offers alternative photogeneration paths (e.g. see Figure 1.e).
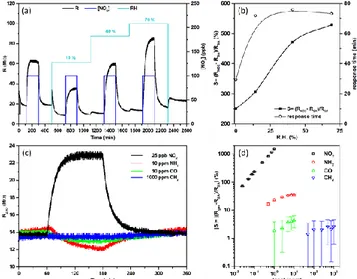
We also studied the response of our devices in the presence of humidity, the most common interfering gas in real applications open to atmospheric air. Figure 3.a shows some examples of the resistance records observed upon exposure to NO2 in different
rel-ative humidity (RH) backgrounds. Clearly, the presence of water interferes with the NO2 sensing mechanism, increasing the
re-sponse 𝑆 (Figure 3.b). This is a common and expected effect in MOX sensors of any kind7, usually attributed to additional reaction
paths at the surface enabled by the presence of water-related OH groups. In this case, however, and in contrast to other MOX sen-sors, humidity leads only to a monotonous rescaling of the sensor signal 𝑆, which could be easily removed with the help of an auxil-iary humidity sensor. Concerning the response time (Figure 3.b), the presence of water slows it down significantly, even at the lowest RH levels investigated (15%). This deceleration effect does not de-velop further at higher RH.
Figure 3: (a) Differences in the resistance record of our ZnO sensors ex-posed to 100 ppb pulses of NO2 under increasing relative humidity (RH)
backgrounds, and (b) summary of the response magnitudes 𝑆 and the sponse times obtained. (c) Exemplary resistance records comparing the re-sponses to NH3, CO and CH4, with that to NO2. Notice that the
concentra-tion of NO2 is much lower than that of the other gases. (d) Full comparison
of the responses 𝑆 obtained to NO2, NH3, CO and CH4 at different
Finally, for completeness, we investigated the response of our sensors to some of the classical gases that are usually monitored with conventional MOX sensors, like NH3, CO and CH4. Figure 3.c
and Figure 3.d show a comparison between the responses observed to these gases and NO2. Concentrations were selected to cover the
relevant range for each of the gases. Remarkably, our illuminated sensors displayed a much higher response to NO2 (well over 100%
for sub-ppm concentrations) than to all those other gases (below 100% for concentrations well above 1 ppm). These relatively smaller responses, even to higher concentrations of reducing gases, are generally observed in photoactivated gas sensors and may open interesting paths for selectivity improvements10.
In conclusion, we have presented a gas sensor capable of (1) operating at room temperature, (2) measuring the concentration of NO2 from a few ppb to ppm (which are record low detection
limit and operation range values for this type of sensor), (3) with a power consumption as low 30 W (again a record value). The sensor was based on the micro light plate (LP) configuration, which offers a direct path for mass production and industrialization, as it is fully based in microelectronic processing. The material used was ZnO nanoparticles, which are today inexpensive and commer-cially available. The responses obtained are well described by the models available in the literature and exhibit interfering effects comparable to those of any other MOX-based sensor that could be compensated with additional sources of information (e.g. humidity sensor). Therefore, this development represents a step ahead to-wards the dream of mass producible, very sensitive, robust and low power gas sensors for NO2, one of the most socially sound urban
pollutants.
AUTHOR INFORMATION
Corresponding Author
Olga Casals, [email protected]
Notes
The authors declare no competing financial interests.
ACKNOWLEDGMENT
This work has been carried out within the EU Project “BetterSense - Nanodevice Engineering for Better Chemical Gas Sensing Tech-nology” funded by European Research Council under grant agree-ment no. 336917 and LENA-OptoSense funded by the Lower Sax-ony Ministry for Science and Culture (N-MWK). O. Casals thanks the support of the TecnioSpring fellowship programme of ACCIÓ, Government of Catalonia, co-funded by the EU Marie Curie Action COFUND. J.D. Prades acknowledges the support of the Serra Húnter Program and the DFG Project GrK NanoMet. This research has made use of the infrastructure of the Spanish ICTS Network MICRONANOFABS partially supported by MINECO.
REFERENCES
(1) Annamalai, K.; Puri, I. K. Combustion Science and Engineering; CRC Press: Boca Raton, 2007.
(2) World Health Organization. Nitrogen Dioxide. In Air Quality
Guidelines for Europe-Second Edition; WHO Regional Office for
Europe: Copenhagen, Denmark, 2000; Vol. 3, pp 175–180. (3) Hossain, M.; Saffell, J.; Baron, R. Differentiating NO 2 and O 3 at
Low Cost Air Quality Amperometric Gas Sensors. ACS Sensors
2016, 1 (11), 1291–1294.
https://doi.org/10.1021/acssensors.6b00603.
(4) Mead, M. I.; Popoola, O. a M.; Stewart, G. B.; Landshoff, P.; Calleja, M.; Hayes, M.; Baldovi, J. J.; McLeod, M. W.; Hodgson, T. F.; Dicks, J.; et al. The Use of Electrochemical Sensors for Monitoring Urban Air Quality in Low-Cost, High-Density Networks. Atmos. Environ. 2013, 70 (2), 186–203. https://doi.org/10.1016/j.atmosenv.2012.11.060.
(5) Cross, E. S.; Williams, L. R.; Lewis, D. K.; Magoon, G. R.; Onasch, T. B.; Kaminsky, M. L.; Worsnop, D. R.; Jayne, J. T. Use of Electrochemical Sensors for Measurement of Air Pollution: Correcting Interference Response and Validating Measurements. Atmos. Meas. Tech. 2017, 10 (9), 3575–3588. https://doi.org/10.5194/amt-10-3575-2017.
(6) Hsu, L.; Ativanichayaphong, T.; Cao, H.; Sin, J.; Graff, M.; Stephanou, H. E.; Chiao, J. ‐C. Evaluation of Commercial Metal‐ oxide Based NO 2 Sensors. Sens. Rev. 2007, 27 (2), 121–131.
https://doi.org/10.1108/02602280710731687.
(7) Kumar, R.; Al-Dossary, O.; Kumar, G.; Umar, A. Zinc Oxide Nanostructures for NO2 Gas–sensor Applications: A Review.
Nano-Micro Lett. 2014, 7 (2), 1–24. https://doi.org/10.1007/s40820-014-0023-3.
(8) Comini, E.; Cristalli, A.; Faglia, G.; Sberveglieri, G. Light Enhanced Gas Sensing Properties of Indium Oxide and Tin Dioxide Sensors. Sensors Actuators, B Chem. 2000, 65 (1), 260– 263. https://doi.org/10.1016/S0925-4005(99)00350-0.
(9) Comini, E.; Faglia, G.; Sberveglieri, G. UV Light Activation of Tin Oxide Thin Films for NO2 Sensing at Low Temperatures.
Sensors Actuators, B Chem. 2001, 78 (1–3), 73–77.
https://doi.org/10.1016/S0925-4005(01)00796-1.
(10) Espid, E.; Taghipour, F. UV-LED Photo-Activated Chemical Gas Sensors: A Review. Crit. Rev. Solid State Mater. Sci. 2017, 42 (5), 416–432. https://doi.org/10.1080/10408436.2016.1226161. (11) Kumar, R.; Goel, N.; Kumar, M. UV-Activated MoS2 Based Fast
and Reversible NO2 Sensor at Room Temperature. ACS Sensors
2017, 2 (11), 1744–1752.
https://doi.org/10.1021/acssensors.7b00731.
(12) Kumar, M. M.; Agrawal, A. V.; Kumar, R.; Venkatesan, S.; Zakhidov, A.; Yang, G.; Bao, J.; Kumar, M. M. Photoactivated Mixed In-Plane and Edge-Enriched p-Type MoS2 Flake-Based NO2 Sensor Working at Room Temperature. ACS Sensors 2018,
3 (5), 998–1004. https://doi.org/10.1021/acssensors.8b00146.
(13) Prades, J. D.; Jimenez-Diaz, R.; Hernandez-Ramirez, F.; Barth, S.; Cirera, a.; Romano-Rodriguez, a.; Mathur, S.; Morante, J. R. Equivalence between Thermal and Room Temperature UV Light-Modulated Responses of Gas Sensors Based on Individual SnO2 Nanowires. Sensors Actuators B Chem. 2009, 140 (2), 337–341. https://doi.org/10.1016/j.snb.2009.04.070.
(14) Anothainart, K.; Burgmair, M.; Karthigeyan, A.; Zimmer, M.; Eisele, I. Light Enhanced NO2 Gas Sensing with Tin Oxide at Room Temperature: Conductance and Work Function Measurements. Sensors Actuators B Chem. 2003, 93 (1–3), 580– 584. https://doi.org/10.1016/S0925-4005(03)00220-X. (15) Prades, J. D.; Jimenez-Diaz, R.; Manzanares, M.;
Hernandez-Ramirez, F.; Cirera, A.; Romano-Rodriguez, A.; Mathur, S.; Morante, J. R. A Model for the Response towards Oxidizing Gases of Photoactivated Sensors Based on Individual SnO2 Nanowires. Phys. Chem. Chem. Phys. 2009, 11 (46), 10881– 10889. https://doi.org/10.1039/b915646a.
(16) Lu, G.; Xu, J.; Sun, J.; Yu, Y.; Zhang, Y.; Liu, F. UV-Enhanced Room Temperature NO2 Sensor Using ZnO Nanorods Modified with SnO2 Nanoparticles. Sensors Actuators, B Chem. 2012, 162 (1), 82–88. https://doi.org/10.1016/j.snb.2011.12.039.
(17) Wagner, T.; Kohl, C. D.; Morandi, S.; Malagú, C.; Donato, N.; Latino, M.; Neri, G.; Tiemann, M. Photoreduction of Mesoporous In2O3: Mechanistic Model and Utility in Gas Sensing. Chem. - A
Eur. J. 2012, 18 (26), 8216–8223. https://doi.org/10.1002/chem.201103905.
(18) Wagner, T.; Kohl, C. D.; Malagù, C.; Donato, N.; Latino, M.; Neri, G.; Tiemann, M. UV Light-Enhanced NO2 Sensing by Mesoporous In2O3: Interpretation of Results by a New Sensing Model. Sensors Actuators, B Chem. 2013, 187 (2), 488–494. https://doi.org/10.1016/j.snb.2013.02.025.
(19) Park, S.; An, S.; Mun, Y.; Lee, C. UV-Enhanced NO2 Gas Sensing Properties of SnO2-Core/ZnO-Shell Nanowires at Room Temperature. ACS Appl. Mater. Interfaces 2013, 5 (10), 4285– 4292. https://doi.org/10.1021/am400500a.
(20) Mun, Y.; Park, S.; An, S.; Lee, C.; Kim, H. W. NO2 Gas Sensing Properties of Au-Functionalized Porous ZnO Nanosheets Enhanced by UV Irradiation. Ceram. Int. 2013, 39 (8), 8615– 8622. https://doi.org/10.1016/j.ceramint.2013.04.035.
(21) Zhang, C.; Boudiba, A.; De Marco, P.; Snyders, R.; Olivier, M. G.; Debliquy, M. Room Temperature Responses of Visible-Light
Illuminated WO3 Sensors to NO2 in Sub-Ppm Range. Sensors
Actuators, B Chem. 2013, 181, 395–401. https://doi.org/10.1016/j.snb.2013.01.082.
(22) Park, S.; Ko, H.; Lee, S.; Kim, H.; Lee, C. Light-Activated Gas Sensing of Bi2O3-Core/ZnO-Shell Nanobelt Gas Sensors. Thin
Solid Films 2014, 570 (PB), 298–302. https://doi.org/10.1016/j.tsf.2014.02.110.
(23) Hoffmann, M. W. G.; Prades, J. D.; Mayrhofer, L.; Hernandez-Ramirez, F.; Järvi, T. T.; Moseler, M.; Waag, A.; Shen, H. Highly Selective SAM-Nanowire Hybrid NO2 Sensor: Insight into Charge Transfer Dynamics and Alignment of Frontier Molecular Orbitals. Adv. Funct. Mater. 2014, 24 (5), 595–602. https://doi.org/10.1002/adfm.201301478.
(24) Hoffmann, M. W. G.; Mayrhofer, L.; Casals, O.; Caccamo, L.; Hernandez-Ramirez, F.; Lilienkamp, G.; Daum, W.; Moseler, M.; Waag, A.; Shen, H.; et al. A Highly Selective and Self-Powered Gas Sensor Via Organic Surface Functionalization of p-Si/n-ZnO Diodes. Adv. Mater. 2014, 26 (47), 8017–8022. https://doi.org/10.1002/adma.201403073.
(25) Fabbri, B.; Gaiardo, A.; Giberti, A.; Guidi, V.; Malagù, C.; Martucci, A.; Sturaro, M.; Zonta, G.; Gherardi, S.; Bernardoni, P. Chemoresistive Properties of Photo-Activated Thin and Thick ZnO Films. Sensors Actuators, B Chem. 2014, 222, 1251–1256. https://doi.org/10.1016/j.snb.2015.06.048.
(26) Saboor, F. H.; Ueda, T.; Kamada, K.; Hyodo, T.; Mortazavi, Y.; Khodadadi, A. A.; Shimizu, Y. Enhanced NO2 Gas Sensing Performance of Bare and Pd-Loaded SnO2 Thick Film Sensors under UV-Light Irradiation at Room Temperature. Sensors
Actuators, B Chem. 2016, 223 (2), 429–439. https://doi.org/10.1016/j.snb.2015.09.075.
(27) Hyodo, T.; Urata, K.; Kamada, K.; Ueda, T.; Shimizu, Y. Semiconductor-Type SnO2-Based NO2 Sensors Operated at Room Temperature under UV-Light Irradiation. Sensors
Actuators, B Chem. 2017, 253 (2), 630–640. https://doi.org/10.1016/j.snb.2017.06.155.
(28) Espid, E.; Taghipour, F. Development of Highly Sensitive ZnO/In2O3 Composite Gas Sensor Activated by UV-LED.
Sensors Actuators, B Chem. 2017, 241, 828–839. https://doi.org/10.1016/j.snb.2016.10.129.
(29) Espid, E.; Taghipour, F. Facile Synthesis and UV-Activated Gas Sensing Performance of Ag:ZnO Nano-Ellipsoids. ECS J. Solid
State Sci. Technol. 2018, 7 (7), Q3089–Q3093. https://doi.org/10.1149/2.0141807jss.
(30) Markiewicz, N.; Casals, O.; Fabrega, C.; Gràcia, I.; Cané, C.; Suryo, H.; Waag, A.; Prades, J. D. Micro Light Plates for Low-Power Photoactivated Gas Sensors. Appl. Phys. Lett. 2019, 114, 053508. https://doi.org/10.1063/1.5078497.
(31) Zhang, Q.; Park, K.; Cao, G. Synthesis of ZnO Aggregates and Their Application in Dye-Sensitized Solar Cells. Mater. Matters
2010, 5 (2), 32–40.
(32) Rossi, T.; Penfold, T. J.; Rittmann-Frank, M. H.; Reinhard, M.; Rittmann, J.; Borca, C. N.; Grolimund, D.; Milne, C. J.; Chergui, M. Characterizing the Structure and Defect Concentration of ZnO Nanoparticles in a Colloidal Solution. J. Phys. Chem. C 2014, 118 (33), 19422–19430. https://doi.org/10.1021/jp505559u. (33) Casals, O.; Becker, T.; Godignon, P.; Romano-Rodriguez, A.
SiC-Based MIS Gas Sensor for High Water Vapor Environments.
Sensors Actuators, B Chem. 2012, 175, 60–66. https://doi.org/10.1016/j.snb.2011.12.032.
(34) Karpov, S. ABC-Model for Interpretation of Internal Quantum Efficiency and Its Droop in III-Nitride LEDs: A Review. Opt.
Quantum Electron. 2015, 47 (6), 1293–1303. https://doi.org/10.1007/s11082-014-0042-9.
(35) Karaduman, I.; Yildiz, D. E.; Sincar, M. M.; Acar, S. UV Light Activated Gas Sensor for NO2 Detection. Mater. Sci. Semicond.
Process. 2014, 28 (2), 43–47.
https://doi.org/10.1016/j.mssp.2014.04.011.
(36) Fan, S. W.; Srivastava, A. K.; Dravid, V. P. UV-Activated Room-Temperature Gas Sensing Mechanism of Polycrystalline ZnO.
Appl. Phys. Lett. 2009, 95 (14), 1–4. https://doi.org/10.1063/1.3243458.