Università degli studi ROMA TRE
Dottorato di ricerca in Scienze dell’Ingegneria Civile
XX Ciclo
Tesi di Dottorato
Implementation and experimental verification of
models for nonlinear analysis of masonry infilled
r.c. frames
Dottorando: Alessandro Vittorio Bergami Docente guida: Prof. Camillo Nuti
Coordinatore del dottorato: Prof. Leopoldo Franco
Collana delle tesi di Dottorato di Ricerca In Scienze dell’Ingegneria Civile
Università degli Studi Roma Tre Tesi n° 17
Sommario
L’influenza della tamponatura sulla risposta strutturale di telai tamponati sottoposti ad azione sismica è stata largamente indagata attraverso numerose campagne sperimentali e lo studio di molteplici modelli analitici.
In questo lavoro, con rifermento a strutture e materiali largamente diffusi in Italia, sono discussi i risultati di prove sperimentali condotte, presso il
Laboratorio di sperimentazione su materiali e strutture dell’Università
degli Studi Roma Tre, su laterizi, malta, muri singoli ed accoppiati e su portali in cemento armato nudi e tamponati. Parallelamente all’attività sperimentale sono stati implementati modelli numerici a fibre, rappresentativi delle strutture studiate, avvalendosi di modelli a singola e tripla biella per i pannelli di tamponatura. L’accuratezza dei risultati numerici è stata valutata attraverso il confronto con i risultati sperimentali ottenuti dalle prove cicliche condotte sui portali in c.a.
L’analisi numerica è stata estesa a telai più complessi aventi differenti distribuzioni di tamponatura.
Abstract
The effects of infill panels on the response of r.c. frames subjected to seismic action are widely recognised and numerous experimental investigations as well as several analytical models have been developed on this subject. In this work, referring to specific materials and structures commonly used in Italy, experimental tests performed at the Laboratory
of experiments on materials and structures of the University Roma Tre on
bricks, single and double masonry infills, walls and finally on bare and infilled r.c. portals, are described and discussed. Together with the experimental activity, the implementation of non linear fiber models representative of the considered structures by means of single and triple strut nonlinear cyclic models for masonry panels is described. The accuracy of the models has been assessed through comparison with experimental results obtained form cyclic tests of frames. The numerical model has been extended to multy-storey r.c. frames with different infill configurations.
Contents
FIGURES INDEX ... 5
TABLES INDEX ... 14
1. INTRODUCTION ... 17
1.1AIMS OF THE STUDY ... 18
1.2THESIS LAYOUT ... 19
2. EXPERIMENTAL CHARACTERIZATION OF INFILLS ... 20
2.1INTRODUCTION... 20
2.2MATERIALS SELECTION AND SAMPLES PREPARATION ... 20
2.3EXPERIMENTAL TESTS ON MORTAR ... 24
2.3.1 Experimental tests on type 1 mortar ... 24
2.3.2 Experimental tests on type 2 mortar ... 28
2.4EXPERIMENTAL TESTS ON BRICKS ... 31
2.4.1 Compression tests on hollow bricks ... 31
2.4.2 Compression tests on half-full bricks ... 34
2.5EXPERIMENTAL TESTS ON WALLS ... 38
2.6EXPERIMENTAL TEST RESULTS ON HOLLOW BRICK AND TYPE 1 MORTAR WALLS .. 51
2.7EXPERIMENTAL TEST RESULTS ON HALF-FULL BRICKS AND TYPE 1 MORTAR WALLS ... 60
2.8EXPERIMENTAL TESTS RESULTS ON WALLS OF HALF-FULL BRICKS AND TYPE 2 MORTAR ... 69
2.9INFLUENCE OF MORTAR ON EXPERIMENTAL RESULTS ... 78
2.10CORRELATION BETWEEN MATERIALS AND WALLS’ STRENGTH ... 79
2.11EXPERIMENTAL TESTS RESULTS OF DOUBLE PANEL WALLS ... 88
3. EXPERIMENTAL TESTS ON PORTAL’S MATERIALS ... 94
3.1INTRODUCTION... 94
3.2EXPERIMENTAL TESTS ON REINFORCING BARS ... 94
3.3EXPERIMENTAL TESTS ON CONCRETE ... 98
3.4.1 Non-destructive tests ... 100
3.4.2 Destructive tests ... 102
4. EXPERIMENTAL MODELS ... 103
4.1INTRODUCTION... 103
4.2DESCRIPTION OF THE SAMPLES ... 103
4.3DESCRIPTION OF OPENSEES ... 109
4.4DESCRIPTION OF THE NUMERICAL MODEL ... 110
5. GLOBAL MODELS OF INFILLED R.C. FRAMES ... 118
5.1INTRODUCTION... 118
5.2STRUCTURAL RESPONSE OF INFILLED FRAMES ... 118
5.3SINGLE STRUT MODEL ... 120
5.4INFILL CONSTITUTIVE MATERIAL MODEL ... 122
5.4.1 Determineation of the single strut dimension ... 124
5.5TRIPLE STRUT MODEL ... 126
5.5.1 Determineation of the triple strut geometry ... 127
6. ANALYSES RESULTS FOR THE PORTAL MODEL ... 131
6.1INTRODUCTION... 131
6.2NUMERICAL MODEL OF THE PORTAL WITH SINGLE STRUT ... 131
6.3ANALYSES RESULTS FOR THE PORTAL WITH THE TRIPLE STRUT MODEL ... 141
7. EXPERIMENTAL TESTS ON PORTALS ... 148
7.1INTRODUCTION... 148
7.2EXPERIMENTAL EQUIPMENT ... 148
7.3EXPERIMENTAL TESTS ON THE BARE PORTAL FN1 ... 158
7.4EXPERIMENTAL TESTS ON THE INFILLED PORTAL FT1 AND FT2 ... 167
7.4.1 Experimental test on the portal Ft1 ... 167
7.4.2 Experimental test on the portal Ft2 ... 172
7.4.3 Behaviour mode observed ... 176
7.5EXPERIMENTAL DETERMINATION OF THE EQUIVALENT STRUT ... 177
7.6COMPARISON OF THE EXPERIMENTAL AND NUMERICAL RESULTS ... 183
8. ANALYSES RESULTS FOR THE 1:1 SCALED FRAMES ... 187
8.1INTRODUCTION... 187
8.2NUMERICAL MODELS AND ANALYSES RESULTS ... 187
9. CONCLUSIONS ... 203
9.1FUTURE DEVELOPMENTS ... 205
Figures index
Figure 2.1: hollow bricks 8x16x33cm3……….27
Figure 2. 2: half-full bricks 12x12x25 cm3………...21
Figure 2.3: types of infill walls: a) walls with double panel with air space b) plain wall 21 Figure 2.4: MTS press………..29
Figure 2.5: Metrocom press………..23
Figure 2.6: characteristics of the system for compression tests on bricks ... 23
Figure 2.7: bending test on mortar [mm] ... 24
Figure 2.8: bending tests on mortar samples ... 25
Figure 2.9: type 1 mortar bending tests, load-deformation ... 26
Figure 2.10: Compression tests on mortar cylinders ... 27
Figure 2.11: type 1 mortar stress–strain curve ... 28
Figure 2.12: type 2 mortar bending tests, load-deformation ... 30
Figure 2.13: type 2 mortar stress–strain curve ... 30
Figure 2.14: hollow bricks compression tests, compression orthogonal to holes (left); compression parallel to holes (right) ... 31
Figure 2.15: failure of a hollow bricks sample compression orthogonal to holes (left); compression parallel to holes (right) ... 31
Figure 2.16: hollow bricks stress-strain curve, compression tests orthogonal to holes ... 32
Figure 2.17: hollow bricks load-deformation curve, compression tests orthogonal to holes ... 32
Figure 2.18: hollow bricks stress-strain curve, compression tests parallel to holes ... 33
Figure 2.19: hollow bricks load-deformation curve, compression tests parallel to holes 33 Figure 2.20: half-full bricks compression tests, compression parallel to holes (left); compression orthogonal to holes (right) ... 35
Figure 2.21: failure of a sample of half-full bricks, compression parallel to holes (right) and orthogonal holes (left) ... 35
Figure 2.22: half-full bricks stress-strain curve, compression tests parallel to holes ... 36
Figure 2.23: half-full bricks load-displacement curve, compression tests parallel to holes ... 36 Figure 2.24: half-full bricks stress-strain curve, compression tests orthogonal to holes . 37
Figure 2.25: half-full bricks load-displacement curve, compression tests parallel to
holes ... 37
Figure 2.26: walls specimens, walls of half-full bricks (left), walls of hollow bricks (right) ... 39
Figure 2.27: double panel walls, specimens ready to be tested (left), side view of double panel wall (right) ... 39
Figure 2.28: steel profile used to transfer the compression load on walls... 40
Figure 2.29: steel saddle used to settle diagonally the walls ... 40
Figure 2.30: vertical compression test, layout of test systems ... 41
Figure 2.31: diagonal compression test, layout of test system ... 41
Figure 2.32: equipment set up for vertical compression tests: the steel profiles fitted on the Metrocom 3000 kN press (left), a wall ready to be crashed inside the press (right) . 42 Figure 2.33: diagonal compression tests set up, steel supports for diagonal compression tests (left), wall ready to be crashed inside the press (right) ... 42
Figure 2.34: suspension system of the upper steel profile ... 42
Figure 2.35: transducer adopted to measuring deformations (left), the external transducer installed (right) ... 43
Figure 2.36: hollow brick panels layout of sensors on the wall compressed parallel to holes [mm] ... 44
Figure 2.37: hollow brick panels layout of sensors on the wall compressed orthogonally to holes [mm] ... 44
Figure 2.38: hollow brick panels layout of sensors on the wall compressed diagonally [mm] ... 44
Figure 2.39: half-full brick panels layout of sensors on the wall compressed parallel to holes [mm] ... 45
Figure 2.40: half-full brick panels layout of sensors on the wall compressed orthogonally to holes [mm] ... 45
Figure 2.41: half-full brick panels layout of sensors on the wall compressed diagonally [mm] ... 45
Figure 2.42: double panel walls layout of sensors on the wall compressed parallel to holes [mm] ... 46
Figure 2.43: double panel walls layout of sensors on the wall compressed orthogonally to holes [mm] ... 46
Figure 2.44: double panel walls layout of sensors on the wall compressed diagonally [mm] ... 46
Figure 2.45: equipment for compression test parallel to holes on hollow brick walls (front and back view of the panel) ... 47
Figure 2.46: equipment for compression test orthogonal to holes on hollow brick walls
(front and back view of the panel) ... 47
Figure 2.47: equipment for diagonal on hollow brick walls (front and back view of the panel) ... 47
Figure 2.48: equipment for compression test parallel to holes on half-full brick walls (front and back view of the panel) ... 48
Figure 2.49: equipment for compression test orthogonal to holes on half-full brick walls (front and back view of the panel) ... 48
Figure 2.50: equipment for diagonal compression test half-full brick walls (front and back view of the panel) ... 48
Figure 2.51: equipment for vertical compression on double panel walls (front and back view of the panel)... 49
Figure 2.52: equipment for horizontal compression on double panel walls (front and back view of the panel) ... 49
Figure 2.53 equipment for diagonal compression on double panel walls (front and back view of the panel)... 49
Figure 2.54: compression test parallel to holes, initial phase and collapse ... 52
Figure 2.55: compression test orthogonal to hole, initial phase and collapse ... 52
Figure 2.56: diagonal compression test, front and side collapse view ... 52
Figure 2.57: compression tests parallel to holes, load-displacement curves of walls of hollow brick and type 1 mortar ... 53
Figure 2.58: compression tests parallel to holes, stress-strain curves of walls of hollow brick and type 1 mortar ... 53
Figure 2.59: compression tests orthogonal to holes, load-displacement curves of walls of hollow brick and type 1 mortar ... 54
Figure 2.60: compression tests orthogonal to holes, stress-strain curves of walls of hollow brick and type 1 mortar ... 54
Figure 2.61: diagonal compression tests, load-displacement curves of walls of hollow brick and type 1 mortar ... 55
Figure 2.62: diagonal compression tests, stress-strain curves of walls of hollow brick and type 1 mortar ... 55
Figure 2.63: comparison between average elastic modulus determined from internal or external transducers [MPa] ... 58
Figure 2.64: comparison between maximum strains determined from internal or external transducers [-] ... 58
Figure 2.66: compression test orthogonal to holes, initial phase and collapse ... 61 Figure 2.67: diagonal compression test, initial phase and collapse ... 61 Figure 2.68: compression tests parallel to holes, load-displacement curves of walls of half-full bricks and type 1 mortar ... 62 Figure 2.69:: compression tests parallel to holes, stress-strain curves of walls of half-full bricks and type 1 mortar ... 62 Figure 2.70: compression tests orthogonal to holes, load-displacement curves of walls of half-full bricks and type 1 mortar ... 63 Figure 2.72: diagonal compression tests, load-displacement curves of walls of half-full bricks and type 1 mortar ... 64 Figure 2.74: comparison between average elastic modulus determined from internal or external transducers [MPa] ... 66 Figure 2.75: comparison between maximum strains determined from internal or external transducers [-] ... 67 Figure 2.76: compression tests parallel to holes, load-displacement curves of walls of half-full bricks and type 2 mortar ... 69 Figure 2.78: compression tests othogonal to holes, load-displacement curves of walls of half-full bricks and type 2 mortar ... 70 Figure 2.79: compression tests orthogonal to holes, stress-strain curves of walls of half-full bricks and type 2 ... 71 Figure 2.80: diagonal compression tests, load-displacement curves of walls of half-full bricks and type 2 ... 71 Figure 2.80: diagonal compression tests, stress-strain curves of walls of half-full bricks and type 2 mortar ... 72 Figure 2.82: stress–strain curves (internal transducer) from compression tests parallel to holes ... 74 Figure 2.83: stress–strain curves (internal transducer) from compression tests orthogonal to holes ... 74 Figure 2.83 stress–strain curves (internal transducer) from diagonal compression tests 75 Figure 2.84: comparison between maximum loads of walls with different mortar ... 78 Figure 2.85: comparison between theoretical and experimental strength walls of hollow bricks and type 1 mortar ... 82 Figure 2.86: comparison between theoretical and experimental strength of walls of half-full bricks and type 1 mortar ... 82 Figure 2.87: comparison between theoretical and experimental strength of walls of half-full bricks and type 2 mortar ... 83
Figure 2.88: comparison between experimental strength of walls as a percentage of
bricks strength ... 84
Figure 2.89: comparison between experimental strength of walls as a percentage of type 1 mortar strength ... 85
Figure 2.90: comparison between experimental strength of half-full bricks walls as a percentage of bricks strength ... 85
Figure 2.91: comparison between experimental strength of walls as a percentage of mortar’s strength ... 86
Figure 2.92: comparison between experimental and theoretical orthogonal to holes strength,of walls built using half-full bricks with type 1 and type 2 mortar ... 86
Figure 2.93: comparison between experimental and theoretical parallel to holes strength of walls built using half-full bricks with type 1 and type 2 mortar ... 87
Figure 2.94: compression test parallel to holes, initial phase and collapse ... 89
Figure 2.95: compression test orthogonal to the holes: initial phase and collapse ... 89
Figure 2.96: diagonal compression test, front and side view of collapse ... 89
Figure 2.97: load–displacement curves from parallel to holes compression tests of double panel walls ... 90
Figure 2.98: stress–strain curves from parallel to holes compression tests of double panel walls ... 90
Figure 2.99: load–displacement curves from orthogonal to holes compression tests of double panel walls ... 91
Figure 2.101: load–displacement curves from diagonal compression tests of double panel walls ... 92
Figure 2.102: stres –strain curves from diagonal compression tests of double panel walls ... 92
Figure 3.1: sclerometric test (left) and ultrasonic test (right) on a column of the portal . 99 Figure 4.1: carpentry and rebar of the r.c. portal ... 105
Figure 4.2: rebar of the r.c. portal ... 106
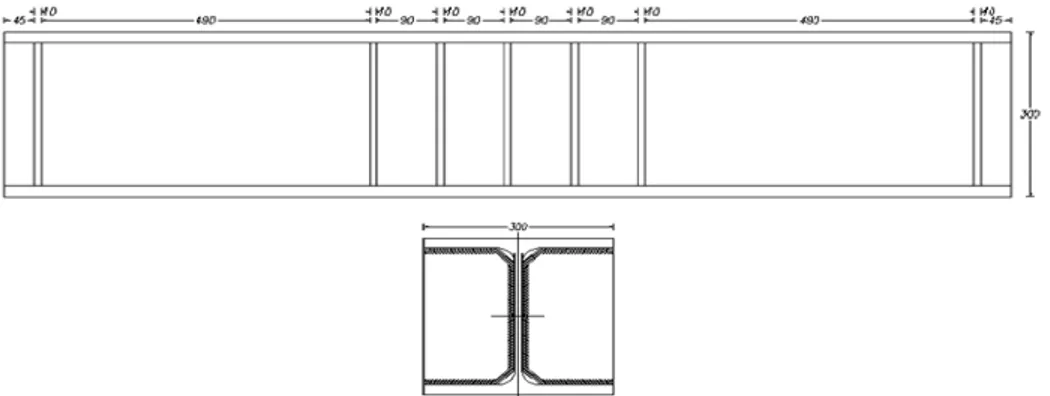
Figure 4.3: plans of the building that the frame examined belongs to (scale ratio 1:1, length in [cm], the frame is highlighted) ... 108
Figure 4.4: the frame analyzed (scale ratio 1:1), the position of the portal (realized in reduced scale ratio) is highlighted [cm] ... 108
Figure 4.5: characteristics of the portal frame ... 109
Figure 4.6: fibre-based model ... 110
Figure 4.8: analytical response for cycling load of concrete ... 113
Figure 4.9: OpenSees CONCRETE02 response for cycling load (unconfined concrete) ... 113
Figure 4.10: OpenSees CONCRETE02 response to cycling load (column confined concrete)... 114
Figure 4.11: OpenSees CONCRETE02 response to cycling load (beam confined concrete)... 114
Figure 4.12: OpenSees model of the portal ... 115
Figure 4.13: curvature–moment relationship of portal’s sections ... 115
Figure 4.13: resistant sections of beams 50x20 cm (top) and columns 40x20 cm (bottom) of the frame (scale ratio 1:1) [cm] ... 116
Figure 4.14: curvature–moment relationship of frame’s beams ... 117
Figure 4.15: curvature–moment relationship of frame’s columns ... 117
Figure 5.1: shelf consisting of frame and infill ... 119
Figure 5.2: stiffness of the bare frame and the diagonal strut in parallel ... 120
Figure 5.3: strut model proposed by (Camberscue 1996) ... 122
Figure 5.4: triple strut models with different distributions of contact stress between the infill and frame ... 128
Figure 5.5: loads and stress components of the model ... 128
Figure 6.1: geometry of the infilled portal (width: r.c. elements=200 mm; wall=120 mm) [mm] ... 132
Figure 6.2: position of the equivalent strut ... 132
Figure 6.3: the Hysteretic Material ... 134
Figure 6.4: axial load–axial deformation of the single strut initially defined ... 134
Figure 6.5: axial load-deformation of the calibrated single strut model ... 135
Figure 6.6: comparison between the model initially defined (initial) and the experimental one (calibrated) ... 135
Figure 6.8: bare and infilled portal: base shear – top displacement ... 137
Figure 6.9: localization of plastic hinges on the capacity curve of the bare (top) and infilled portal with single strut model (bottom) ... 138
Figure 6.10: bare (left) and infilled (right) portal: localisation of plastic hinges ... 139
Figure 6.13: geometry of the triple strut ... 142
Figure 6.14: implemented triple strut model [mm] ... 142
Figure 6.16: base shear–top displacement of the portal with triple strut ... 144
Figure 6.17: comparison between capacity curve of the infilled portal models ... 145
Figure 6.18: localization of plastic hinges on the capacity curve of the infilled portal with triple strut model ... 145
Figure 6.19: infilled portal with triple strut model, localisation of plastic hinges ... 146
Figure 6.20: shear acting on column 1 ... 147
Figure 6.21: shear acting on column 2 ... 147
Figure 7.1: layout of the test system developed ... 149
Figure 7.2: the test system set-up on the portal Fn1 ... 149
Figure 7.3: details of the jack Mh installed on the contrast wall (top) and on the portal (bottom) ... 150
Figure 7.4:structure designed to apply the gravity load on columns ... 151
Figure 7.5: basement fixing system ... 151
Figure 7.6: instrumentation of the bare portal ... 153
Figure 7.7: instrumentation of the infilled portal, side 1 and side 2. ... 154
Figure 7.8: set-up of the experimental test on the bare portal ... 155
Figure 7.9: the bare portal ready to be tested ... 155
Figure 7.10: portal instrumentation’s details... 156
Figure 7.11: instrumentation of the infilled portal, side 1 ... 156
Figure 7.12: instrumentation of the infilled portal, side 2 ... 157
Figure 7.13: loading cell inserted under the hydraulic jack ... 157
Figure 7.14: portal Fn1, damage to the base of the columns (top displacement of 30 mm) ... 159
Figure 7.15: portal Fn1, damage to the top of the columns (collapse) ... 160
Figure 7.16: portal Fn1, cracks map ... 160
Figure 7.17: portal Fn1, excursion of the jack Mh – load applied by the jack Mh ... 161
Figure 7.18: portal Fn1, top displacement–horizontal load ... 162
Figure 7.19: portal Fn1, envelope of the test performed ... 162
Figure 7.20: column lower section, curvature-moment ... 164
Figure 7.21: column lower section, curvature-horizontal load ... 165
Figure 7.23: column sections, curvature-horizontal load ... 167
Figure 7.24: portal Ft1,superficial cracks along columns height ... 169
Figure 7.25: portal Ft1, infill damages during the experimental test (close to maximum load) ... 169
Figure 7.25: portal Ft1, infill damages during the experimental test (in correspondence with the maximum load) ... 170
Figure 7.27: portal Ft1, infill damages during the experimental test (after having achieved maximum load) ... 170
Figure 7.28: portal frame Ft1, detail of the structure following collapse ... 171
Figure 7.29: portal Ft1, top displacement–horizontal load ... 171
Figure 7.30: portal frame Ft1, infill damages during the experimental test (after having achieved maximum load) ... 173
Figure 7.31: portal Ft2, top displacement–horizontal load ... 173
Figure 7.31: column lower section, curvature-horizontal load ... 174
Figure 7.32: column upper section, curvature-horizontal load ... 174
Figure 7.33: column upper and lower sections, curvature-horizontal load ... 175
Figure 7.34: diagonal deformation, deformation-horizontal load ... 175
(transducer 41) ... 175
Figure 7.34: -drift between the panel and the beam-load ... 176
(transducer 33) ... 176
Figure 7.34: characteristics of the equivalent strut determined as the difference between the capacity curves of the portal Fn1 and Ft2 ... 178
Figure 7.35: experimental results Vs calibrated model (implemented in the numerical model) of the diagonal strut, axial load –deformation ... 180
Figure 7.36: experimental stress strain relationship of the strut ... 180
Figure 7.37: theoretical Vs calibrated models of the diagonal strut, axial load-deformation ... 181
Figure 7.38: experimental and numerical capacity curves of the bare portal ... 183
Figure 7.39: experimental and numerical cyclic analysis of the bare portal ... 184
Figure 7.40: experimental and numerical cyclic analysis of the infilled portal... 184
Figure 7.41: experimental and numerical capacity curves of the infilled portal ... 185
Figure 8.1: geometry of the r.c. frame, scale ratio 1:1 [cm] ... 188
Figure 8.3: frame Fb (left) and Fi,1 (right) ... 190
Figure 8.4: frame Fi,2 (left) and Fi,3 (right) ... 190
Figure 8.5: distribution of the horizontal loads adopted (proportional to the first modal form) ... 191
Figure 8.6: capacity curves of the frames analysed... 191
Figure 8.7: horizontal displacements of each level (up) interstorey drift of the bare frame (down) ... 194
Figure 8.8: horizontal displacements of each level (up) interstorey drift of the frame type 1(down) ... 195
Figure 8.9: horizontal displacements of each level (up) interstorey drift of the frame type 2 (down) ... 196
Figure 8.10: horizontal displacements of each level (up) interstorey drift of the frame type 3 (down) ... 197
Figure 8.11: capacity curve and plastic hinges of the bare frame ... 198
Figure 8.12: capacity curve and plastic hinges of the frame type 2 ... 198
Figure 8.13: plastic hinges on the bare (left) and type 1(right) frame ... 199
Figure 8.15: triple strut model (frame scale ratio 1:1) ... 201
Figure 8.16: geometry of the triple strut model (frame scale ratio 1:1) ... 201
Figure 8.17: comparison between the capacity curves determined with the triple strut and the single strut models for the frame type 1 ... 202
Tables index
Table 2.1: type 1 mortar traction strength ... 26
Table 2.2: type 1 mortar compression tests results ... 28
Table 2.3: type 2 mortar compression tests results ... 29
Table 2.4: type 2 mortar traction strength ... 31
Table 2.5: compression tests on hollow bricks: summary of results (fc,p=compression strength parallel to holes; fc,o=compression strength orthogonal to holes) ... 34
Table 2.6: compression tests on half-full bricks: summary of results (fc,p=compression strength parallel to holes; fc,o=compression strength orthogonal to holes) ... 38
Table 2.7: results of compression tests parallel to holes on hollow bricks walls ... 56
Table 2.8: results of compression tests orthogonal to holes on hollow brick walls ... 57
Table 2.9: results of diagonal compression tests on hollow brick walls ... 57
Table 2.10: elastic modulus determined from internal transducers ... 57
Table 2.11: characterization of infill wall of hollow bricks type 1 mortar ... 59
Table 2.13: results of compression tests parallel to holes on half-full brick walls ... 65
Table 2.14: results of compression tests orthogonal to holes on half-full brick walls .... 65
Table 2.15: results of diagonal compression tests on half-full brick walls ... 65
Table 2.16: elastic modulus determined from internal transducers ... 66
Table 2.17: characterisation of infill wall of half-full and type 1 mortar ... 68
Table 2.18: results from compression parallel to holes on walls of half-full bricks and type 2 mortar ... 72
Table 2.19: results from compression orthogonal to holes on walls of half-full bricks and type 2 mortar ... 73
Table 2.20: results from diagonal compression on walls of half-full bricks and type 2 mortar ... 73
Table 2.21: elastic modulus from internal transducers ... 75
Table 2.22: strains from internal transducers ... 76
Table 2.23: summary of data for diagonal compression ... 76
Table 2.24: summary of data from external and internal transducers ... 76
Table 2.25: characterisation of infill wall of half-full bricks and type 2 mortar ... 77
Table 2.26: characteristics of type 1 and type 2 mortar ... 78
Table 2.28: average strength of walls of hollow bricks and type 1 mortar
(the characteristic values are expressed in brackets) ... 80
Table 2.29: average strength of walls of half-full bricks and type 1 mortar (the characteristic values are expressed in brackets) ... 81
Table 2.30: average strength of walls of walls of half-full bricks made from type 1 mortar (the characteristic values are expressed in brackets) ... 81
Table 2.31: results of compression tests on double panel walls ... 93
Table 3.1: weight, length and equivalent diameter of samples ... 95
Table 3.2: mechanical parameters from traction tests (part A) ... 96
Table 3.3: mechanical parameters from traction tests (part B) ... 97
Table 3.4: mechanical parameter from traction tests (part C) ... 98
Table 3.5: sclerometric test on portal 1 ... 100
Table 3.6: sclerometric test on portal 2 ... 101
Table 3.7: ultrasonic test on portal 1 ... 101
Table 3.8: ultrasonic test on portal 2 ... 102
Table 3.9: concrete compressive strength from Sonreb method ... 102
Table 3.10: destructive tests results ... 102
Table 4.1: scale ratio factors ... 104
Table 4.1: analysis of loads of the frame (1:1 scale ratio) ... 107
Table 4.3: nodal loads ad masses of the frame (1:1 scale ratio) ... 107
Table 5.1: summary of mechanical infill’s parameter adopted ... 125
Table 5.2: symbols adopted ... 126
Table 6.1: parameters of the single strut model ... 132
Table 6.2: bare and infilled portal: maximum horizontal load and elastic stiffness ... 137
Table 6.3: geometric parameters of the triple strut model ... 141
Table 6.4: bare and infilled portal: maximum horizontal load and elastic stiffness ... 146
Table 7.1: summary of data from test on the infilled portal Ft2 ... 178
Table 7.2: experitmental dimension of the strut ... 179
Table 7.3: load-deformation curve of the theoretical strut model ... 179
Table 7.4: load-deformation curve of the experimental strut model ... 179
Table 7.6: summary of parameters of the calibrated infill model ... 181
Table 8.1: geometry and mechanical parameters of the infill panel ... 188
(1:1 scale ratio) ... 188
Table 8.2: stress-strain curve of the infill, experimentally determined ... 189
Table 8.3: parameters of the constitutive model of the strut determined for the frame (1:1 scale ratio) ... 189
Table 8.4: modal analysis results, parameter of the horizontal load distribution ... 192
Table 8.5: summary of results of the pushover analyses ... 192
1. Introduction
Framed structures were traditionally designed without taking into account the presence of infills realized with the objective of closing, or dividing the various building's spaces. This commonly accepted design process, also due to the weak calculation instruments available, led to a simplified structural analyses.
In reality, especially under horizontal loads the infills influence may result in important changes in terms of static as well as dynamic structural response. As is well known, infill provides to concrete structure a higher stiffness and a different stiffness distribution both in plan and in elevation.
Furthermore, as well demonstrated in by experimental studies and experiences from past seismic events, the infill influence can also be felt locally on structural elements; an important example is the collapse of slender columns under shear loading effects as a consequence of frame-infill interaction. Furthermore, the positive effects that frame-infill has on structural behaviour are also very important as they can make the structure stiffer and more resistant to horizontal loads.
Experts are currently divided between two opposite pionts of view for the development of new constructions. According to the first point of view, the negative effect of infill is much more important due to the high uncertainties that exist as a consequence of the poor level of homogeneity of infill's materials; therefore infills should be completely disconnected from the frame so as not to alter the behaviour expected from the design process. The second position underlines that for reasons related to economy and execution simplicity it is best to benefit from all of the structural and non structural elements; therefore infills should collaborate and, in the meantime, the potentially negative effects would be minimized through a careful study of structural details.
Existing technical codes are focused on the first point of view even though they provide modelling procedures that include nonstructural elements.
By analysing the state of the art of this topic, it is surprising to realize how a matter that has been investigated for more than 40 years has not lead to satisfactory models. This could be attributed to the very high number of parameters that rule the question: the first being the strong variability of materials qualities and workmanship influence.
Following an in-depth analysis of scientific literature and design codes it stands to reason that a unique method allowing for determineation of infill models, with the aim of being able to study structural response of buildings in their real configuration without neglecting non structural component, does not exist.
The aim of the scientific activity described in this thesis is to adopt some kinds of infill widely diffused in Italy as experimental samples. At the same time as the experimental activities carried out, reference has been made to scientific literature in order to assess the efficiency of formulas for the analytical determineation of mechanical characteristics of the infill and elementary models capable of simulating global behaviour of masonry infilled frames.
With the aim of pursuing a complete course, the experimental activities carried out on elementary materials and therefore on structural models are presented and discussed. Referring to results acquired and supported by the software for structural analysis OpenSees, experimentally validated numerical models have been generated.
1.1 Aims of the study
Study's aims are to achieve definition of a simplified model suitable for a simple and efficient non linear static analysis of infilled framed buildings, as well as to assess the level of safety with regards to collapse. Another requirement of the model is, obviously, the level of reliability of forecasts: for this purpose the numerical parameters have been calibrated on the basis of experimental results achieved from walls samples. Afterwards one specific type of infill has been selected to continue the experimental activity on in scale r.c. portals, designed to support vertical loads only, used as samples (bare or infilled) for horizontal loading cyclic tests.
The study begins with detailed experimental activities on two types of mortar and two types of bricks with which wall samples have been built to be subject to experimental compression tests along the three main loading directions.
Passing from elementary materials to wall samples, it has been possible to discuss some formulas proposal from codes and scientific literature for the definition of walls’ strength. At the same time, referring to portal's structure (realized from structural materials whose characteristics have been experimentally determined) the first representative numerical
models of bare or infilled frame structures have been created adopting two well known models: the single strut and triple strut model.
As a conclusion of the experimental activities, horizontal loading cyclic tests have been carried out on 3 portals: one bare and two infilled.
On the basis of the experimental results achieved, the numerical models have been discussed and then calibrated until the desired level of reliability has been reached.
At this point the numerical model obtained, that had a proven reliability, has been extended to much more complex plane frames. Therefore these models constitute a conclusion for the discussed activities but also a possible starting point for future studies.
1.2 Thesis layout
In this thesis, at first, experimental activities carried out on materials, walls and portals structural materials are discussed in chapter 2 and chapter 3.
Subsequently, chapters 4 and 5, the selected models (1:2 scale portal and 1:1 scale frames) as well as the adopted numerical models are presented. The results achieved by the first numerical analyses on the bare portal and on the infilled portal (both the single strut and the triple strut model have been adopted) have been discussed and compared in chapter 6.
In Chapter 7 the experimental tests performed on the bare portal and on the infilled portals have been described; the most interesting results and some selected images have been presented and discussed.
Results achieved from the experimental activity have been used to calibrate the numerical models; then, numerical and experimental result have been compared.
Finally, the calibrated models have been extended to much complex plane frames; some numerical results are presented in Chapter 8. In Chapter 9 a summary of the work has been presented together with some final reflections upon results achieved and future developments.
2. Experimental characterization of infills
2.1 Introduction
As is known, the use of representative models of interaction between infill and r.c. frames require a preliminary knowledge of the mechanical characteristics of the wall and do not always result in a sufficient representation of reality. Following these considerations emerges the necessity to assess, through a comparison offered by direct experimentation, the level of feasibility of currently diffused models. In order to do so, an experimental course has been performed with reference to widely diffused materials, concerning characterization of each single component right through models in scale of walls and frames.
The starting point was therefore a careful selection of the basic materials to be used; with two typologies of bricks (hollow and half-full bricks) and two of mortar (in the following type 1 and type 2 mortar) single panel and double panel walls have been built, commonly used for internal partitions or to infill external facades of civil buildings in Italy. Mechanical characteristics of bricks and mortar chosen have been identified with experimental tests. A total of 48 walls have been built, divided up as follows: 12 built using hollow bricks, 24 using half-full bricks and both types of mortar and 12 double panel walls combining the previous types of brickwork both with type 1 mortar. Once built and following 28 days after maturity of the mortar, it was possible to perform vertical, horizontal and diagonal compression tests on the sample walls.
2.2 Materials selection and samples preparation
A selection between materials commonly used in Italy for the infill of existing r.c. frames.
In particular, the elements that characterise an infill wall are both mortar and bricks used to build it. Mortar is regulated by technical requirements and it is characterised according to its composition and resistance. Indications are also provided by codes for bricks that, in the case of elements without structural functions, have dubious validity as proved in this thesis.
The characterization of a material, be it mortar or bricks, may be performed only through specific experimental tests, that have been
performed on mortar as well as bricks. The mortars selected (further details will be provided in the following paragraphs) can be distinguished as follows: one to be realized on site with a specific mix (type 1) and the other pre-mixed (type 2); the type 2 represents the preferred choice in common construction sites. The bricks used have been chosen as they are widely diffused in Italy, the two types adopted are illustrated in Figure 2.1 and in Figure 2.2.2.
Half-full bricks have vertical holes and their dimensions are 12x12x25
cm3, hollow bricks (definitions provided by Italian Code D.M. LL.PP.
20.11.1987), with horizontal holes have a perforation percentage
exceeding 45% and their dimensions are 12x12x25 cm3.. Figure 2.3 illustrates, as an example, a double panel wall and a single panel wall; the wall specimens built will be described in detail in the following paragraphs.
Figure 2.1: hollow bricks 8x16x33 cm3 Figure 2. 2: half-full bricks 12x12x25 cm3
Figure 2.3: types of infill walls: a) walls with double panel with air space b) plain wall
On the bricks previously described, in order to establish their mechanical characteristics, compression tests have been performed along the main loading directions: vertical and horizontal.
The sample bricks have been prepared through levelling and flattening of surfaces using a layer of high resistance mortar in order to guarantee a correct distribution of stresses on the element, otherwise full of irregularities, without affecting the experimental result.
Twenty-four blocks have been subject to compression test parallel and orthogonally to holes: twelve hollow and twelve half-full.
The compressive strength of the blocks fb has been determined according
to UNI-EN 772-1 specifications as the ratio between breaking load and the gross area of the section orthogonal to loading direction:
= ⋅ max b F f b l Eq. 2.1
with b and l dimensions of the surface orthogonal to loading direction.
The universal press MTS 810 (maximum load 500 kN), shown in
figure.2.4, has been used operating with a displacement speed of 0.05 mm/s and, only for the half-full bricks that have in the direction parallel to the holes a compressive strength exceeding the loading capacity of the press previously described, the Metrocom press (maxiumum load 3000
kN) operating with a loading rate of 0.8 kN/s. Loads and displacements have been automatically acquired.
For a more accurate data acquisition four displacement transducers have been provided between the loading plates (Figure 2.6).
Figure 2.4: MTS press Figure 2.5: Metrocom press
2.3 Experimental tests on mortar
2.3.1 Experimental tests on type 1 mortar
In order to characterise the mechanical properties of type 1 mortar two groups of samples have been created:
3 prisms 40x40x160 mm3
9 cylinders diameter 100 mm, height 200 mm
The loading surfaces of cylinders have been carefully flattened and the samples have been instrumented with four 50 mm strain gauges (two
horizontal and two vertical) as illustrated in Figure 2.10. The composition of type 1 mortar is the following: - 1 part of Portland cement (CEM II/B-M(L-S-V)32.5)
- ¼ of 32.5 cement - ¼ of 12.5 cement
- 4 parts of sand (granulometry between 1-4 mm)
The following tests have been performed in accordance with UNI EN 1015-11 requirements:
• bending tests on three points (distance between the supports 106
mm) (Figure 2.7, Figure 2.8) on 3 prismatic samples;
• compression tests on 9 cylindrical samples 100×200 mm.
The tests have been performed with the universal machine MTS 810
operating at a constant displacement speed of 0.05 mm/s.
Bending tests on type 1 mortar prisms
The bending test has been performed according to the layout illustrated below:
Traction strength f, has been obtained with the following formula: 2 1,5 ⋅ = ⋅ ⋅ F l f b d Eq. 2.2 with:
F maximum load applied
l distance between supports (100±0,5 mm)
b width of the prisms section (40 mm)
d height of the prisms section (40 mm)
The results achieved by the bending tests performed (Figure 2.8) are represented in Figure 2.9 and in Table 2.I.
0 250 500 750 1000 1250 1500 1750 2000 2250 0 0.1 0.2 0.3 0.4 0.5 0.6 0.7
lowering of the press [mm]
load
[N]
sample 1 sample 2 sample 3
Figure 2.9: type 1 mortar bending tests, load-deformation
Prism Fmax [N] f [MPa]
Sample 1 2009 4,70
Sample 2 1975 4,62
Sample 3 1992 4,66
fctm 4,66 fctk=0.7fctm 3,26
Table 2.1: type 1 mortar traction strength
Compression tests on type 1 mortar cylinders
Figure 2.10 illustrates some samples during the compression test. The cylinders have a substantially linear behaviour with a brittle rupture as soon as the maximum stress is reached.
Figure 2.10: Compression tests on mortar cylinders
According to indications provided by UNI EN 1015-11, before reaching the maximum load, cycles in an elastic range have been performed in order to guarantee perfect adhesion between the press and the sample. Table 2.II illustrates the compressive strength fand the elastic modulus E determined by each test and the average values. According to test results high compressive strength of mortar has been determined, therefore outside of the Code classifications.
The modulus of elasticity, in the absence of specific indications, has been determined with reference to the loading branch limited by 50% and 25% of the maxiumum load. Figure 2.11 illustrates the final loading
stress-strain curves. Table 2.II compression test results: maximum load, elastic
modulus and the Poisson coefficient are presented.
Cylinder fm[MPa] Em[MPa] n
Sample 1 22.15 - - Sample 2 19.48 15157 0.163 Sample 3 24.81 15197 0.181 Sample 4 26.01 18638 0.196 Sample 5 24.09 16900 0.207 Sample 6 26.50 18269 0.207 Sample 7 28.73 17605 0.202 Sample 8 17.96 - -
Sample 9 21.71 - - Average 23.49 16961 0.193 Standard deviation 3.47 1504 0.017 Interval 10.77 3481 0.044 Minimum 17.96 15157 0.163 Maximum 28.73 18638 0.207
Table 2.2: type 1 mortar compression tests results
0 5 10 15 20 25 30 35 0.0% 0.2% 0.4% 0.6% 0.8% 1.0% strain [-] stres s [ M Pa]
Figure 2.11: type 1 mortar stress–strain curve
2.3.2 Experimental tests on type 2 mortar
The same experimental tests previously described for type 1 mortar have been performed on type 2 mortar: the experimental results are presented as previously done for type 1 mortar. Type 2 mortar, differently from the other one, is a pre-mix consisting of hydrated lime, Portland concrete, sands and specific additives in order to reduce the setting time.
This material, chosen as it is widespread in Italy, has the following technical characteristics:
• specific weight in powder 1500 kg/cm3
• granulometry < 3 mm
• minimum thickness 10 mm
• paste water 18%
• elastic modulus after 28 days 8000 Mpa (data from factory) • class M5 (according UNI EN998-2 indications)
The results achieved by the experimental tests carried out are briefly illustrated below:
Cylinder fm[MPa] Em[MPa] n
Sample 1 12,83 16049 0,20 Sample 2 12,12 16208 0,21 Sample 3 10,68 16887 0,21 Sample 4 11,22 15405 0,21 Sample 5 12,52 17421 0,23 Sample 6 12,54 16026 0,20 Sample 7 11,05 16113 0,21 Sample 8 10,80 15714 0,24 Average 11,72 16961 0,21 Standard deviation 0,87 1504 0,01 Interval 2,14 3481 0,04 Minimum 12,83 15157 0,20 Maximum 17.96 18638 0,24
0 200 400 600 800 1000 1200 1400 1600 1800 2000 0.0 0.1 0.2 0.3 0.4 0.5 0.6 0.7 0.8
lowering of the press [mm]
load [ N ] sample 1 sample 2 sample 3 sample 4
Figure 2.12: type 2 mortar bending tests, load-deformation
0 2 4 6 8 10 12 14 0 0.2 0.4 0.6 0.8 1 1.2 1.4 1.6 1.8 2 2.2 2.4 strain [%] st r ess [M Pa]
Prism Fmax [kN] f [MPa] Sample 1 1924 2,92 Sample 2 1946 2,89 Sample 3 1542 2,33 Sample 4 1750 2,61 fctm 2,69 fctk=0.7fctm 1,88
Table 2.4: type 2 mortar traction strength
2.4 Experimental tests on bricks
2.4.1 Compression tests on hollow bricks
All the data collected by compression tests on hollow bricks are illustrated below, Figures 2.16 and 2.17 show respectively the
stress-strain and load-displacement curve from compression test orthogonal to
holes. In the same way figures 2.18 and 2.19 illustrate the curves related to compression parallel to holes.
Figure 2.14: hollow brick compression tests, compression orthogonal to holes (left); compression parallel to holes (right)
Figure 2.15: failure of a hollow brick sample compression orthogonal to holes (left); compression parallel to holes (right)
0 1 2 3 4 5 6 7 0.0% 0.1% 0.2% 0.3% 0.4% 0.5% 0.6% 0.7% 0.8% 0.9% 1.0% strain [-] st ress [ M P a ]
Figure 2.16: hollow bricks stress-strain curve, compression tests orthogonal to holes 0 20000 40000 60000 80000 100000 120000 140000 160000 180000 0 0.2 0.4 0.6 0.8 1 1.2 1.4 1.6 1.8 2 deformation [mm] load [N]
Figure 2.17: hollow bricks load-deformation curve, compression tests orthogonal to holes
0 2 4 6 8 10 12 14 0.0% 0.1% 0.2% 0.3% 0.4% 0.5% 0.6% 0.7% 0.8% strain [-] str ess [M P a ]
Figure 2.18: hollow bricks stress-strain curve, compression tests parallel to holes 0 20000 40000 60000 80000 100000 120000 140000 160000 180000 0 0.5 1 1.5 2 2.5 3 deformation [mm] load [ N ]
Figure 2.19: hollow bricks load-deformation curve, compression tests parallel to holes
Brick 80x160x330 fc,p [MPa] 80x160x330 fc,o[MPa] Sample 1 10,94 4,04 Sample 2 10,11 3,71 Sample 3 9,34 5,04 Sample 4 12,89 6,48 Sample 5 7,56 4,83 Sample 6 11,57 5,73 Average 10,4 4,97 Standard dev. 1,85 1,03 Minimum 7,56 3,71 Minimum 12,89 6,48 Interval 5,33 2,76 Code reference C har act eri st ic st rengt h (It al ia n c ode) D.M. LL.PP. 20th November 1987 7.32 4.97 D.M. LL.PP. 9th January 1996 5.28 1.48 D.M. LL.PP. 14th September 2005 7.28 3.48
Table 2.5: compression tests on hollow bricks: summary of results (fc,p=compression strength parallel to holes; fc,o=compression strength
orthogonal to holes)
2.4.2 Compression tests on half-full bricks
The data collected during the compression tests are presented below. Figures 2.21 and 2.22 represent, respectively, the stress-strain and
load-displacement curves from compression test orthogonal to holes, while
Figures 2.23 and 2.24 refer to the compression test parallel to holes.
Figure 2.20: half-full bricks compression tests, compression parallel to holes (left); compression orthogonal to holes (right)
Figure 2.21: failure of a sample of half-full bricks, compression parallel to holes (right) and orthogonal holes (left)
0 5 10 15 20 25 30 0.0% 0.2% 0.4% 0.6% 0.8% 1.0% 1.2% 1.4% 1.6% 1.8% strain [-] st re ss [ M P a ]
Figure 2.22: half-full bricks stress-strain curve, compression tests parallel to holes 0 100000 200000 300000 400000 500000 600000 700000 800000 900000 0 0.5 1 1.5 2 2.5 deformation [mm] load [N]
Figure 2.23: half-full bricks load-displacement curve, compression tests parallel to holes
0 1 2 3 4 5 6 7 0.0% 0.1% 0.2% 0.3% 0.4% strain [-] str ess [M Pa]
Figure 2.24: half-full bricks stress-strain curve, compression tests orthogonal to holes 0 10000 20000 30000 40000 50000 60000 70000 80000 90000 100000 0 0.2 0.4 0.6 0.8 1 deformation [mm] load [ N ]
Figure 2.25: half-full bricks load-displacement curve, compression tests parallel to holes
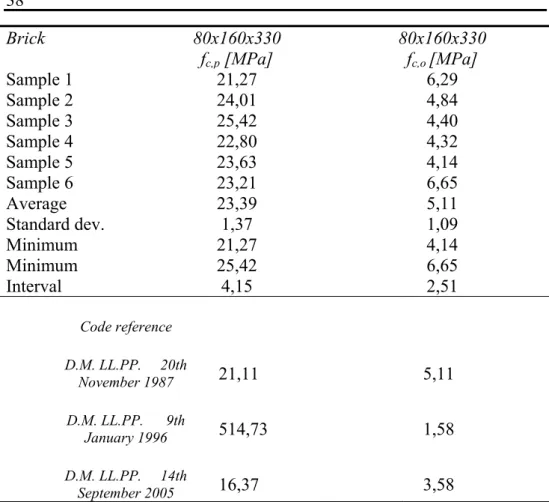
Brick 80x160x330 fc,p [MPa] 80x160x330 fc,o[MPa] Sample 1 21,27 6,29 Sample 2 24,01 4,84 Sample 3 25,42 4,40 Sample 4 22,80 4,32 Sample 5 23,63 4,14 Sample 6 23,21 6,65 Average 23,39 5,11 Standard dev. 1,37 1,09 Minimum 21,27 4,14 Minimum 25,42 6,65 Interval 4,15 2,51 Code reference D.M. LL.PP. 20th November 1987 21,11 5,11 D.M. LL.PP. 9th January 1996 514,73 1,58 D.M. LL.PP. 14th September 2005 16,37 3,58
Table 2.6: compression tests on half-full bricks: summary of results (fc,p=compression strength parallel to holes; fc,o=compression strength
orthogonal to holes)
2.5 Experimental tests on walls
The wall specimens have been built using the bricks presented in the previous paragraphs. With type 1 mortar twelve walls (101×101×80 cm3)
have been built using hollow bricks, twelve (77x77x12 cm3) using
half-full bricks, and twelve double panel walls (101×101 cm3 on walls plane and 26 cm depth including a 6 cm air space) coupling the previous walls,. With type 2 mortar other twelve walls (77x77x12 cm3) of half-full bricks
have been built. All of the walls characterised by constant bed-joints of approximately 10 mm in thickness, have been built by an expert workman with a level of accuracy that can be compared with the procedure commonly used on building sites. The samples have turned out to be well
done but they still have some defects. Walls construction was performed directly on wood bases in order to allow an easy movement. The loading surfaces have been levelled applying a layer of high resistance mortar in order to create smooth and parallel surfaces. Figures 26 and 27 illustrate the walls built in the Laboratory of experiments on materials and
structures of the University of Roma Tre.
Figure 2.26: walls specimens, walls of half-full bricks (left), walls of hollow bricks (right)
Figure 2.27: double panel walls, specimens ready to be tested (left), side view of double panel wall (right)
After a period exceeding 28 days, the samples were subject to compression tests; of the twelve samples available for each typology, 4 have been loaded parallel to holes, 4 orthogonally to holes and 4 diagonally.
Test equipment
A Metrocom press, that can perform compression tests with a defined loading rate, has been used to test walls. Experiments were carried out by applying an increasing monotonic load up to panel failure. The loading speed adopted was 1.6 kNs-1 for both of the main compression directions and equivalent to 0.8 kNs-1 for the diagonal compression. The load applied has been monitored with an external loading cell equipped with a spherical joint in order to avoid accidental loading eccentricities. In order to guarantee a uniform load distribution on sample faces, two HEB 300 steel trusses (Figure 2.28), sufficiently stiff in order to guarantee a uniform load distribution, have been inserted between wall and press plates; the equipment is shown in Figures 2.28, 2.29, 2.30. Panels in the diagonal compression test have been inserted between two steel supports specifically designed to transfer load in correspondence with sample corners (Figure 2.29).
Figure 2.28: steel profile used to transfer the compression load on walls
Figure 2.29: steel saddle used to settle the walls diagonally
Figure 2.30: vertical compression test, layout of test systems
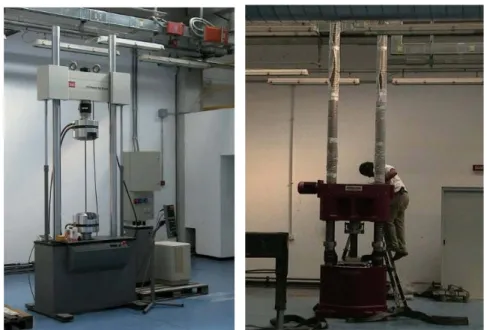
Figure 2.32: equipment set up for vertical compression tests: the steel profiles fitted onto the Metrocom 3000 kN press (left), a wall ready to be
crashed inside the press (right)
Figure 2.33: diagonal compression tests set up, steel supports for diagonal compression tests (left), wall ready to be crashed inside the
press (right)
The lower profile, in direct contact with the press piston, has been centred and its position has been checked before each test. Also with regards to the upper profile, connected by chains to the press, the perfectly horizontal position has been constantly controlled by calibrating chains length (Figure 2.34).
With the aim of determining panels deformation, displacement transducers (Figure 2.35) have been positioned; transducer’s ends, fitted with spherical joints, have been connected to steel bars inserted in mortar layers.
As illustrated in Figure 2.35, a displacement transducer (in the following
external transducer) has been installed in correspondence with the mobile
plate of the press in order to measure vertical plate’s translation; the deformation identified through this instrument coincides with the global deformation of the wall sample, that is affected by interface conditions between wall and loading plates that approximately can be compared to the what occurs between the infill-frame interface.
The position of the instruments installed directly on the walls (in the following) is represented in Figures 35 and 43. Measurement from all transducers has been performed at a frequency of 0.1 Hz.
Figure 2.35: transducer adopted to measure deformations (left), the external transducer installed (right)
Figure 2.36: hollow brick panels layout of sensors on the wall compressed parallel to holes [mm]
Figure 2.37: hollow brick panels layout of sensors on the wall compressed orthogonally to holes [mm]
Figure 2.38: hollow brick panels layout of sensors on the wall compressed diagonally [mm]
Figure 2.39: half-full brick panels layout of sensors on the wall compressed parallel to holes [mm]
Figure 2.40: half-full brick panels layout of sensors on the wall compressed orthogonally to holes [mm]
Figure 2.41: half-full brick panels layout of sensors on the wall compressed diagonally [mm]
Figure 2.42: double panel walls layout of sensors on the wall compressed parallel to holes [mm]
Figure 2.43: double panel walls layout of sensors on the wall compressed orthogonally to holes [mm]
Figure 2.44: double panel walls layout of sensors on the wall compressed diagonally [mm]
Figure 2.45: equipment for compression test parallel to holes on hollow brick walls (front and back view of the panel)
Figure 2.46: equipment for compression test orthogonal to holes on hollow brick walls (front and back view of the panel)
Figure 2.47: equipment for diagonal on hollow brick walls (front and back view of the panel)
Figure 2.48: equipment for compression test parallel to holes on half-full brick walls (front and back view of the panel)
Figure 2.49: equipment for compression test orthogonal to holes on half-full brick walls (front and back view of the panel)
Figure 2.50: equipment for diagonal compression test half-full brick walls (front and back view of the panel)
Figure 2.51: equipment for vertical compression on double panel walls (front and back view of the panel)
Figure 2.52: equipment for horizontal compression on double panel walls (front and back view of the panel)
Figure 2.53 equipment for diagonal compression on double panel walls (front and back view of the panel)
The following paragraphs describe the experimental results achieved. In this thesis the following symbols are adopted: fwv and fwh are the
compression strength in a vertical and horizontal direction respectively calculated as follows: ) /( tl F fwv = ⋅ Eq. 2.3 ) /( th F fwh = ⋅ Eq. 2.4
with t, l and h representing thickness, length and height of the walls. The wall shear strength (fwo) has been determined from diagonal
compression tests as the average value of the tangential stress acting parallel to wall’s sides corresponding to maximum load F: in accordance with ASTM E519-81 standards the following has been adopted:
/( 2 )
wo
f =F ⋅ ⋅l t Eq. 2.5
In the following the symbols Ev, Eh and Ed have been used to indicate
vertical, horizontal and diagonal elastic modules while Gw is the shear
modulus whose expression is: / w wo w G = f γ Eq. 2.6 where: w w w ε ε γ = 1− 2 2 Eq. 2.7
with εw1and εw2 being the strains in parallel and orthogonal to load directions.
For the two typologies of bricks adopted, vertical or horizontal loading directions have a different meaning.
In reality the walls made from hollow bricks are built with a horizontal holes, on the other hand half-full bricks have been placed with vertical holes.
For these reasons, for the double panel walls the vertical load refers to loading orthogonally to hollow brick holes or parallel to half-full brick holes: in the following the half-full bricks will be adopted as a reference element.
2.6 Experimental test results on hollow brick and
type 1 mortar walls
This paragraph describes the experimental results achieved for hollow brick walls.
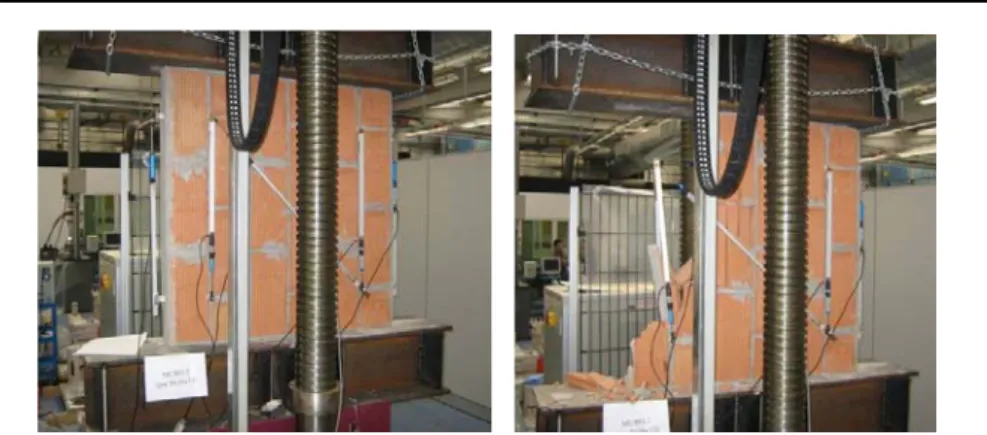
By examining the entire development of each test performed, it has been observed that collapse occurs after the detachment of the external parts of blocks due to the first cracks developing on the wall’s tight side, in fact these walls, due to their high slenderness inflects under vertical load: in some cases the walls quickly buckle preventing vision of any other mechanism.
In diagonal compression tests collapse occurs due to diffusion of a pseudo-vertical crack that begins at the panel’s centre, corresponding to maximum traction stress, and crosses the entire panel side to side; cracks distribution didn’t indicate a compressed strut resisting mechanism. Figures from 2.57 to 2.62 represent load-displacement and stress–strain curves of samples for all of the compression directions.
Deformations have been determined by measuring relative displacement between the press plates referring to external transducer, any other analysis aimed to identifying panel’s characteristics, depurated from wall-press interface effects have been determined referring to internal
transducers.
The mechanical behaviour of panels is elastic-brittle, the collapse occurred at maximum strength, the wall didn’t offer any residual resistance. Stiffness determined for both of the main loading directions (parallel and orthogonal to holes) is almost the same despite of a 50% increase of parallel to holes strength compared to orthogonal to holes strength.
Tests performed on these walls have highlighted scattered strength values; this result can be correlated with the large number of variables that may influence panel characteristics: relevant peculiarities are the high slenderness and the inevitable imperfections that make of each wall a single element.
Figure 2.54: compression test parallel to holes, initial phase and collapse
Figure 2.55: compression test orthogonal to hole, initial phase and collapse
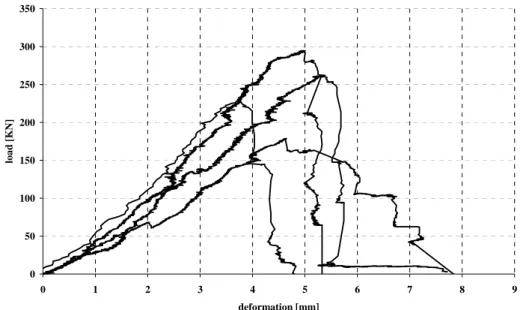
0 50 100 150 200 250 300 350 0 1 2 3 4 5 6 7 8 9 deformation [mm] lo ad [ K N]
Figure 2.57: compression tests parallel to holes, load-displacement curves of walls of hollow brick and type 1 mortar
0 0.5 1 1.5 2 2.5 3 3.5 4 0.0% 0.1% 0.2% 0.3% 0.4% 0.5% 0.6% 0.7% 0.8% strain [-] stress [MPa]
Figure 2.58: compression tests parallel to holes, stress-strain curves of walls of hollow brick and type 1 mortar
0 50 100 150 200 250 0 0.5 1 1.5 2 2.5 3 3.5 4 deformation [mm] lo ad [ K N]
Figure 2.59: compression tests orthogonal to holes, load-displacement curves of walls of hollow brick and type 1 mortar
0 0.5 1 1.5 2 2.5 3 0.0% 0.1% 0.1% 0.2% 0.2% 0.3% 0.3% 0.4% strain [-] stress [MPa]
Figure 2.60: compression tests orthogonal to holes, stress-strain curves of walls of hollow brick and type 1 mortar
0 10 20 30 40 50 60 70 0 2 4 6 8 10 deformation [mm] load [kN]
Figure 2.61: diagonal compression tests, load-displacement curves of walls of hollow brick and type 1 mortar
0.0 0.1 0.2 0.3 0.4 0.5 0.6 0.0% 0.1% 0.2% 0.3% 0.4% 0.5% 0.6% 0.7% 0.8% strain [-] str es s [MP a ]
Figure 2.62: diagonal compression tests, stress-strain curves of walls of hollow brick and type 1 mortar
Tables 2.7, 2.8 and 2.9 summarize compression test results in terms of maximum load F, characteristic strength fk and elastic modulus E as well
as their relative average values. In absence of specific indications, the value of elastic modulus E has been calculated along the linear branch between stresses of approximately 25% and 50% of the maximum stress. Walls diagonal strength fv0 has been determined as the ratio between
maximum load and the area section orthogonal to the corresponding loading direction: its characteristic value has been determined according to the following formula: fvk0=0,7×fv0.
The results achieved from measurements of internal transducers are now presented.
The internal deformations have been calculated as the average value of measurements of all six vertical potentiometers (two on one side, two on the opposite and two laterally).
The values measured by the internal transducers are very different from what has been determined referring to external transducers.
The feasibility of data acquired may be affected by the numerous variables that influence measurements, a relevant font of disturbance consists in the installation details especially the wall-transducers connections.
In Figure 2.63 and 2.64 the average values of the elastic modulus and of maximum vertical deformation have been compared, estimated with the external transducer or with those inside the panel.
Sample F [kN] fwh[MPa] Eh[MPa]
1 229.63 2.84 761
2 277.39 3.43 567
3 193.27 2.39 429
4 304.19 3.76 683
Average 251.12 3.11 610
Table 2.7: results of compression tests parallel to holes on hollow bricks walls
Sample F [kN] fwv[MPa] Ev[MPa]
1 70.69 0.87 1013
2 189.20 2.34 1040
3 224.20 2.77 986
4 128.96 1.60 751
Table 2.8: results of compression tests orthogonal to holes on hollow brick walls
Sample F [kN] fv0[MPa] fvk0[MPa]
1 34.94 0.31 0.21
2 62.22 0.54 0.38
3 26.39 0.23 0.16
4 37.87 0.33 0.23
average 40.35 0.35 0.25
Table 2.9: results of diagonal compression tests on hollow brick walls
Load parallel to the holes Load orthogonal to the holes
Sample E[MPa] Sample E[MPa]
1 4250 1 4400
2 4018 2 7053
3 2867 3 3349
4 6167 4 4415
Average 4326 Average 4804
![Figure 2.16: hollow bricks stress-strain curve, compression tests orthogonal to holes 020000400006000080000100000120000140000160000180000 0 0.2 0.4 0.6 0.8 1 1.2 1.4 1.6 1.8 2 deformation [mm]load [N]](https://thumb-eu.123doks.com/thumbv2/123dokorg/2848527.5879/34.892.212.693.248.538/figure-hollow-bricks-stress-strain-compression-orthogonal-deformation.webp)
![Figure 2.18: hollow bricks stress-strain curve, compression tests parallel to holes 020000400006000080000100000120000140000160000180000 0 0.5 1 1.5 2 2.5 3 deformation [mm]load [N]](https://thumb-eu.123doks.com/thumbv2/123dokorg/2848527.5879/35.892.215.711.241.541/figure-hollow-bricks-stress-strain-compression-parallel-deformation.webp)
![Figure 2.22: half-full bricks stress-strain curve, compression tests parallel to holes 0100000200000300000400000500000600000700000800000900000 0 0.5 1 1.5 2 2.5 deformation [mm]load [N]](https://thumb-eu.123doks.com/thumbv2/123dokorg/2848527.5879/38.892.191.682.245.543/figure-bricks-stress-strain-curve-compression-parallel-deformation.webp)
![Figure 2.24: half-full bricks stress-strain curve, compression tests orthogonal to holes 0100002000030000400005000060000700008000090000100000 0 0.2 0.4 0.6 0.8 1 deformation [mm]load [N]](https://thumb-eu.123doks.com/thumbv2/123dokorg/2848527.5879/39.892.205.663.240.540/figure-bricks-stress-strain-curve-compression-orthogonal-deformation.webp)
![Figure 2.41: half-full brick panels layout of sensors on the wall compressed diagonally [mm]](https://thumb-eu.123doks.com/thumbv2/123dokorg/2848527.5879/47.892.253.683.742.953/figure-half-brick-panels-layout-sensors-compressed-diagonally.webp)