Volume LX, 2008
Measurement issues in
drug policy analysis
Tel: (+43-1) 26060-0, Fax: (+43-1) 26060-5866, www.unodc.org*1055912* United Nations publication Printed in Austria ISSN 0007-523X Sales No. E.11.XI.6
USD 30 ISBN 978-92-1-48261-4 V.10-55912—December 2010—
BULLETIN ON NARCOTICS—V
olume L
X,
20
08
Vienna
BULLETIN
ON
NARCOTICS
Volume LX, 2008Measurement issues in
drug policy analysis
Selected papers from the Third Annual Conference of the International Society for the
Study of Drug Policy, held in Vienna on 2 and 3 March 2009
UNITED NATIONS New York, 2011
Sandeep Chawla, Editor
United Nations Office on Drugs and Crime Vienna International Centre
PO Box 500 1400 Vienna, Austria Telephone: (+43-1) 26060-0
Fax: (+43-1) 26060-5866
The Bulletin on Narcotics is available from www.unodc.org/unodc/en/data-and-analysis/Journals.html
The Office for Drug Control and Crime Prevention became the United Nations Office on Drugs and Crime (UNODC) on 1 October 2002. UNODC includes the
United Nations International Drug Control Programme. © United Nations, February 2011. All rights reserved.
The views expressed in signed articles are those of the authors and do not necessarily reflect the views of the United Nations Secretariat. The designations employed and the presentation of the material in this publication do not imply the expression of any opinion whatsoever on the
part of the Secretariat concerning the legal status of any country, territory, city or area, or its authorities, or concerning the delimitation
of any frontiers or boundaries.
Publishing production: English, Publishing and Library Section, United Nations Office at Vienna.
Sales No. E.11.XI.6 ISBN 978-92-1-148261-4
ISSN 0007-523X
iii
The Bulletin on Narcotics is a United Nations journal that has been in continu-ous publication since 1949. It is printed in all six official languages of the United Nations—Arabic, Chinese, English, French, Russian and Spanish.
The Bulletin provides information on developments in drug control at the local, national, regional and international levels that can be of benefit to the international community.
The present issue of the Bulletin, whose guest editor is Martin Bouchard of Simon Fraser University in Canada, is focused on measurement issues in drug policy analysis. It consists of a selection of papers presented at the Third Annual Conference of the International Society for the Study of Drug Policy, held in Vienna on 2 and 3 March 2009.
The United Nations Office on Drugs and Crime wishes to thank Melissa Tullis of the Division for Policy Analysis and Public Affairs and Raggie Johansen of the Studies and Threat Analysis Section for editorial assistance in preparing this issue.
iv
Individuals and organizations are invited by the Editor to contribute articles to the
Bulletin on Narcotics dealing with policies, approaches, measures and developments
(theoretical and/or practical) relating to various aspects of the drug control effort. Of particular interest are the results of research, studies and practical experience that would provide useful information for policymakers, practitioners and experts, as well as the public at large.
All manuscripts submitted for publication in the Bulletin should constitute original and scholarly work that has not been published elsewhere or is not being submitted simultaneously for publication elsewhere. The work should be of relatively high profes-sional calibre in order to meet the requirements of a United Nations technical publication. Contributors are kindly asked to exercise discretion in the content of manuscripts so as to exclude any critical judgement of a particular national or regional situation.
The preferred mode of transmission of manuscripts is the Word format. Each man-uscript submitted should consist of an original hard copy and an electronic version, in Word for the text and Excel for charts and tables, in any of the six official languages of the United Nations—Arabic, Chinese, English, French, Russian and Spanish. The manuscript should be accompanied by an abstract of approximately 200 words, a com-plete set of references numbered in the order of their appearance in the text and a list of keywords. The manuscript should not exceed 6,000 words. Tables should be self-explanatory and should supplement, not duplicate, information provided in the text.
Manuscripts, together with brief curricula vitae of their authors, should be addressed to the Editor, Bulletin on Narcotics, either by mail (Divison for Policy Analysis and Public Affairs, United Nations Office on Drugs and Crime, Vienna International Centre, PO Box 500, 1400 Vienna, Austria), or by e-mail ([email protected]). A transmittal letter should designate one author as correspondent and include his or her complete address, telephone number and e-mail address. Unpublished manuscripts will be returned to the authors; however, the United Nations cannot be held responsible for loss.
Views expressed in signed articles published in the Bulletin are those of the authors and do not necessarily reflect those of the United Nations Secretariat. The designations employed and the presentation of the material in this publication do not imply the expression of any opinion whatsoever on the part of the Secretariat concerning the legal status of any country, territory, city or area, or its authorities, or concerning the delimitation of any frontiers or boundaries.
Material published in the Bulletin is the property of the United Nations and enjoys copyright protection in accordance with the provisions of Protocol 2 annexed to the Universal Copyright Convention concerning the application of that Convention to the works of certain international organizations.
v
All issues of the Bulletin on Narcotics (from vol. I, No. 1 (1949), to the present issue) are available on the website of the United Nations Office on Drugs and Crime (http://www.unodc.org/unodc/en/data-and-analysis/bulletin/index.html).
The following special issues of the Bulletin are also available as United Nations publications:
1993
Policy issues relating to drug abuse and the human immunodeficiency virus (HIV) (vol. XLV, No. 1)
Drug testing in the workplace (vol. XLV, No. 2) 1994 The family and drug abuse (vol. XLVI, No. 1)
Special issue on gender and drug abuse (vol. XLVII, Nos. 1 and 2) 1996
Special issue on rapid assessment of drug abuse (vol. XLVIII, Nos. 1 and 2) 1997 and 1998
Double issue on cannabis: recent developments (vol. XLIX, Nos. 1 and 2, and vol. L, Nos. 1 and 2)
1999 Occasional papers (vol. LI, Nos. 1 and 2)
2000
Economic and social costs of substance abuse (vol. LII, Nos. 1 and 2) 2001
Dynamic drug policy: understanding and controlling drug epidemics (vol. LIII, Nos. 1 and 2)
2002
The science of drug abuse epidemiology (vol. LIV, Nos. 1 and 2) 2003
The practice of drug abuse epidemiology (vol. LV, Nos. 1 and 2)
vi
Illicit drug markets (vol. LVI, Nos. 1 and 2) 2005
Science in drug control: the role of laboratory and scientific expertise (vol. LVII, Nos. 1 and 2)
2006
Review of the world cannabis situation (vol. LVIII, Nos. 1 and 2)) 2007
A century of international drug control (vol. LIX, Nos. 1 and 2)
Requests for permission to reprint signed material should be addressed to the Secretary of the Publications Board, United Nations, New York, New York 10017, United States of America. Correspondence regarding the purchase of copies of and subscriptions to the Bulletin on Narcotics should be addressed as follows:
United Nations Publications 300E 42nd Street, Rm. IN-919J New York, NY 10017 Tel.: (+1) 212 9638302; (+1) 800 2539646 Fax: (+1) 212 9633489 Email: [email protected] Website: http://unp.un.org 10-55912_inner_nd.indd 6 04/02/2011 15:27:06
vii
Page
Preface . . . iii Editorial: measurement issues in drug policy analysis
by M. Bouchard . . . 1 Capture-recapture methods to estimate prevalence indicators for the
evaluation of drug policies
by F. Mascioli and C. Rossi . . . 5
Studies on public drug expenditure in Europe: possibilities and limitations
by F. Vander Laenen, L. Vandam and B. De Ruyver. . . 27
Measuring the benefits of drug law enforcement: the development of the Australian Federal Police Drug Harm Index
by R. Attewell and M. McFadden . . . 45
The association between the number of days of methamphetamine use and the level of earnings from acquisitive crime among police detainees in New Zealand
by C. Wilkins and P. Sweetsur . . . 59
Modelling disorganized crime: the cannabis market
1
Martin bouchard
Assistant Professor, School of Criminology, Simon Fraser University, Canada
I am pleased to introduce this special issue of the Bulletin on Narcotics, which consists of selected papers from the Third Annual Conference of the International Society for the Study of Drug Policy (ISSDP), held in Vienna on 2 and 3 March 2009. The organizers of the ISSDP conferences have always insisted on using this type of publication as a way to disseminate the important work on drug policy that is presented at their meetings, but also to keep stimulating policy research of the highest standards. Selected papers from the first two conferences have been published in Contemporary Drug Problems (vol. 35 (2/3), 2008) and the Inter
national Journal of Drug Policy (vol. 20 (6), 2009).
The publication of these special issues represents a unique opportunity to take the pulse of the field, and this issue of the Bulletin is no exception. While the number of research articles selected is relatively small, each one is a prime exam-ple of the quality and diversity of research presented at ISSDP conferences. For example, the collection of articles included in this issue contributes to understand-ing the connections between drugs and crime (Wilkins and Sweetsur), the (dis) organization of drug markets (Costa Storti and De Grauwe), the issue of public expenditures (Vander Laenen, Vandam and De Ruyver) and drug use prevalence in the evaluation of drug policy (Mascioli and Rossi), as well as to the develop-ment of drug harm indexes (Attewell and McFadden), an issue that has been the object of a special workshop in Vienna. Although this collection of articles first and foremost illustrates the variety of approaches taken in the analysis of drug policy, all authors share a concern for improving the measures and indicators available to do so. This interest in measurement issues is arguably one of the most important factors for the future of the field.
The special issue opens with Mascioli and Rossi’s article (“Capture-recapture methods to estimate prevalence indicators for the evaluation of drug policies”) on the measurement of the prevalence of drug users in Italy. The authors make use of capture-recapture methods, which have been shown to provide valid measurements *The author would like to express his sincere gratitude to Melissa Tullis and Peter Reuter for their generous contributions, and to the reviewers without whom this special issue would not have been possible.
of populations of drug users in a variety of contexts and settings, and innovate over previous studies in a number of ways. First, they use a single data set comprising all individual drug users identified by the Italian police in 2007, avoiding the problem of matching records found in multiple data set capture-recapture studies. Second, they estimate prevalence from three different methods (all with slightly different assumptions), allowing for a proper triangulation of results. Third, they provide separate estimates for males and females and for eight different age groups, including adolescents. They find that the prevalence rates are highest for the 20-24 and 25-29 age groups, but that the capture and recapture rates are highest for adolescent users. In other words, adolescent users are detected and registered at a higher rate than users in other age groups. Because these estimates were derived from police records, these results are of heightened importance for policymakers.
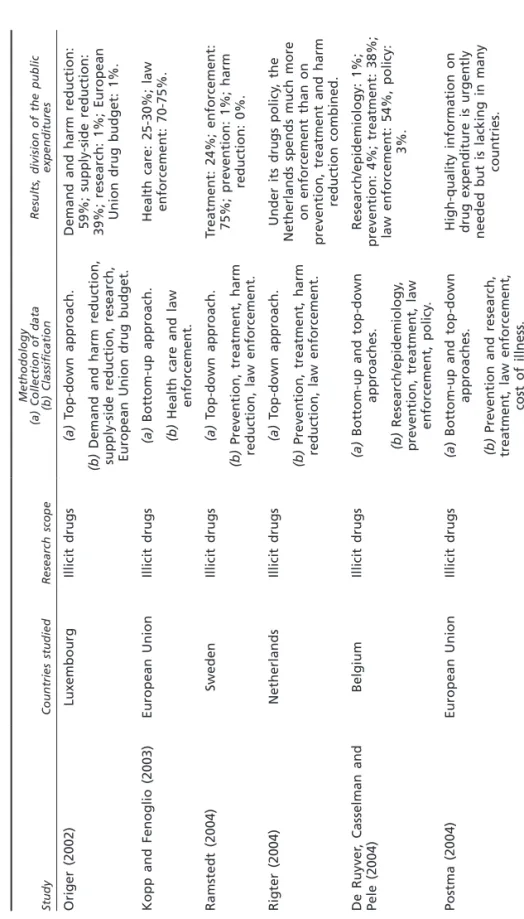
By analysing the concept of public expenditures, the second article, by Vander and others (“Studies on public drug expenditure in Europe: possibilities and limitations”), raises the issue of measurement on the government side, examining how and how much public authorities actually spend on drug policy. The authors first make the important distinction between public (direct expenditures by public authorities), private (expenditures of individuals and pri-vate organizations) and external (related to the consequences of drug use) expenditures. Together, the authors argue, these three kinds of expenditure form the total social costs of drugs in society. With a clearer idea of the concepts, the authors then proceed to present the steps that need to be taken in order to estimate public expenditures. Their review of the methodological frameworks used in European studies on public expenditures leads to the identification of five steps: defining the research scope (legal and/or illegal drugs?), identifying the major players responsible for drug policy, collecting the data (top-down or bottom-up approach?), classifying public expenditures (prevention, treatment, law enforcement, etc.) and, finally, calculating the actual expenditures from collected data. The article is essential reading for researchers embarking on public expenditure estimation exercises.
The article by Attewell and McFadden (“Measuring the benefits of drug law enforcement: the development of the Australian Federal Police Drug Harm Index”) starts where the previous article left off. The authors document the development of a drug harm index in Australia and examine its utility as a performance measure for the Australian Federal Police. The article raises an important question: are the actions of law enforcement agencies aimed at preventing the importation of illegal drugs effective and, more importantly, what is the appropriate performance measure to answer this question? Assumptions are inevitable in such exercises, and the authors of this paper make an important one: that the drugs seized at the border do not reach drug users and, as such, the costs associated with the use of these drugs could have been avoided. Defined as such, the drug harm index estimates a clear return on investment for each
dollar allocated to federal drug law enforcement. The return on investment is especially high for operations involving international partners where the potential for larger seizures is greatest.
One of the greatest harms associated with drug use is the increase in drug-related criminality—the focus of the article by Wilkins and Sweetsur (“The association between the number of days of methamphetamine use and the level of earnings from acquisitive crime among police detainees in New Zealand”). Drawing on the New Zealand version of the Arrestee Drug Abuse Monitoring (ADAM) survey on police detainees, the authors focus on a specific drug (meth-amphetamine) and its relationship to two money-generating offences (property crime and drug dealing). Several important features make this article worthy of note. First, the main dependent variable (criminal earnings) is a much richer indicator of criminal involvement (and criminal success [1]) than the presence or number of crimes committed, and it is more likely to be directly associated to levels of drug use [2]. Wilkins and Sweetsur find that the number of days over which methamphetamine is used is the strongest predictor of both property crime and drug dealing earnings. Second, the authors control for the effect of other important determinants of earning levels, including the frequency of cannabis and alcohol use. Not only do they find that slightly different predictors are associated with the level of earnings from property crime and from drug dealing, but also that cannabis and alcohol use are significantly related only to the former, not to the latter. The implications for drug policy are straight-forward: preventing methamphetamine use—heavy use in particular—has the clear potential to reduce crime.
Although their focus and analysis are completely different, the authors of the closing article of this special issue of the Bulletin (“Modelling disorganized crime: the cannabis market”) also deal with the issue of money. Costa Storti and De Grauwe present a fascinating economic analysis of the structure of cannabis markets in industrial countries. They start by emphasizing some of the peculi-arities of the cannabis market in comparison to the cocaine or heroin markets, the most important being the decentralization of production leading to a new-found proximity between cannabis producers and users. The objective of the authors is to build a theoretical model that takes these particularities into account. An important assumption of the model is the presence of monopolistic competition, in other words that there are many potential suppliers competing in a market characterized by asymmetric information—a market in which the sellers have a better idea of quality than the buyers. After crafting a model that takes these features into account, the authors use such a model to analyse the effects of two phenomena: a change in remuneration and a change in the number of seizures. Both scenarios have slightly different implications for the market, but both lead to the same overall effect: a decrease in the size of suppliers but a rise in their numbers, which makes for a more competitive market structure. Interestingly, Costa Storti and De Grauwe’s model leads to a conclusion that has
been offered before in other contexts [3, 4]: past a certain threshold, increases in the intensity of law enforcement may produce diminishing returns by creating a larger number of targets that are increasingly difficult to detect. References
1. Carlo Morselli and Pierre Tremblay, “Criminal achievement, offender networks and the benefits of low self-control”, Criminology, vol. 42, No. 3 (2004), pp. 773-804. 2. Christopher Uggen and Melissa Thompson, “The socioeconomic determinants of
ill-gotten gains: within-person changes in drug use and illegal earnings”, American
Journal of Sociology, vol. 109, No. 1 (2003), pp. 146-185.
3. Martin Bouchard, “On the resilience of illegal drug markets”, Global Crime, vol. 8, No. 4 (2007), pp. 325-344.
4. Mark A.R. Kleiman, “The problem of replacement and the logic of drug law enforce-ment”, FAS Drug Policy Analysis Bulletin, No. 3, 1997.
5
indicators for the evaluation of drug policies
F. Mascioli*Associate Professor of Statistics, University La Sapienza, Rome
C. Rossi*
Professor of Medical Statistics, University of Rome “Tor Vergata”, Rome
A b S T R A C T
In the present paper several capturerecapture procedures in the presence of a single source are compared to estimate the size of the population of drug users that risks being registered for personal drug use under Italian law. It is the first time that this method is used in Italy for this particular subpopulation. Data sets are based on police registration data for the year 2007 and have been provided by the Italian Ministry of the Interior. In order to propose a means of evaluating the impact of demandreduction policies, particular attention has been devoted to prevalence estimates for the younger age groups (those under 20 years of age), for whom prevalence can be considered as a good proxy for incidence; in fact, incidence indicators are more efficient in assessing the effect of policy intervention but are more difficult to estimate.
Keywords: capture-recapture; truncated Poisson model; heterogeneity; prevalence;
incidence; calibration.
Introduction
Historically, capture-recapture procedures have been used to determine the size of an unknown animal population. However, such procedures may be applied more widely, for example to estimate the size of a human population with a certain disease or of a sub-group that is difficult to identify because it is involved in illegal activities.
One such hidden population is that made up of drug users. Estimating the size of this population using the administrative databases available in many countries is important for assessing the effect of anti-drug policies at various *This work was partially supported by the Open Society Institute. The authors would like to express their deepest thanks to reviewers for their helpful comments and suggestions, and thank Daria Scacciatelli for the valuable support in data analysis.
levels of government. However, new trends in illicit drug markets are challenging for classical methods and definitions, with the main problem being modelling data generation processes in order to estimate the specific subpopulation involved in a given process. In fact, different archives capture different subpopulations of drug users. Data generation processes in each country strongly depend on drug laws and their implementation, and on policy measures. On the basis of the laws and policies implemented, different hidden subpopulations become visible and risk being registered in a database, which means that estimation methods can only be used to measure the size of such subpopulations in relation to the databases available. External information can be used to better specify and estimate the extent of the problem.
Many capture-recapture contributions in public health use a modelling approach with two or more sources or lists [1-5]. In the field of drug use, these sources are often hospitals, the police, family doctors, etc. If subjects are identified on two or more occasions, estimates of the hidden population are based on the degree of overlap between the resulting data sets.
Another approach involves a single list with repeated entries during the observational period [6-11]. In such an approach, the first step is to count repeated entries of the same user and then to attempt to estimate the frequency of units missed by the sample, using information on the number of people found during the study period in that single list one time, two times, three times and so on. If an appropriate truncated count model can be found and fitted to this type of data, it is possible to estimate the unobserved frequency of zero entries in the list. When the focus is on the population of drug users, police records provide the number of times an individual has been identified; drug users who have never been identified will not appear in the records. Count models differ in the way the count distribution is specified.
In contrast to the multiple-list approach, the one-list approach is less demand-ing in terms of data requirements, especially as it avoids all the matchdemand-ing problems arising from using different sources. In the literature, this counting approach is commonly classified as a “capture-recapture model”. The difference is between studies that examine repeated captures across multiple lists and those that examine repeated captures within a single list. In the field of illicit drug research, the one-list approach has been applied to estimate prevalence of specific subpopulations of drug users, such as opiate users in Rotterdam [12], opiate users in Western Australia [13], injecting drug users in Scotland [14], heroin and meth-amphetamine users in Bangkok [15], problematic cocaine users in Barcelona [16] and problem drug users in the Netherlands [17].
In this article, a particular application of the multiple captures model within a single data source is presented with the aim of estimating the size of the population of drug users at risk of being registered for personal drug use. This
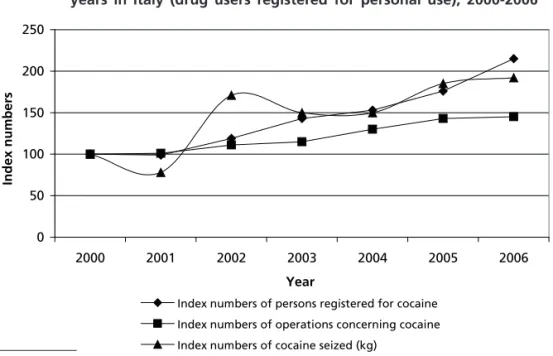
population is “generated” by the current legal framework in Italy, specifically by article 75 of Presidential Decree 309 of October 1990 (D.P.R. 309/90), which prohibits the possession of all drugs.1 The resulting database makes it possible to follow recent trends in drug markets better than other administrative databases resulting from, for example, data on hospitalizations, arrests for drug-related offences, imprisonments, drug-related deaths and so on, which are commonly employed to estimate the size of the “problem drug user population”2 or other problematic subpopulations. This is shown clearly in the figure below, where the supply-side indicators are also reported for comparison and show similar behaviour; the example refers to recent trends in the cocaine market. The population studied here is generally younger than that reported in other databases. The main substances used are: cannabis (about 70 per cent), cocaine (about 20 per cent) and synthetic drugs (4 per cent), whereas the problem drug user population in Italy mainly consumes opiates (more than 70 per cent) or cocaine (about 15 per cent). This population is generally not involved in criminal behaviour (either acquisitive crime or drug dealing). The estimates obtained for this specific popula-tion lend themselves better to comparison with estimates derived from general population surveys for assessing the implementation and effectiveness of using article 75 of the drug law for the early detection of drug users. The aim of article 75 is dissuasion and secondary prevention for drug users.
Figure I. Supply and demand-related indicators related to cocaine in recent years in Italy (drug users registered for personal use), 2000-2006
0 50 100 150 200 250 2000 2001 2002 2003 2004 2005 2006 Year In d ex n u mb er s
Index numbers of persons registered for cocaine Index numbers of operations concerning cocaine Index numbers of cocaine seized (kg)
1 Possession of drugs for personal use is punishable by administrative sanctions. A maximum quantity of drugs determines the threshold between personal possession and trafficking. If a person is found in possession of illegal drugs for the first time, administrative sanctions are usually not applied, but the offender receives a warning from the prefect and a formal request to refrain from use.
2 The term “problem drug use” is defined by the European Monitoring Centre for Drugs and Drug Addiction as “injecting drug use or long duration/regular use of opioids, cocaine and/or amphetamines”.
In section II, data sources and the main methodological features are outlined; in section III, the data generation model is presented; in section IV, the results are summarized in tabular and graphical form; and, in section V, conclusions are drawn and further developments are outlined.
Study design
The objective of the study is to apply a capture-recapture method to estimate the prevalence of drug users at risk of being registered for personal possession in Italy during 2007, according to the law presently in force.3
The data set has been provided by the Italian Ministry of the Interior and contains various contingency tables with aggregated data on individuals identified by the police in 2007, divided by sex, age and number of times they were registered (once or more than once) during that year. Information on the geographical area (district) in which the registration with the police took place is also available. Individuals can be identified at any time during the period of observation. In our study, individuals were unequivocally identified and recorded.
The procedure involves a single-source capture-recapture analysis in which three different estimators are compared. The three estimators are generated through truncated Poisson modelling. The first is the classical Horvitz-Thompson estimator [18], while the other two, independently, developed by Zelterman [19] and Chao [20, 21], incorporate unobserved heterogeneity, relaxing the assumptions about homogeneity of capture probabilities. The reason for this comparison is that each of the estimators is based on different assumptions and any violation of those assumptions might invalidate the estimates.
To account for observed heterogeneity, stratification by age group, gender or both, is also considered. The geographical covariate will be analysed in a future paper, as the size of the sub-groups obtained including all the observable covari-ates (age, gender and geographical area) does not permit statistical analysis. Variances and associated confidence intervals have been calculated for the three estimators. The limitations of the methodology applied are also discussed.
Data generation model: the zero-truncated Poisson model
Police records were used to derive count data on how often (once or more than once) each drug user was identified, where repeated identifications can occur at
any time during the study period. We do not know the number n0 of individuals who are identified zero times (individuals who were not identified but had a positive probability of being identified since they belonged to the target popula-tion), but can estimate their number from the observed frequencies nj(j> 0) by assuming that nj is generated by a Poisson distribution that is truncated below one. Then we were able to estimate the size of the hidden population of target drug users by adding the estimate ˆn0 of n0 to the number of identified
drug users, or through calibration.
Let n n1, ,...,2 nk be the frequencies of individuals identified 1, 2, ..., k times in the time period considered, where k denotes the largest count observed, and let p p1, ,...,2 pk be the associated probabilities of identifying individuals 1, 2, ..., k times. We also denote by n the number of distinct individuals identified, by
m the total number of identifications and by N the size of the drug user
population at risk of being identified. Then
n ni m in N n n n i k i i k k = = = + + + = =
∑
∑
1 1 0 1 , , ... .If p0 is known, the overall population of drug users can be estimated by means of the Horvitz-Thompson estimator: Nˆ =n (1−p0), which represents the number of observed cases identified by the police, adjusted for the probabil-ity of being included in the database. This estimation method may be viewed as a calibration method.
If p0 is unknown, different approaches lead to different estimates of p0
and N. We will concentrate on three different estimators suggested in the lit-erature, without providing much detail. These estimators, obtained from data following a Poisson distribution, are subject to the following assumptions:
(a) That the population is closed;
(b) That the individual probabilities of being observed and re-observed are constant during the study period;
(c) That the population of interest is homogeneous.
The first assumption, known as the closure assumption, asserts that the true population size, N, is unaffected by migration, birth and death during the period under review. In this particular study, we have chosen a period of one year because we want to estimate the one-year prevalence. Keeping the study period short is one way of addressing the closure assumption. In our case, it is hard to see how the size of the population of drug users could change signifi-cantly in a single year.
The second assumption, i.e. constancy of (re)capture probability, does not take into account the possibility of individuals showing a behavioural response to the experience of being registered. Evidently, with respect to the data gener-ating process, this assumption is a restrictive one. Again, one way of dealing with this assumption is to keep the time period under review as short as pos-sible, but not too short, otherwise the number of recaptures is likely to be zero.
Finally, the homogeneity assumption dictates that the probability of being observed and re-observed should not differ too much between different individuals and, in theory, this assumption should not cause too many concerns. The estima-tors of both Chao and Zelterman considered here are fairly robust, in the sense that both will underestimate the true size of the population in the presence of heterogeneity [21, 22]. So, if heterogeneity is suspected, then it could be assumed that the estimates are in the “lower bounds” of the true population size [23].
It is also possible to stratify the data set and perform a sub-group analysis on groups that are more homogeneous and pool those estimates into a single estimate of N.
All the estimators will produce underestimates of N in the presence of heterogeneity, so we should expect that using regression-type estimators and introducing more covariates will produce a higher estimate of N.
The Horvitz-Thompson estimator under Poisson homogeneity
A traditional approach assumes that the count of each individual is generated by the same Poisson distribution with parameter l. Then lcan be estimated by maximizing the likelihood for the zero-truncated Poisson distribution. The estimate of lˆof l leads to the estimate pˆ0=e−lˆ and the Horvitz-Thompson estimator becomes NˆHT =n (1−pˆ )
0 . The variance of NˆHT can be obtained [8].
To estimate l, another approach that has been used involves maximizing the likelihood function of the Poisson density via the EM algorithm in the complete data framework [24]. Both approaches applied to our data led to the same estimate for l, at the chosen level of accuracy. The variance for lˆ can be obtained from the log-likelihood function by the standard approach.
Including heterogeneity: the estimators of Zelterman and Chao
The assumption of homogeneity of identification probabilities is rarely met in practice. The simple Poisson model is not flexible enough to capture population heterogeneity and will generally underestimate the size of the population.
Zelterman proposed estimating p0 using only frequencies nj , from the zero-truncated count distribution, where j is usually chosen to be 1 or 2. The proposed estimator given by Nˆ exp(n / )
n n
Z=
− −
1 2 2 1
has been shown to be robust against model misspecifications. A relatively simple variance formula can be found for Nˆ
Z [25, 26].
Chao suggested an estimator for the population based on a mixed Poisson model. Chao’s estimator is given by Nˆ n n / ( n )
C= + 12 2 2 and provides a lower bound for the population size, allowing for population heterogeneity.
As before, a variance formula for Nˆ
C can be derived [25, 26].
In order to use Chao’s and Zelterman’s estimators, as only n1 and n>1 were available in the data set provided by the Italian Ministry of the Interior,4 n
2 was obtained by multiple imputation on the basis of lˆ.
Both estimators are primarily based on the lower frequency classes (n1 and
n2). People seen rarely (once or twice) are likely to bear a greater resemblance to those never seen than to those seen very often. In addition, the emphasis on the lower frequency classes makes the estimators robust in the presence of heteroge-neity, e.g. persons seen very often may form a different sub-group compared to persons seen rarely. The influence of persons seen often is weighted down in both estimators; therefore, heterogeneity, if present, is likely to exercise a relatively minor influence. In practice, the underlying conditions that were assumed for the three estimators and previously discussed are unlikely to hold.
The closure assumption is under control if the study period is short. A study period of one year is generally considered satisfactory, but a six-month period might be better and will be used in a future study as soon as adequate data becomes available.
The constant (re)capture probability is hard to control. If a drug user changes his or her behaviour following identification and if, as a result, the probability of him or her being identified decreases or increases, the independence structure of the Poisson distribution is violated. As already mentioned, one way of dealing with this assumption is to keep the study time period as short as possible. However, using the Chao and Zelterman estimates minimizes the problem. A generalized model could also be developed, but proper information must first be acquired by carrying out surveys among drug users.5
4 Since the Italian Ministry of the Interior did not provide data specifying exactly how many times individuals were registered, the data generation process was adapted to the data set available.
A problem in spatial variation may also exist. At the national level, if there are areas where the police are less likely to identify drug users, then the model fitted to data for the entire country may not be valid. In that case, the popula-tion should, if possible, be stratified by geographical area.6
Indeed, the approach to estimating drug use prevalence by capture-recapture methods generally performs better at the local level than at the national level, as it minimizes heterogeneity problems [27].
Covariate information
One method to account for observed heterogeneity described in the form of covariates is to stratify the population and then pool the estimates into a single estimate of N. This allows individuals with different characteristics to have different Poisson parameters. It is possible that the probability of being identified for males is different to that of females, or that younger drug users are less likely to be identified.
In this study, demographic variables such as age and gender were considered as important covariates. If all relevant covariates are included, estimators are generally less biased and more precise, but if the strata contain too few data, statistical problems can arise and uncertainties in the estimates increase, thus some compromise is necessary.
Confidence intervals
Estimating variances for the three estimators allows a calculation of 95-per-cent confidence intervals for N, according to the usual formula: Nˆ±1 96. var( ˆ )N .
To improve the confidence interval for the three estimators, the log transforma-tion proposed by Chao [20] was used. A capture-recapture study produces an estimate that is the final stage of a process in which errors can be introduced at different stages. A confidence interval only takes into account sampling variations, not the uncertainty related to possible violations of the underlying assumptions. To calculate the variance for the three estimators, the new approach proposed by van der Heiden et al. [8] and Böhning [26] was used. That approach breaks down the variance into two components: the binomial variance due to sampling n units from a population of size N and the variance due to estimation of the model parameters.
6 Recent analyses at the local level show that the covariate “geographical area” might have a greater influence than the age and gender covariates used in this paper. An estimated size of 558,000 (Horvitz-Thompson point estimate) has been obtained for the target population.
Main results
Available data refer to subjects identified by the police with a quantity of drugs for “personal use only”.7 In the following tables, data and various estimates of l and N are reported.
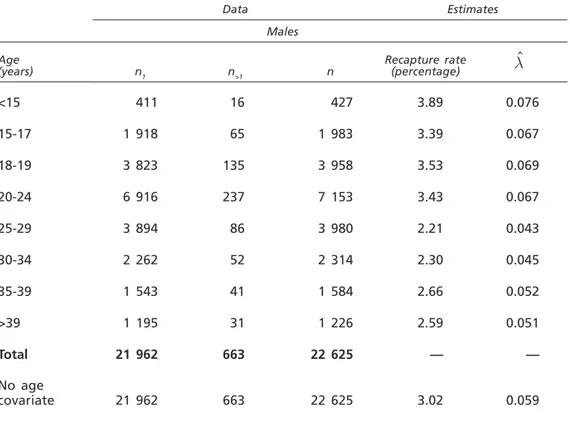
Table 1 presents available data, disaggregated by gender and age, as provided by the Ministry of the Interior in its annual report to the national parliament for 2007. There are significant differences between the numbers of individuals identi-fied in each age group, the highest number being observed in the group aged 20-24. Estimates for l are also presented.
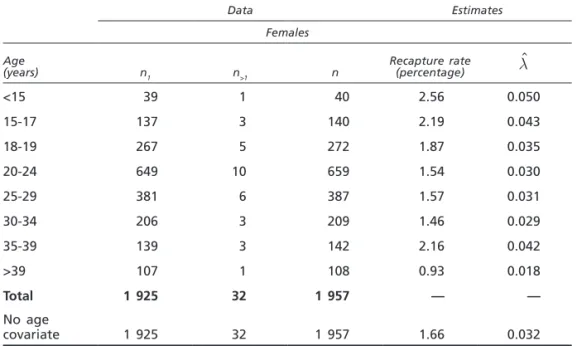
It must be observed that re-capture rates (n>1 n1) and estimated values for l are lower for females than for males in each age group, which means that the female population has a smaller chance of being identified than the male population. The same phenomenon appears in another set of data concerning dealers, analysed by Rossi and Ricci [28].
Table 1. Data on registrations by gender and age, and point estimates for l
Data Estimates Males Age (years) n1 n>1 n Recapture rate (percentage) lˆ <15 411 16 427 3.89 0.076 15-17 1 918 65 1 983 3.39 0.067 18-19 3 823 135 3 958 3.53 0.069 20-24 6 916 237 7 153 3.43 0.067 25-29 3 894 86 3 980 2.21 0.043 30-34 2 262 52 2 314 2.30 0.045 35-39 1 543 41 1 584 2.66 0.052 >39 1 195 31 1 226 2.59 0.051 Total 21 962 663 22 625 — — No age covariate 21 962 663 22 625 3.02 0.059 7 See www.emcdda.europa.eu/publications/country-overviews/it.
Table 1. Data on registrations by gender and age, and point estimates for l (continued)
Data Estimates
Females Age
(years) n1 n>1 n Recapture rate (percentage) lˆ
<15 39 1 40 2.56 0.050 15-17 137 3 140 2.19 0.043 18-19 267 5 272 1.87 0.035 20-24 649 10 659 1.54 0.030 25-29 381 6 387 1.57 0.031 30-34 206 3 209 1.46 0.029 35-39 139 3 142 2.16 0.042 >39 107 1 108 0.93 0.018 Total 1 925 32 1 957 — — No age covariate 1 925 32 1 957 1.66 0.032
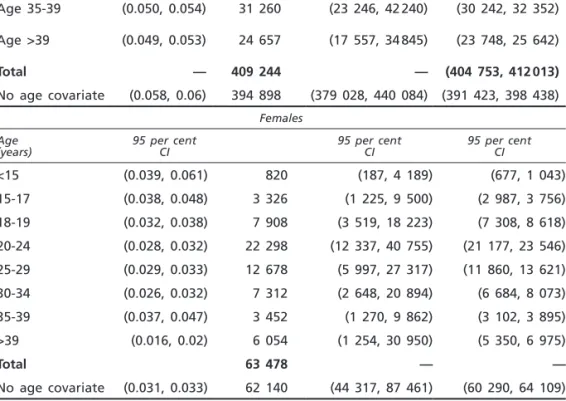
Confidence intervals based on Horvitz-Thompson estimates (see table 2), can be calculated in two ways: either applying the formula Nˆ±1 96. var( ˆ )N after a log transformation or by substituting in the formula pˆ0=e−lˆ the lower and the upper 95-per-cent confidence limits for l. In either case, the intervals are not symmetrical and this reflects the fact that Nˆ must be non-negative and is likely to be right-skewed.
Table 2. Accuracy of the Horvitz-Thompson estimates
CI for l
Horvitz- Thompson
CI for N CI for N calculated from l interval Males
Age (years) 95 per cent CI 95 per cent CI 95 per cent CI
Age <15 (0.071, 0.081) 5 835 (3 685, 9 401) (5 485, 6 234) Age 15-17 (0.065, 0.069) 30 600 (24 203, 38 837) (29 714, 31 542) Age 18-19 (0.067, 0.071) 59 364 (50 414, 70 038) (58 138, 60 645) Age 20-24 (0.066, 0.068) 110 378 (97 530, 125 051) (108 671, 112 141) Age 25-29 (0.042, 0.044) 94 562 (76 905, 116 495) (92 583, 96 630) Age 30-34 (0.044, 0.046) 52 588 (40 362, 68 742) (51 156, 54 104) ˆ NHT
Age 35-39 (0.050, 0.054) 31 260 (23 246, 42 240) (30 242, 32 352) Age >39 (0.049, 0.053) 24 657 (17 557, 34 845) (23 748, 25 642) Total — 409 244 — (404 753, 412 013) No age covariate (0.058, 0.06) 394 898 (379 028, 440 084) (391 423, 398 438) Females Age
(years) 95 per cent CI 95 per cent CI 95 per cent CI
<15 (0.039, 0.061) 820 (187, 4 189) (677, 1 043) 15-17 (0.038, 0.048) 3 326 (1 225, 9 500) (2 987, 3 756) 18-19 (0.032, 0.038) 7 908 (3 519, 18 223) (7 308, 8 618) 20-24 (0.028, 0.032) 22 298 (12 337, 40 755) (21 177, 23 546) 25-29 (0.029, 0.033) 12 678 (5 997, 27 317) (11 860, 13 621) 30-34 (0.026, 0.032) 7 312 (2 648, 20 894) (6 684, 8 073) 35-39 (0.037, 0.047) 3 452 (1 270, 9 862) (3 102, 3 895) >39 (0.016, 0.02) 6 054 (1 254, 30 950) (5 350, 6 975) Total 63 478 — — No age covariate (0.031, 0.033) 62 140 (44 317, 87 461) (60 290, 64 109) In table 3, estimated capture rates (n NHT), estimated capture indexes, defined as
CapIˆ = n NˆHT , and 95-per-cent confidence intervals for CapI(CapIˆ ±1 96s. ˆ( ˆ ))CapI
are presented. Differences regarding estimated capture indexes between males and females are mostly significant, apart from the case of some younger age groups. Table 3. Inference on capture rate based on Horvitz-Thompson estimates
Males
Age
(years) NˆHT Estimated capture capture indexEstimated
CapI 95 per cent CI <15 5 835 7.32 0.27 (0.24, 0.31) 15-17 30 600 6.48 0.25 (0.24, 0.27) 18-19 59 364 6.67 0.26 (0.25, 0.27) 20-24 110 378 6.48 0.25 (0.25, 0.26) 25-29 94 562 4.21 0.21 (0.2, 0.21) 30-34 52 588 4.40 0.21 (0.2, 0.22) 35-39 31 260 5.07 0.23 (0.21, 0.24) >39 24 657 4.97 0.22 (0.21, 0.24) Total 409 244 5.53 0.24 (0.23, 0.24) No age covariate 394 898 5.73 0.24 (0.23, 0.24)
Table 3. Inference on capture rate based on Horvitz-Thompson estimates
(continued)
Females Age
(years) NˆHT Estimated capture Estimated capture index 95 per cent CI
<15 820 4.88 0.22 (0.13, 0.32) 15-17 3 326 4.21 0.21 (0.16, 0.25) 18-19 7 908 3.44 0.19 (0.16, 0.22) 20-24 22 298 2.96 0.17 (0.15, 0.19) 25-29 12 678 3.05 0.17 (0.15, 0.2) 30-34 7 312 2.86 0.17 (0.14, 0.2) 35-39 3 452 4.11 0.2 (0.16, 0.25) >39 6 054 1.78 0.13 (0.1, 0.17) Total 63 849 3.07 0.18 (0.16, 0.19) No age covariate 62 140 3.15 0.18 (0.17, 0.19)
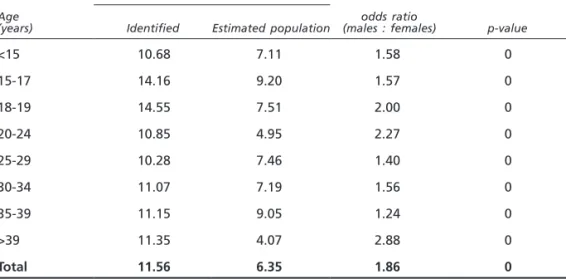
To better check this gender effect, the odds ratio for gender was calculated for each age group (see table 4). The p-values show that the difference between the sexes, for each age group, is highly significant.
Table 4. Inference on odds ratio for males and females
Ratio males : females Age
(years) Identified Estimated population (males : females)odds ratio p-value
<15 10.68 7.11 1.58 0 15-17 14.16 9.20 1.57 0 18-19 14.55 7.51 2.00 0 20-24 10.85 4.95 2.27 0 25-29 10.28 7.46 1.40 0 30-34 11.07 7.19 1.56 0 35-39 11.15 9.05 1.24 0 >39 11.35 4.07 2.88 0 Total 11.56 6.35 1.86 0
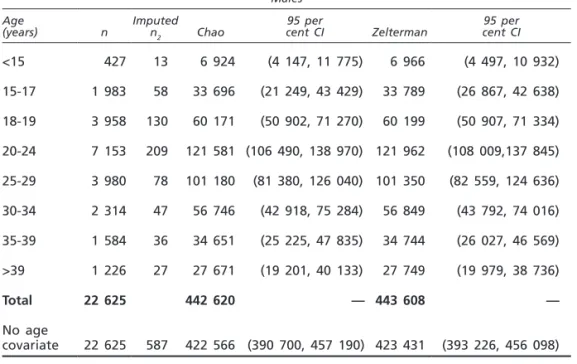
In order to take into account the unobserved heterogeneity, Chao’s and Zelterman’s population size estimates were calculated and compared (see table 5). As expected, Zelterman’s estimates were always greater than Chao’s estimates.
Table 5. Chao's and Zelterman’s estimates
Males Age
(years) n Imputed n2 Chao
95 per
cent CI Zelterman cent CI95 per
<15 427 13 6 924 (4 147, 11 775) 6 966 (4 497, 10 932) 15-17 1 983 58 33 696 (21 249, 43 429) 33 789 (26 867, 42 638) 18-19 3 958 130 60 171 (50 902, 71 270) 60 199 (50 907, 71 334) 20-24 7 153 209 121 581 (106 490, 138 970) 121 962 (108 009,137 845) 25-29 3 980 78 101 180 (81 380, 126 040) 101 350 (82 559, 124 636) 30-34 2 314 47 56 746 (42 918, 75 284) 56 849 (43 792, 74 016) 35-39 1 584 36 34 651 (25 225, 47 835) 34 744 (26 027, 46 569) >39 1 226 27 27 671 (19 201, 40 133) 27 749 (19 979, 38 736) Total 22 625 442 620 — 443 608 — No age covariate 22 625 587 422 566 (390 700, 457 190) 423 431 (393 226, 456 098) Females Age
(years) n Imputed n2 Chao
95 per
cent CI Zelterman cent CI95 per
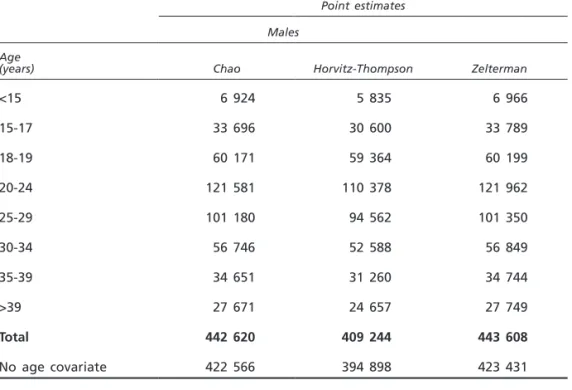
<15 40 1 820 (190, 4 085) 820 (176, 4 292) 15-17 140 2 4 832 (1 457, 16 854) 4 865 (2 031, 11 951) 18-19 272 3 12 154 (4 362, 34 793) 12 241 (6 109, 24 813) 20-24 659 8 26 984 (13 939, 52 847) 27 062 (15 537, 47 400) 25-29 387 5 14 903 (6 580, 34 413) 14 939 (7 365, 30 736) 30-34 209 3 7 281 (2 632, 20 850) 7 282 (2 606, 21 071) 35-39 142 2 4 972 (1 498, 17 342) 5 006 (2 074, 12 386) >39 108 1 5 832 (1 209, 29 861) 5 833 (1 155, 31 395) Total 1 957 77 778 — 78 048 — No age covariate 1 957 25 70 580 (48 820, 102 450) 70 747 (51 045, 98 335) Both Chao’s and Zelterman’s estimates are greater than the Horvitz-Thompson estimates (except for the estimates regarding the sub-groups of females aged 30-34 and >39) (see table 6). Better estimates can be obtained taking into con-sideration the observed heterogeneity, whereas neglecting heterogeneity (specifi-cally age) produces underestimation.
Table 6. Comparison of the three population estimates
Point estimates Males
Age
(years) Chao Horvitz-Thompson Zelterman
<15 6 924 5 835 6 966 15-17 33 696 30 600 33 789 18-19 60 171 59 364 60 199 20-24 121 581 110 378 121 962 25-29 101 180 94 562 101 350 30-34 56 746 52 588 56 849 35-39 34 651 31 260 34 744 >39 27 671 24 657 27 749 Total 442 620 409 244 443 608 No age covariate 422 566 394 898 423 431 Females Age
(years) Chao Horvitz-Thompson Zelterman
<15 820 820 820 15-17 4 832 3 326 4 865 18-19 12 154 7 908 12 241 20-24 26 984 22 298 27 062 25-29 14 903 12 678 14 939 30-34 7 281 7 312 7 282 35-39 4 972 3 452 5 006 >39 5 832 6 054 5 833 Total 77 778 63 848 78 048 No age covariate 70 580 62 140 70 747
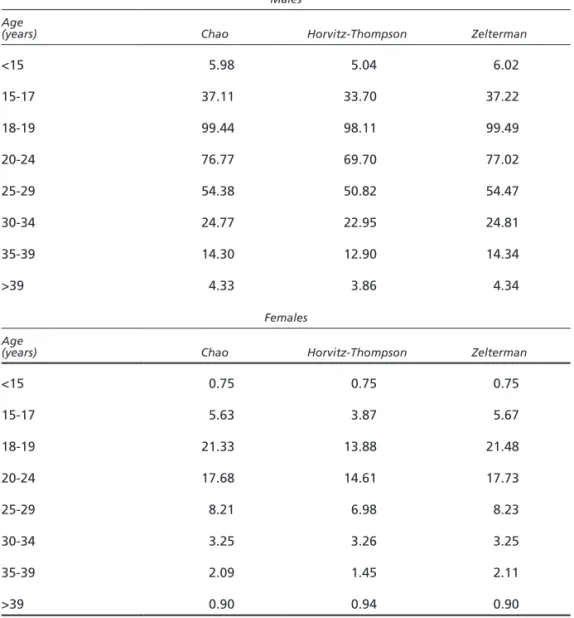
Prevalence estimates per 1,000 inhabitants in the same age groups are presented in table 7. For the first and last age group, the reference populations are those aged 12-14 and 40-54. The highest relative prevalence is observed for males and females aged 18-19. This reflects the peculiarity of the target population, which is quite different from the problem drug user population, which is usually estimated as being much older.
Table 7. Estimates for N per 1,000 inhabitants
Males Age
(years) Chao Horvitz-Thompson Zelterman
<15 5.98 5.04 6.02 15-17 37.11 33.70 37.22 18-19 99.44 98.11 99.49 20-24 76.77 69.70 77.02 25-29 54.38 50.82 54.47 30-34 24.77 22.95 24.81 35-39 14.30 12.90 14.34 >39 4.33 3.86 4.34 Females Age
(years) Chao Horvitz-Thompson Zelterman
<15 0.75 0.75 0.75 15-17 5.63 3.87 5.67 18-19 21.33 13.88 21.48 20-24 17.68 14.61 17.73 25-29 8.21 6.98 8.23 30-34 3.25 3.26 3.25 35-39 2.09 1.45 2.11 >39 0.90 0.94 0.90
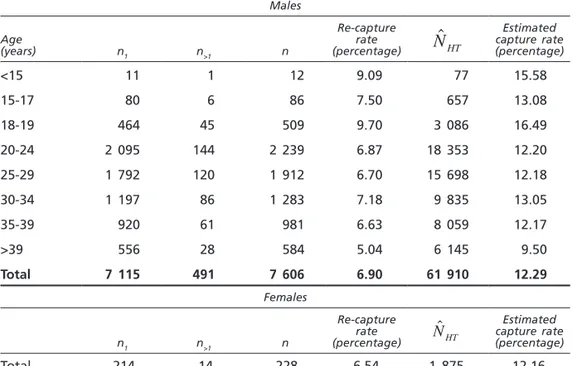
The Ministry of the Interior also provides tables of subjects who were iden-tified one or more times in 2007 but who had been ideniden-tified for the first time in previous years (table 8). As only a few or zero females were registered for each age group, it is possible to calculate NˆHT only for the total female popula-tion. Both re-capture rates and estimated capture rates (based on NˆHT ) are
much higher for these individuals than for individuals identified in 2007 for the first time (tables 1 and 3). This shows that what is being observed is a mixture of at least two different subpopulations of drug users: “old” drug users, i.e. those at risk of being identified for the first time before 2007, and “new” drug users, i.e. those at risk of being identified for the first time in 2007.
Table 8. Gender and, for males, age distribution of previously identified subjects who were identified again in 2007
Males Age (years) n1 n>1 n Re-capture rate (percentage) NˆHT Estimated capture rate (percentage) <15 11 1 12 9.09 77 15.58 15-17 80 6 86 7.50 657 13.08 18-19 464 45 509 9.70 3 086 16.49 20-24 2 095 144 2 239 6.87 18 353 12.20 25-29 1 792 120 1 912 6.70 15 698 12.18 30-34 1 197 86 1 283 7.18 9 835 13.05 35-39 920 61 981 6.63 8 059 12.17 >39 556 28 584 5.04 6 145 9.50 Total 7 115 491 7 606 6.90 61 910 12.29 Females n1 n>1 n Re-capture rate (percentage) NˆHT Estimated capture rate (percentage) Total 214 14 228 6.54 1 875 12.16
When comparing the age distributions of the two samples and two estimated populations, the non-homogeneity is evident (table 9). The estimate of the female population identified for the first time before 2007 was obtained by distributing
ˆ
NHT =1875proportionally to the observed age distribution.
Table 9. Age distributions of the registered samples and the estimated populations (percentage)
Registered sample Estimated population
Age (years)
First registration in 2007 (sample
size=24,582)
First registration in the previous years
(sample size=7,834) 2007 (total=473,092)First registration in
First registration in the previous years
(total=63,785) <15 1.90 0.15 1.41 0.12 15-17 8.64 1.10 7.17 1.03 18-19 17.21 6.61 14.22 4.95 20-24 31.78 29.28 28.04 29.48 25-29 17.77 25.16 22.67 25.37 30-34 10.26 16.85 12.66 15.90 35-39 7.02 12.96 7.34 13.07 >39 5.43 7.89 6.49 10.07 Total 100.00 100.00 100.00 100.00
The remarkably different behaviour of registered subjects in the first three age groups for the two subpopulations indicates that the estimated prevalence in the younger groups (under 20 years of age) can be used as a proxy for inci-dence rates in the same age classes. It is well known that inciinci-dence rates are preferable to prevalence for evaluating drug policies. Unfortunately, these rates are difficult to estimate, especially for recent years and for non-problem drug users [29]. Thus, being able to estimate prevalence for these age groups is very valuable. In fact:
" Available methods only allow estimates of historical trends for the incidence of opiate use.
" Estimating recent trends for stimulants and new drugs is of much greater interest for policymakers.
" New trends cannot be identified using the same approach and data sets as adopted for (historical) opiate users.
" Incidence estimates can be obtained from prevalence estimates by using information about age.
" Conditional distribution of age at first use can be utilized to allocate prevalent cases to the various years and to estimate incidence.
In other words, we need to make a retrospective projection of the prevalent cases to obtain incidence rates.
Conclusion and further developments
Estimates of the population of drug users are essential for calibrating and assess-ing drug policy, and the task of calculatassess-ing these estimates is now of growassess-ing interest at the European level. Apart from the special case of problem drug users, the population of drug users has not generated many studies adopting capture-recapture methods in Europe.
This study is a first attempt at deriving estimates for this particular subpopu-lation of drug users who are at risk of being identified in Italy, so some limitations in the results are to be expected. The analyses we performed should be considered a pilot study that presents initial findings.
In order to apply control measures, administer available resources and establish realistic working objectives, it is important to know as accurately as possible the extent to which the size of the drug user population is being underreported.
Both estimators NˆZ and NˆC appear to be fairly realistic with respect to
is met for each individual over time. How does the violation of this hypothesis affect the results? Analysing patterns over a shorter time interval, for example six months, might produce a better estimate than using data for an entire year. With classical truncated Poisson analyses, the time period is believed to exert a strong effect on the prevalence estimates, but most prevalence estimates across Europe have used a one year period.
The methods that can be utilized to estimate prevalence depend heavily on the nature of the available data. Although there should be flexibility in the choice of methods, there are perhaps some methods that provide more robust estimates than others, so we compared three different methodologies so as to be able to select the best estimate.
Both Chao’s and Zelterman’s estimators produced about the same estimates of N, for each age group and for the total population. Nˆ
Zis slightly greater,
acting as a sort of “upper bound” estimator, which was expected.
Both Chao’s and Zelterman’s estimators perform better than the Horvitz-Thompson estimator, which cannot handle heterogeneity. The assumption of heterogeneity in the population will not severely affect Nˆ
C and NˆZ robust
esti-mators, but will result in underestimation of the true N by NˆHT .
Truncated Poisson estimators are only capable of estimating the size of the group of individuals who have a latent non-zero probability of being identified. Therefore, the results based on these estimators cannot be generalized to the whole population of drug users. On the basis of the last general population survey,8 the estimated population of drug users in Italy was about 3 million in 2007 (2.5 million of whom were cannabis users), so we can say that at least 80 per cent of the drug user population has a zero probability of being identified. In Italy, it is difficult to organize data sources with compatible identifiers. Moreover, different data sources in general correspond to different target popula-tions and the database based on article 75 of the relevant law is not homogene-ous with the other databases generally available for estimating the problem drug user population.
The present study on the prevalence of drug use, which is based on a single source, is more accurate than a study based on repeated identification across multiple sources for our target population. In the presence of observed and unob-served between-subject heterogeneity, estimators derived from mixture-models could be an improvement over Chao’s and Zelterman’s estimators, and this could indicate a future development for Italian data. Including further covariates (such
as geographical, behavioural, main substance, polydrug use) could also produce more accurate estimates. Preliminary analyses performed on these data and based on geographical strata show that these covariates might be more important than gender and age.
Presently, work is in progress to separately analyse data from the largest metropolitan areas and small cities and districts in order to incorporate latent information about the lifestyle linked to metropolitan and small areas. Information about the main substance of use will also be considered.
Future work should also concentrate on developing data sources with compatible identifiers so that capture-recapture studies can examine repeated identifications across multiple sources.
References
1. Yvonne M. Bishop, Stephen E. Fienberg and Paul W. Holland, Discrete Multivariate
Analysis: Theory and Practice (Cambridge, Massachusetts, MIT Press, 1975).
2. R.M. Cormack, “Log-linear models for capture-recapture”, Biometrics, vol. 45, No. 2 (1989), pp. 395-413.
3. Y. Hser, “Population estimation of illicit drug users in Los Angeles county”, Journal
of Drug Issues, vol. 23, No. 2 (1993), pp. 323–334.
4. International Working Group for Disease Monitoring and Forecasting, “Capture- recapture and multiple–record system estimation 1: history and theoretical develop-ment”, American Journal of Epidemiology, vol. 142, No. 10 (1995), pp. 1047-1058. 5. Elena Stanghellini and Peter G.M. van der Heijden, “A multiple-record systems
estimation method that takes observed and unobserved heterogeneity into account”,
Biometrics, vol. 60, No. 2 (2004), pp. 510-516.
6. A.G. McKendrick, “Applications of mathematics to medical problems”, Proceedings
of the Edinburgh Mathematical Society, vol. 44, 1925, pp. 98-130.
7. David P.M. Scollnik, “Inference concerning the size of the zero class from an incom-plete Poisson sample”, Communication in Statistics: Theory and Methods, vol. 26, No. 1 (1997), pp. 221-236.
8. Peter G.M. van der Heijden and others, “Point and interval estimation of the popula-tion size using the truncated Poisson regression model”, Statistical Modelling, vol. 3, No. 4 (2003), pp. 305-322.
9. Dankmar Böhning and others, “Mixture models for capture-recapture count data”,
Statistical Methods and Applications, vol. 14, No. 1 (2005), pp. 29-43.
10. Dankmar Böhning and Ronny Kuhnert, “Equivalence of truncated count mixture distributions and mixture of truncated count distributions”, Biometrics, vol. 62, No. 4 (2006), pp. 1207-1215.
11. Martin Bouchard, “A capture-recapture model to estimate the size of criminal populations and the risks of detection in a marijuana cultivation industry”, Journal
of Quantitative Criminology, vol. 23, No. 3 (2007), pp. 221-241.
12. Filip Smit, Jaap Toet and Peter van der Heijden, “Estimating the number of opiate users in Rotterdam using statistical models for incomplete count data”, in Methodo
logical Pilot Study of Local Level Prevalence Estimates (Lisbon, European Monitoring
Centre for Drugs and Drug Addiction, 1997).
13. Y. H. Choi, and C. M. Comiskey, “Methods for providing the first prevalence estimates of opiate use in Western Australia”, International Journal of Drug Policy, vol. 14, No. 4 (2003), pp. 297-305.
14. Gordon Hay and Filip Smit, “Estimating the number of drug injectors from needle exchange data”, Addiction Research and Theory, vol. 11, No. 4 (2003), pp. 235-243. 15. Dankmar Böhning and others, “Estimating the number of drug users in Bangkok
2001: a capture-recapture approach using repeated entries in one list”, European
Journal of Epidemiology, vol. 19, No. 12 (2004), pp. 1075-1083.
16. M. T. Brugal and others, “Prevalence of problematic cocaine consumption in a city of southern Europe, using capture-recapture with a single list”, Journal of Urban
Health, vol. 81, No. 3 (2004), pp. 416-427.
17. Filip Smit, Margriet van Laar and Lucas Wiessing, “Estimating problem drug use prevalence at national level: comparison of three methods”, Drugs: Education,
Prevention and Policy, vol. 13, No. 2 (2006), pp. 109-120.
18. D. G. Horvitz and D. J. Thompson, “A generalization of sampling without replace-ment from a finite universe”, Journal of the American Statistical Association, vol. 47, No. 260 (1952), pp. 663-685.
19. Daniel Zelterman, “Robust estimation in truncated discrete distributions with appli- cation to capture-recapture experiments”, Journal of Statistical Planning and Inference, vol. 18, No. 2 (1988), pp. 225-237.
20. Anne Chao, “Estimating the population size for capture-recapture data with unequal catchability”, Biometrics, vol. 43, No. 4 (1987), pp. 783-791.
21. Anne Chao, “Estimating population size for sparse data in capture-recapture experi-ments”, Biometrics, vol. 45, No. 2 (1989), pp. 427-438.
22. Richard M. Wilson and Mark F. Collins, “Capture-recapture estimation with samples of size one using frequency data”, Biometrika, vol, 79, No. 3 (1992), pp. 543-553. 23. European Monitoring Centre for Drugs and Drug Addiction, Methodological Pilot
Study of Local Level Prevalence Estimates (Lisbon, EMCDDA, 1997).
24. Martin A. Tanner, Tools for Statistical Inference: Methods for the Exploration of
Posterior Distributions and Likelihood Functions, 3rd ed., Springer Series in Statistics
(New York, Springer, 1996).
25. Dankmar Böhning and Victor J. Del Rio Vilas, “Estimating the hidden number of scrapie affected holdings in Great Britain using a simple, truncated count model allowing for heterogeneity”, Journal of Agricultural, Biological, and Environmental
26. Dankmar Böhning, “A simple variance formula for population size estimators by conditioning”, Statistical Methodology, vol. 5, No. 5 (2008), pp. 410-423.
27. European Monitoring Centre for Drugs and Drug Addiction, Methodological Guide
lines to Estimate the Prevalence of Problem Drug Use on the Local Level (Lisbon,
EMCDDA, 1999).
28. Carla Rossi and Roberto Ricci, “Modelling and estimating illicit drug market as a tool to evaluate drug policy: the case of Italy”, paper prepared for the Third Annual Conference of the International Society for the Study of Drug Policy, Vienna, 2-3 March 2009.
29. G.P. Scalia Tomba, and others, Guidelines for Estimating the Incidence of Problem
Drug Use (Lisbon, European Monitoring Centre for Drugs and Drug Addiction,