Alma Mater Studiorum Università di Bologna
SCUOLA DI SCIENZE MATEMATICHE FISICHE E NATURALI
Corso di laurea magistrale in BIOLOGIA MARINA
Adattamenti degli animali all’ambiente marino
Acute stress regulates vasotocinergic and isotocinergic
systems in the gilthead sea bream (Sparus aurata L.)
Relatore
Tesi di Laurea di:
Prof.ssa ELENA FABBRI MARCO BASTAROLI
Correlatore
Dott. JUAN ANTONIO MARTOS SITCHA
Prof. JUAN MIGUEL MANCERA ROMERO
Sessione III
Anno Accademico 2013/2014
!Index
!
!
i!
GENERAL INDEX
General Index ... i
Figures Index ... iii
Tables Index ... iv
List of Abbreviations ... v
Abstract ... vii
1. INTRODUCTION ... 1
1.1. Endocrine system in teleost: general view ... 3
1.2. Hypothalamic-pituitary axis ... 3
1.3. Vasotocinergic and Isotocinergic systems ... 5
1.4. Stress system ... 7
1.4.1. Stress concept ... 7
1.4.2. Endocrinology of stress ... 8
1.4.3. Physiological responses ... 10
1.5. Interactions between vasotocinergic/isotocinergic systems and stress system ... 11
1.6. Biology of gilthead sea bream (Sparus aurata) ... 13
2. AIM OF THE STUDY ... 15
3. MATERIALS AND METHODO ... 19
3.1. Animals maintenance ... 21
3.2. Experimental design and sampling ... 21
3.3.1. Plasma metabolites ... 23
3.3.2. Liver metabolites ... 23
3.3.3. Measurement of plasma cortisol ... 24
3.3.4. Total RNA extraction ... 25
3.3.5. Relative expression analysis by real-time PCR (qPCR) ... 26
3.4. Statistical analysis ... 27
4. RESULTS ... 29
4.1. Plasma metabolites ... 31
4.2. Hepatic metabolites ... 32
4.3. Hepatic metabolites ... 34
4.4. Hypothalamic pro-VT and pro-IT mRNA expression ... 35
4.5. Hepatic AVT and IT receptors mRNA expression ... 35
5. DISCUSSION ... 39
5.1. Cortisol ... 41
5.2. Metabolites ... 42
5.3. Hypothalamic mRNA pro-AVT and pro-IT expression ... 44
5.4. Hepatic mRNA AVT and IT receptor expression ... 47
5.5. AVT, IT and stress: an integrative view ... 49
6. CONCLUSIONS ... 53
Index
!
!
iii!
FIGURES INDEX
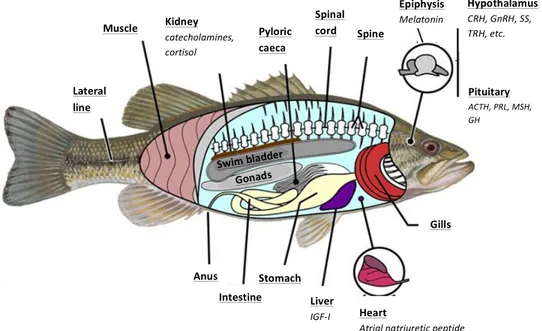
Figure 1.1. Scheme of the internal anatomy of a teleost fish (European sea bass, Dicentrarchus
labrax) ... 3
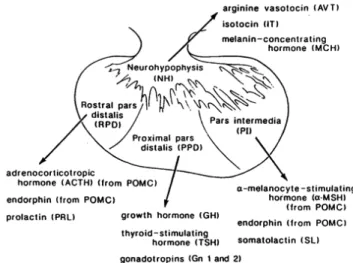
Figure 1.2. Scheme of the pituitary gland of teleost ... 4
Figure 1.3. Neurohypophyseal hormones structure ... 5
Figure 1.4. Topography and structure of AVT/AVP and IT/OXY receptors ... 6
Figure 1.5. Scheme of the main factors involved in the neuroendocrine stress response system of
teleost ... 9
Figure 1.6. Sparus aurata (Linnaeus, 1758) ... 13
Figure 1.7. Geographic distribution of S. aurata ... 13
Figure 3.1. Scheme of the experimental design used in this study ... 33
Figure 4.1. Time course changes in plasma cortisol levels in S. aurata exposed to air for 3 min ... 34
Figure 4.2. Time course changes in hypothalamic pro-VT and pro-IT mRNA expression levels in S.
aurata exposed to air for 3 min ... 36
Figure 4.3. Time course changes in hepatic AVTR V1-type, AVTR V2-type and ITR mRNA
expression levels in S. aurata exposed to air for 3 min ... 37
Figure 5.1. Scheme-summary of the observed effects on endocrine systems facing a situation of
acute stress caused by air exposition ... 51
TABLES INDEX
Table 3.1. References of the commercial kits and dilutions used for the measurement of different
plasma metabolites ... 24
Table 3.2. References of the commercial kits and dilutions used for the measurement of each of
different hepatic metabolites ... 24
Table 3.3. Primer sequences of gilthead sea bream used for measuring expression ... 24
Table 4.1. Time course changes in plasma metabolites (glucose, lactate, triglycerides and total
proteins) levels in S. aurata exposed to air for 3 min ... 33
Table 4.2. Time course changes in hepatic metabolites (glucose, glycogen, lactate, triglycerides)
List of abbreviations!
! v!
List of Abbreviations
ACTH Adrenocorticotropic hormone
ADH Antidiuretic hormone
ANOVA Analysis of variance
AVP Vasopressin
AVT Arginine vasotocin
AVTR AVT receptor
BSA Bovine serum albumin
CAs Catecholamines
cDNA Complementary DNA
gDNA Genomic DNA
CLIP Corticotropin-like intermediate lobe peptide
CNS Central nervous system
CRH Corticotropin releasing hormone
CRH-BP CRH binding protein
DNA Deoxyribonucleic acid
EDTA Ethylenediaminetetraacetic acid
ELISA Enzyme-Linked Immunosorbent Assay
FBPase Fructose 1,6-bisphosphatase
G6Pase Glucose-6-phosphatase
GK Glucokinase
GnRH Gonadotropin-releasing hormone
GPase Glycogen phosphorylase
HPI axis Hypothalamic-pituitary-interrenal axis
HK Hexokinase
HSC axis Hypothalamic-sympathetic-chromaffin axis
IGF-I Insulin-like growth factor 1
IT Isotocin
ITR IT receptor
LDH Lactate dehydrogense
MCH Melanophores concentrating hormone
mRNA Messenger RNA
MSH Melanocyte-stimulating hormone
NLT Nucleus lateralis tuberis
NPO Nucleus preopticus
NPY Neuropeptide Y
NSO Nucleus supraoptic
OXY Oxytocin
PCR Polymerase chain reaction
PDH Pyruvate dehydrogense
PEPCK Phosphoenolpyruvate carboxykinase
PFK-1 Phosphofructo-1-kinase
PK Pyruvate kinase
PKA Protein kinase A
PKC Protein kinase C
POMC Pro-opiomelanocortin
PPB Potassium phosphate buffer
PRL Prolactin
pro-IT IT precursor
pro-VT Vasotocin precursor
PVN Nucleus paraventriculra
qPCR Real-time PCR
RIN RNA Integrity Number
RNA Ribonucleic acid
SW Seawater
TAG Triacylglycerides
TAG lipase Triacyglycerol lipase
! vii!
ABSTRACT
The hypothalamus-pituitary-interrenal axis is involved in stress response regulation. In addition, arginine vasotocin (AVT) and isotocin (IT) are also considered as important players in this stress regulation. The present study assessed, using the teleost gilthead sea bream (Sparus aurata) as a biological model, hypothalamic mRNA expression changes of AVT and IT and their receptors at hepatic level after an acute stress situation. Specimens were submitted to air for 3 min and place back in their respective tanks after that, being sampled at different times (15 min, 30 min, 1, 2, 4 and 8 hours post-stress) in order to study the time course response. Plasma cortisol values increased after few minutes post-exposure, decreasing during the experimental time while a metabolic reorganization occurred in both plasmatic and hepatic levels. At hypothalamic level, acute stress affects mRNA expression of AVT and IT precursors, as well as hepatic expression of their receptors, suggesting the involvement of both vasotocinergic and isotocinergic systems in the acute stress response. Our results demonstrate the activation and involvement of both endocrine pathways in the regulation of metabolic and stress systems of Sparus aurata, which is stated, at least, through changes in mRNA expression levels of these genes analysed.
! !
Introduction
! 3!
1.1. Endocrine system in teleost: general view
The endocrine system of teleosts involves a high number of glands, and its hormonal secretions control several physiological processes in the animal. The pituitary gland is considered in vertebrates, including teleost, the master gland involved in the control of different physiological processes. However, other peripheral glands (and their endocrine products) are also involved in these functions. Thus, we could cite the kidney (production of cortisol and angiotensin), liver (somatomedins or inslulin growth factor I, IGF-I), gonads (sex steroids), the urophysis (urotensins I and II), the heart (natriuretic peptides) or the corpuscles of Stannius (stanniocalcin), among others (Figure 1.1.), as other important endocrine players.!
! Figure 1.1. Scheme of the internal anatomy of a teleost fish (European sea bass, Dicentrarchus labrax) showing the
main organs involved in different neuroendrocrine axes (modified from oqlarypt.wordpress.com).
1.2. Hypothalamic-pituitary axis!
Hypothalamic-pituitary axis is one of the most important players in the regulation of various endocrine systems at central level.!
Hypothalamus presents several nuclei formed by hypothalamic neurons that projecting their axons in different brain regions, including the pituitary gland. The hypothalamus receives information
! ! Kidney' catecholamines, -cortisol' Pyloric' caeca' Spinal' cord' Spine' Muscle' Lateral' line' Anus' Intestine' Pituitary' ACTH,-PRL,-MSH,-GH! Hypothalamus CRH,-GnRH,-SS,-TRH,-etc.! Epiphysis' Melatonin' Heart' Atrial-natriuretic-peptide' Liver' IGF?I-Stomach' Gills' Gonads' Swim'bladder'
from the internal and external environment of the animal. This region contains neurons specialized in:!
i) Secretion of several hormones, named neurohormones, into the bloodstream.!
ii) Secretion of different peptides or factors that stimulate or inhibit the release of different pituitary hormones. For this reason, hypothalamus is considered to be the region where the "endocrine cascade" begins (Bertok, 1998).!
Pituitary is also considered an important gland for the hormonal control of a great variety of physiological functions, such as reproduction, development, growth, osmoregulation, metabolism, etc. This gland is composed by two different types of tissues from different sources: i) the neurohypophysis, derived from neural tissue, whose hormones are synthesized in hypothalamic neurons, and ii) the adenohypophysis, derived from primary endoderm (Gorbman et al., 1983; Norris, 1997; Bentley, 1998). The neurohypophysis is connected to the hypothalamus through the infundibular stalk, where neuropeptides are transported from different hypothalamic nuclei, as the supraoptic nucleus (SON) and the nucleus lateralis tuberalis (NLT), and then released from the neurohypophysis into the bloodstream (see section 1.3.). Different cell types of the adenohypophysis are located in certain parts of the gland, so that two or more cell types constitute a pituitary lobe. Thus, each type of cells integrated in different pituitary lobes are distinguished by i) morphology, ii) affinities to different immunocytochemical reactions, as well as iii) physiological function related to the hormone produced and secreted. The adenohypophysis of teleost presents three differentparts: i) rostral pars distalis (RPD), ii) proximal pars distalis (RPD), and iii) pars intermedia (PI), whose main synthesized hormones are described in Figure 1.2.!
!
Introduction
! 5!
1.3. Vasotocinergic and Isotocinergic systems!
A neuropeptide is defined as a peptide synthesized in neurons. The arginine vasotocin (AVT) and the isotocin (IT) are neuropeptides consisting of nine amino acids in its mature form (nonapeptide). These hormones are, respectively, homologs to the arginine vasopressin (AVP) and oxytocin (OXY) in mammals. However, the AVT differs from the AVP in the third amino acid of the mature protein, with isoleucine in the case of AVT and phenylalanine in the AVP. On the other hand, IT differs from OXY in the fourth amino acid, with glutamine for the IT and serine for OXY (Acher, 1996) (Figure 1.3).
Figure 1.3. Neurohypophyseal hormones structure (A) and distribution in vertebrates (B). (Taken from Vertebrate
Endocrinology by Norris, 1997).
The synthesis of the neuropeptides, starting from messenger RNA (mRNA) which is translated like pro-peptides in the cytoplasm of the neuronal soma, occurs at the level of neurons located in various hypothalamic nuclei. In teleost, the most important are the nucleus lateralis tuberis (NLT) and the nucleus preopticus (NPO). Subsequently, they are transported by axons through the pituitary stalk, where the mature peptide is stored in the neurohypophysis awaiting a suitable stimulus for their release into the bloodstream, through which it will reach the target tissues and perform its physiological action. Most fish show both AVT and IT neurohypophyseal hormones, excepting cyclostomes that only possess AVT. For this reason, it is thought that the IT hormone emerged from the third genome duplication occurred when cyclostomes appear (Norris, 1997).!
La acción de los neuropéptidos está determinada por su unión a receptores específicos del sistema nervioso central (SNC) o en otros lugares del organismo, lo que muestra que lo importante en este sistema no es solamente la propia hormona, sino el tejido diana que la reconoce para poder realizar su efecto. En el SNC los neuropéptidos juegan un papel de neurotransmisores y/o neuromoduladores, mientras que otras veces actúan como hormonas al ser distribuidas por el sistema circulatorio a través de todo el organismo (Van den Dungen et al., 1982; Acher, 1993; Acher y Chauvet, 1995; Goodson y Bass, 2000).
1.2. ARGININA VASOTOCINA (AVT) E ISOTOCINA (IT)
Los peces poseen al menos dos hormonas neurohipofisarias diferentes, la AVT y la isotocina (IT), exceptuando el caso de los ciclóstomos que solamente presentan AVT. Ambos péptidos guardan una estrecha relación estructural y funcional con la AVP y la OXY de mamíferos, estando formadas por nueve aminoácidos que han sido identificados en el sistema hipotálamo-neurohipofisario de teleósteos por Acher et al. (1961, 1962). La AVT fue descubierta por primera vez en la rana y la única diferencia respecto a la AVP es el tercer aminoácido de la cadena, siendo isoleucina en al caso de la AVT y fenilalanina en el de la AVP (Acher, 1996). La IT, por su parte, se diferencia
ARGININE VASOTOCIN
Cys – Tyr – Ile – Gln – Asn – Cys – Pro – Arg – Gly – NH2
1 2 3 4 5 6 7 8 9 ARGININE VASOPRESSIN
Cys – Tyr – Phe – Gln – Asn – Cys – Pro – Arg – Gly – NH2
LYSINE VASOPRESSIN
Cys – Tyr – Phe – Gln – Asn – Cys – Pro – Lys – Gly – NH2
PHENYPRESSIN
Cys – Phe –Phe – Gln – Asn – Cys – Pro – Arg – Gly – NH2
ISOTOCIN
Cys – Tyr – Ile – Ser – Asn – Cys – Pro – Ile – Gly – NH2
OXITOCIN
Cys – Tyr – Ile – Gln – Asn – Cys – Pro – Leu – Gly – NH2
MESOTOCIN
Cys – Tyr – Ile – Gln – Asn – Cys – Pro – Ile – Gly – NH2
VALITOCIN
Cys – Tyr – Ile – Gln – Asn – Cys – Pro – Val – Gly – NH2
GLUMITOCIN
Cys – Tyr – Ile – Ser – Asn – Cys – Pro – Gln – Gly – NH2
ASPARGTOCIN
Cys – Tyr – Ile – Asn – Asn – Cys – Pro – Leu – Gly – NH2
ASVATOCIN
Cys – Tyr – Ile – Asn – Asn – Cys – Pro – Val – Gly – NH2
PHASVATOCIN
Cys – Tyr – Phe – Asn – Asn – Cys – Pro – Val – Gly – NH2
Figura 1.2. Estructura de las hormonas neurohipofisarias (A) y distribución de los péptidos
neurohipofisarios en vertebrados (B). Tomado de Vertebrate Endocrinology de O. Norris.
A B
In vertebrates both hormones (AVT/AVP and IT/OXY), given the tissue distribution of their receptors, have been associated to various physiological processes. In mammals, AVP (also called antidiuretic hormone or ADH) stimulates water reabsorption in the kidneys, thus maintaining blood osmolality within stable levels. In addition, AVP also regulates cardiovascular activity, being able in some cases to play the role of neurotransmitter (Balment et al., 2006; Kulcykowska, 2007). On the other hand, OXY plays a key role in reproduction, stimulating uterine contractions during birth and milk secretion during lactation (Gainer and Wray, 1994). However, in lower invertebrates like fish, these peptides have been associated with different physiological processes, such as osmoregulatory processes, control of blood pressure and cardiovascular activity, metabolism, stress, reproductive behavior, brain neurotransmission and pituitary endocrine activity (Balment et al., 2006; Kulczykowska, 2007). The presence of both AVT and IT receptors has been reported in a large variety of organs and tissues (Hausmann et al., 1995; Martos-Sitcha et al, 2014a).
The receptor structure presents a typical conformation of seven transmembrane helical domains, showing four intracellular and three extracellular domains (Bentley, 1998) (Figure 1.4.). !
! !
Figure 1.4. Topography and structure of AVT/AVP and IT/OXY receptors. Conserved regions, marked as black dots,
are the putative interaction sites with the hormone. (Taken from Kulczykowska, 2007).
Currently, different types of AVT and IT receptors (AVTR and ITR, respectively) have been described in fishes. In the case of the AVT, three receptor types have been cloned, corresponding to two different types of V1 receptor (V1a1-type, and V1a2-type) and one of V2, depending on the species (Konno et al, 2009; Lema, 2010; other sequences available at http://www.ncbi.nlm.nih.gov/ website), including those of the gilthead sea bream Sparus aurata (Martos-Sitcha et al., 2014a).
Introduction
! 7!
orizyases, GenBank access numbers: ITR1, AB646240; ITR2, AB646241.). However, the subfunctionalization of each of these types of receptors has not been addressed in detail.
Receptor of AVT and IT are widely distributed in various organs of teleosts, such as brain, pituitary, spleen, sideline, ovary, bladder, intestine, liver, heart, gill, kidney and skeletal muscle and smooth, suggesting a specific function of that nonapeptides in these organs (Mahlmann et al., 1994; Hausmann et al., 1995; Martos-Sitcha et al., 2014a). Anyway, and according to the mammalian model, each of these types of receptor have been described for their participation in different paracellular pathways. In this way, the AVT V1-type receptor depends on the Protein Kinase C (PKC), using the phospholipase C and the inositol-1,4,5-triphosphate (PLC/IP3) as intracellular pathways (Warne, 2001). On the other hand, AVTR V2-type does it primarily through phosphorylation sites of Protein Kinase A (PKA) using the cyclic AMP (cAMP) and the adenylate cyclase (Wargent et al., 1999). Meanwhile, the IT receptor performs its effect starting from the routes of inositol phosphate and Ca2+ as second messengers (Hausmann et al., 1995). The importance of these paracellular route lies in the possible role of each of these receptors on the regulation of various hormones, enzymes, etc. which regulate different physiological functions (Martos-Sitcha et al., 2014a).
! ! 1.4. Stress system ! 1.4.1. Stress concept !
Stress can be defined as a complex set of adaptive responses to a stressor, which disturbs the normal or homeostatic state of the animal (Wendelaar Bonga, 1997; Pottinger, 2008). For their classification, we can consider different types of stress i) depending on the time that the stressor persists (“acute” short duration, or “chronic” long duration), or ii) depending on the source of stress (endogenous or exogenous). These factors threaten the homeostatic balance of the animals, and when they exceed a certain time or intensity threshold, trigger a series of coordinated physiological and behavioral changes in order to adapt the animal to disturbed conditions. These changes are globally called “integrated stress response”. This response produces measurable hormonal changes responsible of stress reactions. The stress response not only depends on the intensity of the stressor, but also from the susceptibility of the organism. In this respect, the organism activates both the hypothalamic-sympathetic-chromaffin (HSC) axis and the hypothalamic-pituitary-interrenal (HPI) axis. For its functioning, the organism responds to a stressful situation with the, so called, “general
adaptation syndrome”, in which both endocrine axes are involved. This syndrome defines the overall timing of response to stress and having different stages depending on the duration of the stress agent (Adams, 1990; Schreck, 1990): i) alarm phase, in which the body recognizes the stressor as a threat to their basal status; ii) resistance stage, in which resources, mainly hormonal and metabolic, are mobilized to meet the threat; and iii) exhaustion phase, in which despite of the responses activated the homeostasis stage is lost. These sets of responses have a number of common features that pass in a sequential manner and are jointly regulated by both the nervous system and the endocrine system.
1.4.2. Endocrinology of stress!
At endocrine level, a stressful situation involves two different types of endocrine responses: i) an adrenergic response through out the HSC axis, which increases the concentration of plasma catecholamines (adrenaline and noradrenaline), and ii) the HPI axis response, where a plasma cortisol concentration enhancement is observed (Figure 1.5.). !
Introduction
! 9!
!
Figure 1.5. Scheme of the main factors involved in the neuroendocrine stress response system of teleost (taken from
Wendelaar Bonga et al., 1997).
The HSC axis is mainly involved in situations of acute stress, with high intensity and short duration of the stressor. In the interrenal tissue, there are chromaffin cells that produce catecholamines (adrenaline and/or noradrenaline), releasing these hormones in response to stress after sympathetic stimulation. In the HSC axis the synthesis and release of catecholamines into the bloodstream is stimulated by cholinergic fibers of the sympathetic system, followed by a slightly delayed increase in the release of glucocorticoid hormones. In addition, catecholamines activate several cardiovascular, respiratory and metabolic responses aimed to reduce the adverse effects associated with acute stress (Perry et al., 2004).!
However, the HPI axis is more related to chronic stress situations where the stressor is less intense and longer in time. However, activation of this axis is also seen during acute stress situations. The
starting point of HPI axis involves release of corticotropin releasing hormone (CRH), mainly from NPO and NLT. CRH is a 41 amino acid peptide with a structure highly conserved throughout phylogeny, showing a sequence identity of 93% between fish and humans (Flik et al., 2006). In teleosts, hypothalamic CRH-producing neurons directly innervate the corticotrophs cells of adenohypophysis, where they promote synthesis and secretion of adrenocorticotropic hormone (ACTH) (Wendelaar Bonga, 1997; Flik et al., 2006; Bernier et al., 2009). This hormone stimulated interrenal tissue to release adrenal steroids, mainly cortisol. ACTH is a hormone of 39 amino acids produced from the proteolytic processing of Pro-opiomelanocortin (POMC), which at its amino-terminal extreme in the anterior pituitary produces β-lipotrophin, instead of ACTH, and in the intermediate lobe produces α-MSH, β-MSH, γ-MSH, CLIP (corticotropin-like intermediate lobe peptide) and β-endorphin (Castro and Morrison, 1997). In addition, the peptide CRH binding protein (CRH-BP) is synthesized in the preoptic area of the hypothalamus, in a different cell group from those that synthesizes CRH, modulating the availability of active CRH in plasma and acting as a reserve of this peptide (Potter et al., 1991; Cortright et al., 1995; Huising et al., 2004; Flik et al., 2006). Thus, CRH-BP is considered an antagonist of CRH activity (McClennen et al., 1998). In addition to the CRH function regarding the control of ACTH synthesis and secretion, AVT has been proposed to be one of the most important regulators of this complex cascade (see section 1.5.). Moreover, other molecules such as IT, thyrotropin releasing hormone (TRH) and neuropeptide Y (NPY) have also been reported as putative players stimulating ACTH secretion, whereas melanin-concentrating hormone (MCH) could inhibit its secretion (Wendelaar Bonga, 1997).!
1.4.3. Physiological responses!
a) The physiological responses to stress can be grouped into three categories Primary response or neuroendocrine response: catecholamines are secreted from the chromaffin tissue (Reid et al., 1998) and HPI axis is stimulated to produce and release cortisol into the bloodstream (Wendelaar Bonga, 1997; Mommsen et al., 1999).!
b) Secondary response: changes of electrolytes and different metabolites in plasma and tissue. These secondary responses are related to physiological adjustments of metabolism, respiratory function, acid-base regulation, osmoregulation, immune function and cellular responses (Iwama et al., 1997, 1998; Mommsen et al., 1999).!
c) Tertiary response: individual-level variations such as changes in growth, condition, disease resistance, behavior, and finally compromising survival (Wedemeyer et al., 1990).!
Introduction
! 11!
In this regard, an allostatic situation is defined as the level of the homeostatic stability (McEwen and Wingfield, 2003) after a sustained activity of agents causing primary stress response (catecholamines and/or cortisol), through which the body maintains its adequate homeostasis. The allostatic state is part of the primary response to stress, but can also indicate situations where certain changes of catecholamine/cortisol levels from baseline are required, without necessarily occur a stress situation.!
1.5. Interactions between vasotocinergic/isotocinergic systems and stress system!
Due to all functions mediated by AVT/IT (final products of vasotocinergic/isotocinergic systems) and cortisol (final product of the activation of HPI axis) in stress and metabolic processes, it has been suggested a possible interaction between these hormones. In fact, previous studies have demonstrated the existence of an interaction between both vasotocinegic/isotocinergic and stress systems in teleost (Gilchriest et al., 2000; Kulczykowska, 2001, 2007; Balment et al., 2006; Cádiz et al., 2015). Thus, hypothalamic neurons responsible for the synthesis and secretion of AVT innervate the corticotrophs cells of adenohypophysis to stimulate ACTH release into the bloodstream, controlling cortisol secretion in the interrenal tissue (Batten et al., 1990). In this way, it has been observed that AVT stimulates ACTH synthesis and secretion (Fryer et al., 1985; Baker et al., 1996), as well as regulates plasma cortisol levels in fish subjected to high stress situations (Fryer and Leung, 1982). These results suggested a cooperation between both endocrine systems. In Oncorhynchuis mykiss, concomitant administration of AVT and CRH in pituitaries incubated in vitro, stimulated ACTH secretion dependent on the concentration of both hormones (Baker et al., 1996). The same synergism has been previously observed in mammals treated with CRH and AVP (Rivier and Vale, 1983). For this reason, it has been postulated the existence of a greater plasticity of ACTH secretion regulated by at least two hormones (AVT and CRH) whose expression occurs independently.!
Previous studies on metabolic and osmoregulatory changes in specimens of S. aurata treated with AVT shown that plasma cortisol levels increased after transfer from seawater (38 ppt salinity) to low salinity water (6 ppt) or high salinity water (55 ppt), but not to seawater (Sangiao-Alvarellos et al., 2006). This could be interpreted as a synergistic or additive effect between AVT and osmotic stimulation on plasma cortisol levels. In fact, such synergy may be due to:!
a) The existence of AVT receptors in corticotrophs cells that producing ACTH in pituitary, thereby AVT stimulate the production of this hormone and consequently the cortisol release (Moons et al., 1989).!
b) The existence of a cooperation between AVT and CRH to increase ACTH release, as it has been shown in other teleosts (Baker et al., 1996; Kulczykowska, 2001).!
c) The regulation of cortisol synthesis in situ in the interrenal tissue by AVT (and IT) receptors stimulation without activating the typical endocrine cascade (Cadiz et al., 2015).!
Results reported by other authors indicate the possible cooperation between exogenous AVT and endogenous CRH (stimulated by salinity transfer), so that the transfer to extreme salinities may be the necessary stimulus for this cooperation (Martos-Sitcha et al., 2013b), in addition to hormone treatment (Sangiao-Alvarellos et al., 2006). Consequently, changes in osmoregulatory and metabolic parameters in specimens of S. aurata treated with AVT and transferred to extreme salinity can be attributed to the action of cortisol. Considering that treatment with cortisol increases hepatic glycogenolysis and hyperglycemia in this species (Laiz-Carrión et al., 2002, 2003), and the increase observed in plasma cortisol levels in fish treated with AVT acclimatized to extreme salinities, the metabolic effects of AVT in S. aurata specimens transferred to extreme salinities can not be ruled out (Sangiao-Alvarellos et al., 2006). These results agree with the stimulation of hepatic glycogenolysis by AVT reported previously in other teleost species (Moon and Mommsen, 1990).
In addition, a role of IT has been proposed in the processes of stress produced by hyperosmotic salinities (Martos-Sitcha et al., 2013b), although the role of this hormone as a modulator of the stress system remains unclear. It has been demonstrated that osmotic stress do not affect IT plasma levels in O. mykiss (Kulczykowska, 2001), although this hormone seems to be involved in the response of female fish of the Gasterosteidae family subjected to different stressors (Kleszczyńska and Kulczykowska, 2006). In S. aurata, IT plasma levels significantly increased in response to high stocking density, while fasting stress has no effect on it (Mancera et al, 2008). In addition, it has been shown that the hypothalamic mRNA expression levels of the IT precursor (pro-IT) increase after changes in the environmental salinity (Martos-Sitcha et al., 2013b). These data suggest plasticity in the stress axis of the isotocinergic system depending on the type of stressor to which the animal is subjected.
Introduction
! 13!
1.6. Biology of gilthead sea bream (Sparus aurata)!
The gilthead sea bream (Sparus aurata, Linnaeus 1758) is a marine teleost from the Class Actinopterygi, Order Perciformes and Family Sparidae (Figure 1.6.). This species grows to a maximum length of 70 cm and 17.2 Kg, living up to eleven years (www.fishbase.org).!
Figure 1.6. Sparus aurata (Linnaeus, 1758) (aken from Bauchet and Hureau,1986).
Gilthead sea bream is distributed through all over the Mediterranean Sea as well as in the Atlantic Ocean, from the British Islands to Cape Verde and the Canary Islands (Bauchet and Hureau, 1986) (Figure 1.7.). In addition, S. aurata is an eurythermic and euryhaline species, as it could tolerate a wide range of temperatures and environmental salinities. It is located mainly in coastal areas, but it could enter into brackish estuaries, hyperosmotic coastal lagoons or salt marshes (Arias, 1976).!
Figure 1.7. Geographic distribution of S. aurata (dark areas: highly present; light grey areas: present). Modified from
Gilthead sea bream is a protandric species. This means that during its first reproduction season, which starts at the end of its second year of live, it is a male. Later on, when reaches 30 cm length, this species undergoes a process of sex reversal becoming a female (Moretti et al., 1999). Immature juveniles are normally find in coastal marshes during the months of spring and summer, moving to deeper waters as they become sexually mature at the end of autumn (Arias, 1976).!
Aim of the study
! 17!
Marine aquaculture has expanded in Europe in recent decades, where the gilthead sea bream could be considered as one of the species with higher increase in its production. To capitalize this growth, it is necessary optimize the biological processes in its production to lead a good farm management. The high level of knowledge of this species in captivity reached in the last decades has enabled the development of an effective industrial exploitation. In this way, we actually have a deep knowledge about different processes related to growth, reproduction, feeding, larval development, etc. (Robaina et al., 1995; Rowlerson et al., 1995; Duguay et al., 1996; Moyano et al., 1996; Carnevali et al., 1999).
The stress system of the gilthead sea bream has been extensively studied both by our Research Group and others (Arends et al., 1999; Laiz-Carrion et al., 2002, 2005; Mancera et al., 2008, Rotlant et. al., 2000, 2001; Sangiao-Alvarellos et al., 2003, 2005, 2006). However, the possible role of vasotocinergic and/or isotocinergic system in the stress process of this species is less known (Sangiao-Alvarellos et al, 2004, 2006; Martos-Sitcha et al., 2013a, 2013b, 2014a, 2014b). Moreover, we also have a thorough knowledge about the functioning of the stress system and its interaction with osmoregulatory and metabolic processes (Laiz-Carrion et al., 2002, 2005; Sangiao-Alvarellos et al., 2003, 2005, 2006; Kleszczynska et al., 2006; Cádiz et al., 2015).
This Thesis is focused on the study of the stress process in S. aurata, analyzing an aspect previously not addressed: the response of vasotocinergic and isotocinergic systems after an acute stress situation (exposure to air during 3 minutes). For this aim, we will investigate the putative role of hypothalamic neurohormones (AVT and IT) and their receptors (AVTR type 1, AVTR type 2, ITR) at hepatic level. In addition, these results will be supported by evaluation of plasma cortisol levels, which are expected to increase during the stress response, as well as hepatic and plasma metabolites to investigate the hormonal regulation of fish energetic metabolism.
!
!
Materials and methods
! 21!
3.1. Animals maintenance
Immature specimens of gilthead sea bream (Sparus aurata, Linnaeus 1758) (n= 64, 108.83 ± 1.47 g body mass, 17.79 ± 0.07 cm body length) were provided by “Servicio Central de Investigación de Cultivos Marinos (SCI-CM)” (CASEM, University of Cadiz, Puerto Real, Cádiz, Operational Code REGA ES11028000312). The specimens were randomly distributed and maintained in this installation in sixteen 80 L-tanks (n = 4, density 5 kg/m3) containing seawater (SW, 38 ‰ salinity), in open circuit, at constant temperature (18-19 °C) and natural photoperiod for our latitude (36°31’44’’N, February-March 2013). These conditions were maintained both during a previous acclimation period of 15 days and during the time that experiment lasted. Fish were fed every day with commercial pellets (Trow España S.A., Cojóbar, Burgos) with a daily ration of 1% weight, except the day before to the start of the experiment where the animals were fasted. The maintenance of the tanks during the acclimation period was carried out daily by siphoning to remove faces and possible remains of food.
3.2. Experimental design and sampling
After the acclimation period S. aurata specimens held in 12 of the 16 tanks were captured all together and moved to a rigid mesh where they were exposed to air conditions for 3 minutes. After this time of exposition, fish were returned to their respective tanks. No mortality was observed during the time that experiment lasted (Figure 3.1.).
The sampling was performed in the following experimental times: 0 hours (control group without stress), 15 minutes, 30 minutes, 1 hour, 2 hours, 4 hours and 8 hours after air exposition. For each experimental time 2 tanks (n = 4 per tank) were used, so a total of 8 specimens for experimental time were sampled. In addition, the other 4 tanks constituted, in duplicate, both control groups at i) 0 hours and ii) 8 hours without stress (Vera et al., 2014). The extra control group without stress was also sampled 8 hours after the start of the experiment. This last group served to identify and discard possible circadian rhythms in the levels of metabolites and expression patterns of those genes analysed that could mask our results (Vera et al., 2014).
Specimens of each tank were anesthetized, measured, weighed and killed by decapitation. Blood samples were collected from the caudal peduncle into 1-mL ammonia-heparinised syringes
(Heparin ammonium Sigma, H-6279, 25000 units/3 mL 0.9% NaCl saline) to prevent coagulation during extraction, and centrifuged (3 min at 13,000 g; ALC centrifuge, model 4204) to obtain plasma, snap-frozen in liquid nitrogen and stored at -80 ° C until use. To obtain liver samples, a longitudinal cut was made in the ventral area (from the anal opening to the base of the mandible) to leave the entire digestive tract exposed. After removing the viscera, the liver was removed, weighed and divided into 2 portions that were introduced in 1.5 mL Eppendorf tubes for subsequent measurement of metabolites. The freezing process was the same of the plasma. For studies of molecular biology, both hypothalamic lobes and a biopsy (~15 mg) of liver were deposited in Eppendorf tubes containing 500% (v/w) of RNAlater (Ambio®, Applied BioSystems). These samples were stored 24 hours at 4 °C and subsequently stored at -20 °C until further processing.
Materials and methods
! 23!
3.3. Analysis techniques
3.3.1. Plasma metabolites
The analyses of all plasma metabolites were performed with specific commercial kits (Table 3.1.) adapted to 96-well microplates. Each sample was measured in duplicate using 10 µL of plasma, or from those dilutions described in Table 3.1, according to the methodology described by the manufacturer. Samples were read using an automated microplate reader (PowerWave 340, BioTek Instrument Inc., Winooski, USA) controlled by the KCjuniorTM software.
Metabolites Commercial Kit Standard (nm) Abs Diluicion
Glucose
Glucose-HK Glucose anhydrous
340
(read.) 1/1 Spinreact, Ref. 1001200 Panreac, Cod. 131341
Lactate
Lactate 10 mg/dl 340
(read.)
1/6 Spinreact, Ref. 1001330 Spinreact, Ref.
1002460 630 (ref.)
Triglycerides
Triglycerides 200 mg/dl 340
(read.)
1/6 Spinreact, Ref. 1001311 Spinreact, Ref. 1002380 550 (ref.)
Proteins BCA
TM Protein Assay Kit 2 mg/mL 550
(read.) 1/50 Pierce P.O. #23225 BCA, Prod #23209 630 (ref.)
Table 3.1. References of the commercial kits and dilutions used for the measurement of different plasma metabolites.
Absorbances (Abs, nm) used are marked as reading (read.) and reference (ref.) in each case.
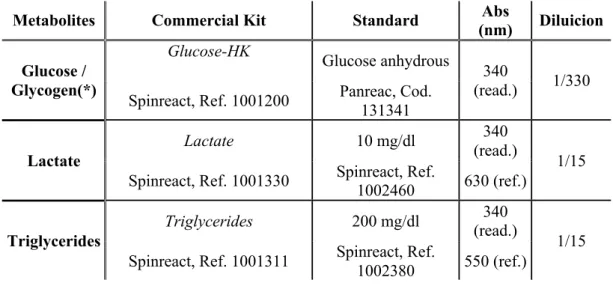
3.3.2. Liver metabolites
Liver biopsies used for the assessment of metabolite levels were finely minced on an ice cold Petri dish and subsequently homogenized by mechanic disruption (Ultra-Turrax, T 25 basic, IKA® -WERKE) with 7.5 vol. (w/v) of ice-cooled 0.6 N perchloric acid (Merck KGaA, 1.00518.1001) and neutralized after the addition of the same volume of 1 M KHCO3 (Merck KGaA, 1.04854.0500).
This homogenization resulted in a dilution of 15 times the weight of the tissue. Previous to centrifugation, an aliquot of each homogenate was separated for triglycerides (TAG) measurements. After that, the homogenates were centrifuged (30 min, 13,000 g, 4 °C) and the supernatants
(aqueous phase) were recovered in different aliquots, which were stored at -80 °C until use in metabolite assays, following the manufacturer methodology described in Table 3.2. Samples were read using an automatic microplate reader (PowerWave 340, BioTek Instrumincanteent Inc., Winooski, USA) controlled by the KCjuniorTM software.
Metabolites Commercial Kit Standard (nm) Abs Diluicion
Glucose / Glycogen(*) Glucose-HK Glucose anhydrous 340 (read.) 1/330 Spinreact, Ref. 1001200 Panreac, Cod.
131341
Lactate
Lactate 10 mg/dl 340
(read.)
1/15 Spinreact, Ref. 1001330 Spinreact, Ref.
1002460 630 (ref.)
Triglycerides
Triglycerides 200 mg/dl (read.) 340
1/15 Spinreact, Ref. 1001311 Spinreact, Ref.
1002380 550 (ref.)
Table 3.2. References of the commercial kits and dilutions used for the measurement of each of different hepatic
metabolites. Absorbances (Abs, nm) used are marked as reading (read.) and reference (ref.) in each case. (*) The results of glycogen are obtained from the difference between samples measured with amyloglucosidase (Sigma, A7420-100mg), enzyme responsible for the breakdown of glucose-glucose bonds, and free glucose present in the liver.
3.3.3. Measurement of plasma cortisol
Plasma cortisol levels were measured by using the ELISA (Enzyme-Linked Immunosorbent Assay) as previously described by Martos-Sitcha et al. (2014b) for this species. This technique is based on the use of antigens or antibodies with an enzyme, in a way that the resulting conjugates have both immunological and enzymatic activity. In this regards, being one of the components (antigen or antibody) coupled to an enzyme and insolubilized on a support (immunoadsorbent, 96-well microplate), the antigen-antibody reaction is immobilized and, therefore, is easily revealed by the action of a specific substrate that acting on the enzyme, which produces colour observable and measurable with the use of a spectrophotometer or a colorimeter at 405 nm in the case of cortisol. The general steps followed for the development of the technique are:
1. Dilution of 5 µL of plasma in 100 µL of RB (100 µL 1 M PPB (Potassium Phosphate Buffer), 0.1 g NaN3, 0.37 g EDTA, 1 g BSA (Bovine Serum Albumin) buffer, screed to 1 L with water
Materials and methods
! 25!
distilled), and subsequent extraction of cortisol in three stages by the addition of 600, 300 and 300 µL of methanol, respectively.
2. Coating of the wells with the monoclonal antibody (Mouse Monoclonal Ab, Cat. 400003, Cayman Chemical Company).
3. Washing of the wells with a Wash Buffer, consisting in 10 mL of PPB 1 M, 0.5 mL of Tween 20 and screed up to 1 L with distilled water (scrubber ImmunoWash MODEL 1575, BIO-RAD), to remove the excess of unbound monoclonal antibody from each well.
4. Adding samples and standards to their respective wells, and mix with the second and specific antibody (Cortisol Express EIA Antiserum, Cat. # 10007334), producing the binding of this monoclonal antibody with its antigen (cortisol) during 1 h of incubation at 25ºC.
5. Washing of the well to remove excess of unbound enzyme.
6. Adding the substrate (Ellman reagent) to the enzyme, and binding of both of them.
7. Colour development by incubation with continuously shaking at 25 °C for 15-30 minutes and measurement at 405 nm in the microplate reader (Benchmark Microplate Reader, BIO-RAD). Finally, from the absorbance obtained from standard curve, we are able to calculate the concentration of cortisol hormone in each plasma sample. Subsequently, a correction of the real concentration according to dilutions made from the initial 5 µL of plasma was necessary. In our case, this factor was between 50 and 150 times according to the period elapsed after air exposition as well as the experimental group (control or air-exposed) in each case.
3.3.4. Total RNA extraction
Total RNA was isolated from complete hypothalamus, as well as from liver biopsies, using the NucleoSpin®RNA II kit (Macherey-Nagel, Cat. # 740955), which allows the maximum purification
of 100 µg total RNA from less than 30 mg of tissue. Moreover, the on-column RNase-free DNase digestion was used for gDNA elimination. The manufacturer’s instructions were followed in this procedure. Additionally, the amount of RNA was spectrophotometrically measured by the fluorimetric determination with Qubit® 2.0 Fluorometer (InvitrogenTM, Life Technologies) using 3 µL of each of the samples and its quality was determined in a 2100 Bioanalyzer using the RNA 6000 Nano Kit (Agilent Technologies). Subsequently, total RNA was stored at -80 °C until analysis. Only samples with a RNA Integrity Number (RIN) higher than 8.5 were used for real-time PCR (qPCR).
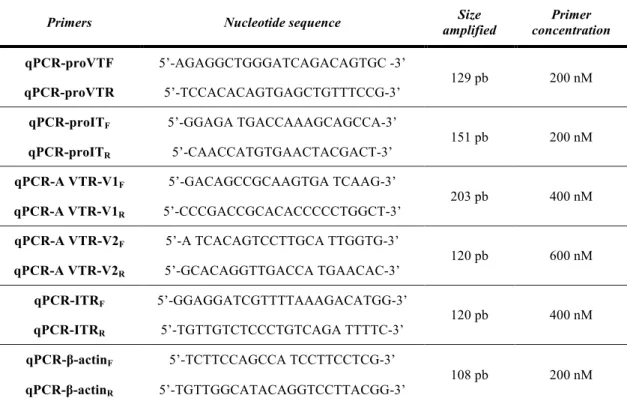
3.3.5. Relative expression analysis by real-time PCR (qPCR)
Total RNA (500 ng) was reverse-transcribed in a 20 µL reaction using the commercial kit qScript™ cDNA Síntesis Kit (Quanta Biosciences, Cat. # 95047-500), which is valid for the synthesis of cDNA from amounts of total RNA between 10 pg and 1 µg. Briefly, the reaction was performed using qScript Reaction Mix (1x final concentration) and qScript Reverse Transcriptase (2.5 x final concentration). The reverse transcription program was carried out using the Mastercycler®ep Realplex 2S (Eppendorf), and consisted in a reaction of 5 min at 22 °C, 30 min at 42 °C and 5 min at 85 °C.
For semi-quantitative (qPCR) mRNA expression of each of the genes of interest, primer oligonucleotide sequences and the final concentrations used in the qPCR reactions are shown in Table 3.3. and were as described by Martos-Sitcha et al. (2013b, 2014a). These conditions were used due to the previous validation test for each of the primer pairs, checking the optimal range of cDNA concentration to ensure efficiencies of reaction (E) near to E ̴1, and regression fits (r2) higher than r2=0.99. Each reaction mixture (10 µL) contained 4 µL of cDNA (10 ng from total RNA input), 0.5 µL each specific forward and reverse primer, and 5 µL PerferCTaTM SYBR® Green FastMixTM (Quanta Biosciences, Cat. # 95072-012) by using the Mastercycler®epgradient S Realplex2 controlled by the software Realplex (Eppendorf, version 2.2). Reactions were conducted in semi-skirted twin.tec 96-well real-time PCR plates (Eppendorf) covered with adhesive Masterclear real-time PCR Film (Eppendorf). The thermocycling procedures were as previously described by Martos-Sitcha et al. (2013b, 2014a). In short, the PCR profile was as follow: (95 ºC, 10 min; [95 ºC, 20 s; 60 ºC, 35 s] X 40 cycles; melting curve [60 ºC to 95 ºC, 20 min], 95 ºC, 15 s). Melting curves were used to ensure that only a single PCR product was amplified and to verify the absence of primer-dimer artefacts. Each sample was run in triplicate. The results were normalised to β-actin (GenBank accession number X89920) levels, which was use like internal control (housekeeping gene) for to check the level of expression (in number of cycles); this is due to its low variability (less than 0.07 CT in hypothalamus and 0.09 CT in liver) under our experimental
conditions. Relative gene quantification was performed using the ∆∆CT method (Livak and
Schmittgen, 2001), based on:
2-ΔΔC
Materials and methods
! 27!
Which is equal to:
2-[( CTsample – CThousekeeping gene)-( CTcalibrator – CThousekeeping gene)]
Primers Nucleotide sequence amplified Size concentration Primer
qPCR-proVTF 5’-AGAGGCTGGGATCAGACAGTGC -3’
129 pb 200 nM
qPCR-proVTR 5’-TCCACACAGTGAGCTGTTTCCG-3’
qPCR-proITF 5’-GGAGA TGACCAAAGCAGCCA-3’
151 pb 200 nM
qPCR-proITR 5’-CAACCATGTGAACTACGACT-3’ qPCR-A VTR-V1F 5’-GACAGCCGCAAGTGA TCAAG-3’
203 pb 400 nM
qPCR-A VTR-V1R 5’-CCCGACCGCACACCCCCTGGCT-3’ qPCR-A VTR-V2F 5’-A TCACAGTCCTTGCA TTGGTG-3’
120 pb 600 nM
qPCR-A VTR-V2R 5’-GCACAGGTTGACCA TGAACAC-3’ qPCR-ITRF 5’-GGAGGATCGTTTTAAAGACATGG-3’ 120 pb 400 nM qPCR-ITRR 5’-TGTTGTCTCCCTGTCAGA TTTTC-3’ qPCR-β-actinF 5’-TCTTCCAGCCA TCCTTCCTCG-3’ 108 pb 200 nM qPCR-β-actinR 5’-TGTTGGCATACAGGTCCTTACGG-3’
Table 3.3. Primer sequences of gilthead sea bream used for measuring expression. Take from Martos-Sitcha et al. (2013b, 2014a).
3.4. Statistical analysis
Significant differences between groups were analysed by one-way analysis of variance (one-way ANOVA), taking the experimental time from air exposition as the main factor (T = 0 h, 15 min, 30 min, 1 h, 2 h, 4 h and 8 h). When significant differences were detected, the Tukey's test for
comparison of the groups was used. Prior to the execution of the analysis of variance, test for normality and homoscedasticity was run. In addition, for the comparison between groups non-stressed at times T = 0 h and T = 8 h, as well as between the groups with and without stress at time T = 8 h, a Student's t test analysis was used. In all analysis performed, statistical significance was accepted at P<0.05. All statistical analysis were performed using the GraphPad Prism® (v.5.0b) for Macintosh.
Results
! 31!
4.1. Plasma metabolites
Metabolic responses of S. aurata specimens submitted to air exposure (3 min) at plasma level are shown in Table 4.1. All plasma metabolites analysed did not show changes in specimens maintained under normal conditions (control, non-stressed) at 0 and 8 hours post-emersion. Plasma glucose rapidly increases its values, which being significantly higher 15 min after air exposure when compared with control group, reaching more than 2-fold increase at end of experimental time. In turn, lactate values in air-exposed fish enhanced more than 4-fold within 15 min compared with unstressed specimens, and then decrease to levels similar to those of departure. However, a second increase occurred 4 hours after air exposure, while at end of experimental time (8h) no differences between both groups sampled at 8 hours (with and without stress) were observed. Moreover, plasma proteins showed a gradual decrease in its values, which only was statistically different 4 hours after emersion. Triglyceride levels did not show significant differences during the time that experiment lasted. In addition, glucose and proteins levels were statistically different at the end of the experiment when compared both stressed and non-stressed specimens.
4.2. Hepatic metabolites
Table 4.2. showed changes in hepatic metabolites in S. aurata specimens subjected to an acute stress situation produced by air exposure during 3 min. Hepatic free glucose increased rapidly 15 min after air exposure, but at 30 min. showed similar values that control group. After that, enhanced its values until the end of experimental time. Moreover, significant differences were found between both groups maintained under normal conditions (control, non-stressed fish), with higher values in the group sampled after 8 hours compared to those of the group sampled at time 0 hours, as well as when compared with stressed fish at 8 hours. In turn, hepatic glycogen levels decreased clearly from the first 15 min post-stress until the end of experimental time, but that resulted in a non-statistical difference when compared with the control group at 0 hours. In addition, hepatic lactate presented a two-pick increase during the first 15 min after the emersion, as well as at the end of the trial, leading to a significant differences between both stressed and unstressed fish (control group) after 8 hours of experiment. Triglyceride levels did not show significant differences during the time that experiment lasted, in the same way that those observed in plasma.
Pl as m a me ta b oli te s 0 h 15 m in 30 m in 1 h 2 h 4 h 8 h 8 h w ith ou t s tr es s Gl u co se (m M ) 4. 16 ± 0. 14 a 6. 18 ± 0.6 2 b 6. 53 ± 0.2 5 bc 6. 40 ± 0.4 9 bc 6. 99 ± 0.2 8 bc 6. 56 ± 0.4 4 bc 8. 49 ± 0.2 0 c* 4. 97 ± 0.1 5 a La ct at e (m M) 0. 37 ± 0. 05 a 1. 71 ± 0. 27 b 0. 65 ± 0. 17 ab 0. 85 ± 0. 17 ab 0. 37 ± 0. 08 a 1. 47 ± 0. 28 b 0. 34 ± 0. 08 a 0. 26 ± 0. 02 a Tr ig ly ce rid e (m M) 1. 16 ± 0. 13 1. 25 ± 0. 11 1. 33 ± 0. 18 1. 32 ± 0. 12 1. 21 ± 0. 11 1. 27 ± 0. 13 1. 138 ± 0. 08 1. 05 ± 0. 07 Pr ot ein s (m g/m L ) 45. 89 ± 1. 87 a 44. 64 ± 1. 63 ab 42. 52 ± 1. 53 ab 42. 17 ± 2. 89 ab 42. 27 ± 1. 26 ab 38. 54 ± 1. 72 b 44. 09 ± 2. 24 ab* 50. 66 ± 0. 48 a Ta b le 4. 1. Ti m e c ou rs e c ha ng es in p la sm a m eta bo lit es (g lu co se , l ac ta te , t rig ly ce rid es an d to ta l pr ot eins ) le ve ls in S. aur at a ex po sed to a ir fo r 3 mi n. V alu es a re re pr es en te d as me an ± S .E .M . ( n = 8 fis h pe r gr ou p) . Si gn ifi ca nt dif fe re nc es w ith in e ac h gr ou p fo r dif fe re nt ex pe rim en ta l t im es a re id en tif ie d w ith d iff er en t le tte rs ; as te ris ks (* ) in dic ate si gn ifi ca nt dif fe re nc es be tw ee n g ro ups a t the sa m e t im e ( P < 0. 05, one -wa y ANOVA fo llo we d b y T uk ey ’s te st) . Ta b le 4 .2 . Ti m e c ou rs e c ha ng es in h ep ati c m eta bo lit es (g lu co se , g ly co ge n, la cta te , t rig ly ce rid es ) l ev els in S. aur at a ex po sed to a ir fo r 3 mi n. V alu es a re re pr es en te d as m ea n ± S. E .M . ( n = 8 fis h pe r g ro up ). Si gn ifi ca nt dif fe re nc es w ith in e ac h gr ou p fo r d iff er en t e xp er im en tal ti m es ar e id en tif ied w ith d iff er en t l et ter s; as ter isk s (* ) i nd icat e sig nif ican t di ffe re nc es be tw ee n gr oups a t the sa m e t im e ( P < 0. 05, one -wa y ANOVA fo llo we d b y T uk ey ’s te st). Li ve r me ta b oli te s 0 h 15 m in 30 m in 1 h 2 h 4 h 8 h 8 h w ith ou t st re ss Gl u co se (µ mo l/g w w ) 30. 86 ± 1. 50 a 37. 95 ± 2. 57 b 26. 79 ± 1. 59 a 31. 91 ± 1. 10 ab 34. 97 ± 1. 92 ab 37. 06 ± 1. 74 ab 39. 56 ± 3. 50 ab* 44. 91 ± 2. 44 b Gl yc og en (µ mo l/g w w ) 154. 62 ± 8. 90 a 138. 56 ± 2. 89 ab 139. 10 ± 5. 73 ab 143. 72 ± 4. 76 ab 136. 69 ± 3. 55 ab 134. 46 ± 7. 05 ab 136. 05 ± 4. 51 ab* 122. 53 ± 6. 61 b La ct at e (µ mo l/g w w ) 0. 011 ± 0. 001 a 0. 017 ± 0. 001 b 0. 012 ± 0. 001 ab 0. 013 ± 0. 001 ab 0. 012 ± 0. 001 ab 0. 012 ± 0. 001 ab 0. 016 ± 0. 001 b* 0. 009 ± 0. 003 a Tr ig ly ce rid e (µ mo l/g w w ) 0. 09 ± 0. 01 0. 05 ± 0. 02 0. 08 ± 0. 01 0. 10 ± 0. 01 0. 10 ± 0. 01 0. 5 ± 0. 02 0. 01 ± 0. 01 0. 09 ± 0. 01
4.3. Plasma cortisol levels
Specimens stressed by emersion for 3 min revealed significant differences in plasma cortisol levels throughout the experimental period (Figure 4.1.). Thus, a significant increase in hormonal values was observed at 15 and 30 min post-emergence, reaching the highest levels at 15 min post-stress with more than 6-fold enhancement respect to control group. Then, cortisol values decreased over time until reaching values similar to those found in unstressed fish, both at 0 hours and 8 hours of the experiment. In addition, control group at 8 hours showed no significant differences when compared with time 0 hours group, or even with animals from the stressed group after 8 hours.
Figure 4.1. Time course changes in plasma cortisol levels in S. aurata exposed to air for 3 min. Values are represented
as mean ± S.E.M. (n = 8 fish per group). Significant differences within each group for different experimental times are identified with different letters (P<0.05, one-way ANOVA followed by Tukey’s test).
0 h 0.5 h 1 h 2 h 4 h 8 h 0 20 40 60 80 100 Stressed Non-stressed a b ab ab a a b ab Time (hours) Co rt is ol (n g/ m L )
Results
! 35!
4.4. Hypothalamic pro-VT and pro-IT mRNA expression
Specimens of the group exposed to air (3 min) significantly increased both pro-VT (Figure 4.2.A) and pro-IT (Figure 4.2.B) mRNA expression levels 1 hour after stress. Then, mRNA values gradually decreased back to baseline values after 4 hours, maintaining these expression levels until the end of experiment. Meanwhile, control group, not subjected to stress and sampled at 8 hours, showed no significant differences when compared to control group at 0 hours as well as to those found 8 hours after stress.
4.5. Hepatic AVT and IT receptors mRNA expression
Hepatic mRNA levels of the two AVT receptors, AVTR V1-type and AVTR V2-type, after exposure to air for 3 min showed a different trend in their mRNA expression. AVTR V1-type significantly increased its mRNA levels 15 min post-stress decreasing rapidly to similar values found in the control group (0 hours) 30 min after air exposure, and maintaining this basal values until the end of the experiment (Figure 4.3.A). However, AVTR V2-type mRNA expression levels revealed a two-phase pattern. Thus, there was an increase in the first 15 min post-stress, with a subsequent decrease presenting its lowest levels 1 hour after air exposure. In addition, a further increase in the mRNA expression of this receptor was observed 4 hours after the stress, with an ulterior decrease close to those values observed in control group (0 hours) (Figure 4.3.B). Finally, ITR gene expression showed a similar trend to that observed in AVTR 2-type, with a rapid increase of its mRNA levels during the first 30 min after emersion. Subsequently, a significant fall-down was observed 1 hour post-stress with a posterior and gradual recovery of its values close to those found at 0 hours (4.3.C). Moreover, no differences between mRNA expression levels of the three receptors studied was observed between the specimens sampled at time 8 hours post-stress and the two groups at normal conditions (0 hours and 8 hours without stress).
Figure 4.2. Time course changes in hypothalamic pro-VT (A) and pro-IT (B) mRNA expression levels (relative to β-actin) in S. aurata exposed to air for 3 min. Values are represented as mean ± S.E.M. (n = 8 fish per group). Significant differences within each group for different experimental times are identified with different letters (P<0.05, one-way ANOVA followed by Tukey’s test).
0 h 0.5 h 1 h 2 h 4 h 8 h 0 2 4 6 8 10 12 Stressed Non-stressed a b ab a a a a a Time (hours) Pr o-V T ex pr es si on (S YB R -ΔΔ CT ) 0 h 0.5 h 1 h 2 h 4 h 8 h 0 5 10 15 Stressed Non-stressed a b ab a a a ab ab Time (hours) Pr o-IT ex pr es si on (S YB R -ΔΔ CT )
A
B
Results
! 37!
Figure 4.3. Time course changes in hepatic AVTR V1-type (A), AVTR V2-type (B) and ITR (C) mRNA expression levels (relative to β-actin) in S. aurata exposed to air for 3 min. Values are represented as mean ± S.E.M. (n = 8 fish per group). Significant differences within each group for different experimental times are identified with different letters (P<0.05, one-way ANOVA followed by Tukey’s test).
0 h 0.5 h 1 h 2 h 4 h 8 h 0.0 0.5 1.0 1.5 2.0 Stressed Non-stressed ab a a b a a a a Time (hours) AVT R V1 -ty pe e xp re ss io n (S Y BR-ΔΔ CT ) 0 h 0.5 h 1 h 2 h 4 h 8 h 0 1 2 3 4 5 Stressed Non-stressed ab ab ab ab a a b b Time (hours) AVT R V2 -ty pe e xp re ss io n (S Y BR-ΔΔ CT ) 0 h 0.5 h 1 h 2 h 4 h 8 h 0.0 0.5 1.0 1.5 2.0 Stressed Non-stressed ab ab b a ab ab ab ab Time (hours) IT R e xp re ssi on (S Y B R -ΔΔ CT )
A
B
C
Discussion
! 41!
In aquaculture, fish are continually subjected to different management practices such as handling, transport or confinement that cause different stress responses (Davis et al., 2002). In the literature there are numerous studies on the response of teleost fish to different typical stress situations in aquaculture. In addition, it has been addressed several aspects of stress system, from the metabolic effects to its regulation by different endocrine systems (Tort et al., 1996; Waring et al., 1996; Arends et al., 1999; Barton et al., 2002). Most of these studies have been carried out in the most important species for aquaculture, especially in salmonids and cyprinids. Moreover, the response of each species previously studied differs about the mechanisms that are triggered to maintain homeostasis after a stressful situation (Wedemeyer et. al., 1990). Physiological changes described after a stressful situation include variations at hematologic level (Dethloff et al., 1999), balance in the osmolyte concentration (McDonald and Milligan, 1997) and various changes in plasma hormones and metabolic pathways (Iwama and Barton, 1991; Carragher and Rees, 1994). One of the physiological responses in vertebrates, including fish, after exposure to a stressor is increased glucose and plasma cortisol (Pickering and Pottinger, 1989; Barton and Iwama, 1991; Barton, 2002; Ortuño et al., 2002). Thus, these parameters are considered as the most reliable methods for distinguish between a situation of stress and rest (Thompson et al., 1993; Biron and Benfey, 1994; Yin et al., 1995; Rotllant and Tort, 1997).
5.1. Cortisol
The variation of plasma cortisol levels in response to acute stressors has been defined within the range about 30 to 300 ng/mL (Wedemeyer et al, 1990; Barton and Iwama, 1991), although these variations depend not only on the source of stress but also on the species used as biological model. Barton et al. (1998, 2000) found that the highest levels of cortisol after an acute stress manipulation were lower in sturgeon (Scaphirhynchus spp.) and in paddlefish (Polyodon spathula). Their results suggest a trend toward lower stress responses in chondrichthyans compared with teleosts. However, Belanger et al. (2001) found that plasma cortisol in white sturgeon (Acipenser transmontanus) was about 40 ng/mL, indicating that lower stress responses cannot be a universal phenomenon in this group of fish. Among teleosts, some species also have low responses to acute stressors. In this way, Atlantic cod (Gadus morhua) peaks plasma cortisol levels with 15 ng/mL after handling (Hemre et al., 1991). However, Maule et al. (1988) demonstrated increases in the levels of this hormone near to 400 ng/mL in juveniles of Chinook salmon (Oncorhynchus tshawytscha) after an acute stress situation generated during and after transport processes. Furthermore, Mazik et al. (1991)