ALMA MATER STUDIORUM
UNIVERSITA’ DI BOLOGNA
SCUOLA DI INGEGNERIA
Sede di Forlì
Corso di Laurea in
INGEGNERIA MECCANICA
Classe: LM - 33
TESI DI LAUREA
in Motori a Combustione Interna
EXPERIMENTAL STUDY ON THE EFFECT OF STOICHIOMETRIC
AIR/FUEL RATIO OF THREE BINARY OXYGENATED FUEL
BLENDS ON COMBUSTION AND EMISSIONS OF A HEAVY DUTY
DIESEL ENGINE
CANDIDATO
RELATORE
Ruggero Maria Vittori
Prof. Ing. Davide Moro
CORRELATORI
Dr. Shuli Wang
MSc. Jinlin Han
1
THESIS LAYOUT STRUCTURE
NOMENCLATURE
pag
3ABSTRACT
5
1
Introduction
6
Background……….6
1.1 Combustion engine concepts………9 1.1.1 Diesel combustion………..9 1.1.2 Homogeneous charge compression ignition………. 11 1.1.3 Partially premixed combustion………12 1.1.4 Emissions……….13 1.2 Biofuels………17 1.2.1 General characteristics………..17 1.2.2 Combustion reactivity………20 1.2.3 Characteristics of test fuels………22 1.3 Aim of the thesis project………24
2
Experimental setup and measurements
27
2.1 Engine and description of the setup………..27 2.2 Emission measurement system……….30 2.2.1 Horiba measurement system………30 2.2.2 Smoke meter……….31 2.2.3 Engine exhaust particle sizer……….33 2.3 Data acquisition system………..35
2
3
Parameters background
36
3.1 Featured combustion parameters……….36 3.1.1 Combustion phase ‐ CA50……….36 3.1.2 Gross indicated mean effective pressure ‐ IMEPg………37 3.1.3 Air excess ratio ‐ λ………..38 3.1.4 Intake pressure and temperature………39 3.1.5 Injection duration………41 3.1.6 Injection pressure………41 3.1.7 Start of actuation – SOA……….42 3.2 Post‐processing parameters………..43 4
Test and results
53
4.1 Test strategy……….53 4.1.1 Starting conditions……….55 4.1.2 Different values of IMEPg……….56 4.1.3 Effects of combustion phase changing………57 4.1.4 Optimum CA50……….58 4.2 Results……….64 4.2.1 EGR sweep………..64 4.2.2 Injection pressure sweep……….76 4.2.3 Engine exhaust particle sizer ‐ EEPS……….80
5
Conclusion and future improvements
83
BIBLIOGRAPHY
85
3
NOMENCLATURE
(A/F) Air‐fuel ratio (A/F)st Stoichiometric air‐fuel ratio BEV Battery electric vehicles BMEP Brake mean effective pressure BD Burn duration CA10 Crank angle where 10 % of the heat has been released CA50 Crank angle where 50 % of the heat has been released CA90 Crank angle where 90 % of the heat has been released CAD Crank angle degree CN Cetane number CO Carbon monoxides CO2 Carbon dioxide COV Coefficient of variability CVS Constant volume system DOC Diesel oxidation catalyst DPF Diesel particulate filter ECU Engine control unit EEPS Engine exhaust particle sizer EGR Exhaust gas recirculation EVC Exhaust valve closing EVO Exhaust valve opening IMEP Indicated mean effective pressure IMEPg Indicated mean effective pressure (gross) FSN Filter smoke number HC Hydrocarbons HCCI Homogeneous charge compression ignition ID Ignition delay ISCO Indicated specific carbon monoxide4 ISFC Indicated specific fuel consumption ISHC Indicated specific hydrocarbons ISNOx Indicated specific nitrogen oxide ISPM Indicated specific particulate matter LHV Lower heating value LTC Low temperature combustion NOx Nitrogen oxides PM Particulate matter PPC Partially premixed combustion PRF Primary reference fuel PRR Pressure rise rate RON Research octane number SCR Selective catalytic reduction SI Spark ignition SOA Start of actuation SOC Start of combustion SOI Start of injection SOOT Particulate matter TDC Top dead centre Vd Volume displacement UHC Unburned hydrocarbons ɸ Equivalence ratio α Air‐fuel ratio λ Air excess ratio
5
ABSTRACT
Low Temperature Combustion (LTC) is believed to be the best solution to the diesel NOx and soot
emissions trade‐off: the latest development in LTC methods is PPC (Partially Premixed Combustion) which can be considered as a combination of Homogeneous Charge Compression Ignition (HCCI) and conventional diesel combustion.
The increasing interest in high‐octane alternative fuels, such as alcohols and aromatic compounds, leads to investigate their combustion behaviour, in order to develop cleaner fuels, making another small step towards new cleaner engines. In this thesis, three binary oxygenated fuel blends are selected, with the aim of studying how their molecular structures and stoichiometric air‐fuel ratio influenced the combustion performances and emissions of a truck heavy‐duty diesel engine. The first part describes the fundamental elements of LTC and gives a background on the typical diesel combustion emissions, with the description of the alternative test fuels of this research. The second part is about the engine setup, with particular attention towards the emission measurement and data acquisition systems.
The third part gives a background on the important parameters of this research, mostly combustion control parameters: it is fundamental to understand the test results, which are presented in the final part of the thesis. This master thesis project has been developed in collaboration with the “Multiphase and reactive flows” research group at TU/e, Eindhoven University of Technology, in the Netherlands.
6
CHAPTER 1 ‐ INTRODUCTION
BACKGROUND
Nowadays and in the latest period, pollutants emitted by diesel engines has become
an heavy problem for the planet environment, making the society increasingly
concerned. Greenhouse effect, acid rain and ozone depletion are just some of the
biggest side effects which are directly connected to the worldwide use of
combustion engines. The large variety of fuels used in this sector have led to the
emission of several harmful pollutants, such as soot, NOx, CO and HC.
The main focus, in order to enhance cleaner engines, is to control and alter the
combustion to reduce the emissions, without loosing performances and keeping
costs affordable: emissions from vehicles, especially soot emission, can be reduced
using renewable fuels from biomass.
Actually the increasing price and decreasing supply of petroleum are leading to an
important changing: future transportation fuels are expected to be modified,
adding larger amount of alternative fuel components.
Internal combustion engine has been used for transportation for several years,
becoming a key factor in the economy: in particular, Diesel engine is currently
widely used in many application due to its high efficiency, strong stability, high
flexibility for a variety of operating conditions.
The active research on cleaner engines and fuels is really strong, enhanced by the
strictly constrains referred to the latest EURO regulations, made to follow the
European regulatory pathway for vehicle emissions control.
7
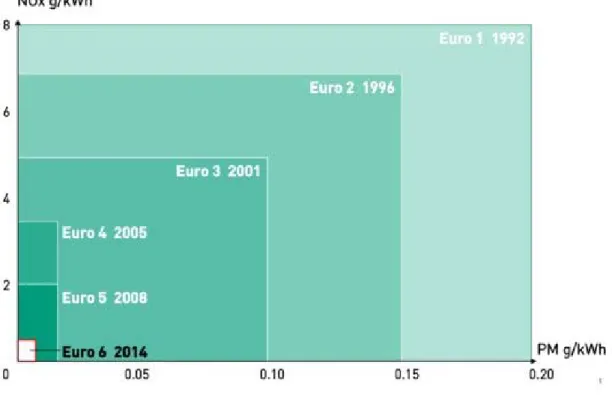
The EURO track was established in 1992 and progressing through to EURO VI in
2013.
In the table below, standard emissions of NOx and soot for Diesel engines are
shown.
These regulations led to significant revolution in engine‐related or fuel‐related
technologies, as well as exhaust aftertreatment technologies are required. For
example, Diesel engines have been provided with Diesel Oxidation Catalyst (DOC),
Diesel Particulate Filter (DPF) and Selective Catalytic Reduction (SCR). This
aftertreatment system allow to reduce the two main Diesel emissions such as NOx
and particulate matter, commonly called soot.
These systems are both expensive and complicate to maintain or be replaced in case
of bad conditions or malfunctioning: therefore the need for more advanced
combustion concepts that should concern renewable fuels to achieve lower tailpipe
emissions to reduce the dependecy on aftertreatment.
Figure A ‐ EU NOx and soot Emission standards for Diesel engines
8
Latest studies are moving fast towards the use of electric vehicles (BEVs‐Battery
Electric Vehicles), because it’s common belief that BEVs are so much cleaner than
Diesel engines. Actually this statement is neither completely right or wrong: the
production of electric batteries is not exactly the cleanest one and electric systems
are not so comfortable for vehicles. The dimension of the batteries is a crucial point
in BEVs continuos development, strictly connected to their energy density which is
still far from the suitable duration for a comfortable driving journey. Moreover the
most countries are not yet equipped with charging stations and the biggest vehicle
batteries could maybe last for 300 km and then they need to be recharged.
That’s another reason why it’s still worth it to concentrate on renewable fuels and
cleaner combustion engines.
The same reasoning can be applied to heavy duty engines developed for trucks:
they would need more powerful, durable, long‐lasting and high volume power
density batteries.
Therefore, even if electric truck do exist (mostly medium duty hybrid), they will still
rely in internal combustion engines in the foreseeable future.
Improving fuel efficiency and looking for alternative fuels are the two main
strategies to reduce emissions of heavy‐duty diesel engines.
Figure B ‐ EU Emission standards for HD Diesel engines
9
1.1 COMBUSTION ENGINE COCEPTS
In order to face emission standards, the research on Diesel combustion engines has led to increasingly innovative combustion concepts. The most important features of these different kinds of combustion, are based on injection position and timing, in order to have more mixed fuel or lower temperature. These concepts are commonly called LTC which stands for Low‐ Temperature Combustion.
In all LTC strategies, the combustion temperatures are reduced by dilution of the in‐cylinder combustible mixtures, either with excess charge gas to create mixtures that are more fuel‐lean than stoichiometric, or with moderate to high levels of EGR.
In either case, the diluent gases increase the fuel‐specific heat capacity of the combusting mixtures, thereby reducing the combustion temperatures. In the case of dilution by EGR, the oxygen concentration is also decreased, which further slows NOx formation kinetics. In the next chapters the focus will be on some of these prevailing concepts, which modify standard Diesel combustion, improving efficiency and maintaining combustion performances. The development of these technologies with intrinsically lower soot and nitrogen monoxide could minimize the after‐treatment system requirements, leading to lower complexity and costs. 1.1.1 DIESEL COMBUSTION Diesel combustion is a complex, turbulent, multiphase process that occurs in high‐temperature and high‐pressure environment. In this type of engine, at the very beginning, only air is compressed: in the meanwhile, when the temperature reaches a certain level and the piston is near TDC (Top Dead Centre) fuel is injected into the combustion chamber. The injection timing is fundamental, it provides the right efficiencies and emissions values. The combustion starts without any spark: a highly reactive fuel is used to enable auto‐ignition, after a short ignition delay period, under high pressure conditions. The engine uses a high compression ratio, high temperature and lean fuel mixtures, which lead to high NOx emissions: in addition, the combustion passes through a temperature window that provides heavy soot emissions in the exhaust gas. That’s the so called NOx‐soot trade‐off which is a particular feature of Diesel Engines,
10 because lowering the temperature enhance soot production, while increasing temperature lead to high NOx values. That’s the reason why new combustion concepts have been developed: it is established that a lower temperature inside combustion chamber and a better air‐fuel mixture represent the best conditions to improve the NOx‐ soot tradeoff: the following innovative combustion concepts are looking for this purpose. Figure 1.1: Equivalence ratio vs Temperature related to emissions
11 1.1.2 HOMOGENEOUS CHARGE COMPRESSION IGNITION The first combustion concept has been introduced to apply such a premixed mixture in a high‐ efficient compression ignition engine and it is called Homogeneous‐Charge Compression Ignition (HCCI). HCCI is a combustion process controlled by the history of temperature, pressure and composition of the in‐cylinder charge. It uses very early port fuel injection to provide the most homogeneous mixture as possible, by the end of the compression stroke, like SI engine. Good results depend on cylinder conditions, because this type of combustion is strongly relied to chemical kinetics, that’s why auto‐ignition time is highly dependent on cylinder pressure and temperature. The aim is to cause auto‐ignition near TDC. Clearly some draw‐backs can show up: HCCI is hard to control, due to the strong dependence on in‐cylinder conditions and sometimes knock occurs. It’s not so common to see the auto‐ignition process moving constant everywhere and that means unstable combustion. Moreover it’s hard to minimize fuel condensing in the intake manifold, which can be reduce with high intake temperature.
However, this innovative combustion concept, working with leaner mixture and lower temperature than the Diesel combustion, provides some improvements: it represents a cleaner combustion mode, reducing a lot NOx emissions (well below EURO VI limit of 0.4 g/kWh) and allowing to avoid expensive after‐treatment systems. The HCCI concept shows some limitations if compared to Diesel combustion: for example the very fast burn‐rate leads to poor combustion phasing control and can cause high noise level; moreover the operating range has a short time window and the combustion efficiency is lower than Diesel engine. In order to move forward and improve this kind of combustion, trying to maintain the primary benefits of Diesel combustion such as higher power density and better phasing combustion control, Partially‐Premixed combustion concept has been developed through the years.
12 1.1.3 PARTIALLY PREMIXED COMBUSTION PPC is a combination of HCCI and traditional Diesel combustion: the biggest improvement is the possibility to create a homogeneous stratified mixture before ignition, due to a longer mixing time provided by a longer ignition delay. This important feature allow to strongly reduce the flame temperature and it reduces local fuel‐ rich regions, dangerous for unstable combustion and soot production. Usually in PPC, high‐octane fuel is injected closer to TDC and combustion is controlled by EGR rate: due to the lower reactivity of high‐octane fuels compared to diesel, fuel and air are partially premixed before the combustion starts. Lower temperature make the fuel behave differently from Diesel combustion, in which ignition usually occurs before the end of injection.
Therefore ignition delay, which is defined as the crank angle difference between start of injection and start of combustion, is a key parameter for PPC.
As already said, temperature can be reduced using a high percentage of cooled exhaust gas recirculation (EGR), which brings to reduce NOx emissions and to a longer ignition delay slowing down the kinetic reactions.
Knocking down the NOx‐soot trade‐off is actually possible with PPC, but significant loss in terms of combustion efficiencies occurs and other emissions such as UHC (Uncombusted Hydro Carbon) increase, due to the wall wetting from early injection.
However, PPC represents the latest and more successful combustion concept among the LTC family, showing a wide operating range for an extremely balanced combustion. In the next chapters, the investigation of a huge amount of parameters for PPC combustion on a heavy duty diesel engine is described: the best ways of looking for the right NOx‐soot trade off and higher efficiencies, controlling a whole set up from EGR rate to SOI (Start of Injection) at different loads and for different fuel blends are presented.
13
1.1.4 EMISSIONS
In this paragraph, a quick review of the most common exhaust gas pollutants will be given, referring mostly to Diesel combustion.
Nitrogen Oxides (NOx) and Particulate Matter (Soot) are usually detected at higher percentage after Diesel combustion, while Unburned Hydrocarbon (UHC) and Carbon Oxide (CO) have lower percentage. This trend is the opposite for gasoline spark ignition (SI) engines.
‐ Nitrogen Oxides (NOx) nitric oxide (NO) and nitrogen dioxide (NO2) are usually
grouped together as NOx and NO is the predominant oxide of nitrogen produced inside
the engine cylinder. The mechanism of NO formation from atmospheric nitrogen is well explained by Zeldovich mechanism, which states that in combustion of near‐ stoichiometric fuel‐air mixtures the principal reactions governing the formation of NO from molecular nitrogen 2are: O + N2 = NO + N N + O2 = NO + O N + OH = NO + H The in‐cylinder environment is prosperous for NOx formation: Diesel engines work with air excess and lean mixtures, related to high pressure which lead to high temperature that enhance the chemical reaction of air nitrogen with oxygen.
Diesel engines presents extremely complex processes such as fuel‐air mixing and combustion. During the premixed and uncontrolled combustion phase, immediately following the ignition delay, the composition near stoichiometric ratio burns due to spontaneous ignition flame propagation. After that, during the mixing controlled combustion phase, the burning mixture is closer to stoichiometric (turbulent, unsteady, diffusion flame). The critical equivalence ratio (ɸ) for NO formation in high‐temperature, high pressure burned gases is close to stoichiometric (0.85 ɸ 1.1). High temperature provides higher NOx formation, mostly between start of combustion and shortly after the peak cylinder pressure, where burned gas temperatures reach their maximum value. Subsequently the decreasing temperature due to expansion freezes the NO chemistry.
14 In order to avoid NOx formation, the combustion should be more homogeneous as possible, avoiding peak temperature and slowing down the combustion, which is basically upstream the common Diesel combustion. That’s the reason why Diesel engines present more NOx than SI engines.
‐ Particulate Matter (soot) Diesel particulate mostly consists in carbon agglomerates, generated by carbonaceous material (soot) on which some organic compounds have become absorbed.
Soot formation takes place in Diesel combustion environment, pressures between 50 to 100 atmospheres and temperatures from 1000 to 2800 K. Very short time is required for soot formation, in the order of milliseconds.
The first stage in soot formation involve the first condensed phase material which comes from oxidation of fuel molecules: this products are typically made of unsaturated hydrocarbon (such as acetylene and polycyclic aromatic hydrocarbons) and they are considered as the most likely precursor of soot in flames. The first particles have a very little diameter, smaller than 2 nm. The second stage involve particle growth, both coagulation and aggregation: gas‐phase species contribute to form the bulk of the solid‐phase material. Surface growth reactions lead to increase the amount of soot, the number of the particle remain the same. In the exhaust, an additional mass fraction comes from dilution: the exhaust gases are cooled and diluted with air. Adsorption and condensation occur in the dilution tunnel and in the exhaust system.
The measurement of particulate emissions is conducted either by diluting the whole exhaust in a dilution tunnel with constant volume sampling or by extracting a small proportional part of the exhaust gas and diluting it. Particulate emissions are measured by passing part of the diluted exhaust aerosol through a filter paper. The increase of the weight of the filter is used to calculate the particulate matter mass (PM) emissions.
Particulate matter comes easy from incomplete combustion conditions which come from a non‐homogenous fuel mixture inside the cylinder that provides fuel‐rich regions, especially at high loads. The fuel need more time as possible for a complete combustion.
15 Some of the main causes of soot formation are the following: . Regions of high fuel concentration (especially at high loads) . Heterogeneous combustion process . High equivalence ratio (ɸ) . SOI retarded . CA50 retarded LTC concepts provide a solution to decrease soot formation, lowering temperature and equivalence ratio and creating a more homogeneous fuel combustion, compared with Diesel. ‐ Hydrocarbons (UHC) Diesel fuel shows a heterogeneous combustion, which lead to a more complex composition if unburned and partially oxidized hydrocarbons in the exhaust gas and extends over a larger molecular size range. As a result of complexity, diesel combustion has been divided into four stages: 1) Ignition Delay the time between the start of injection and start of ignition
2) Premixed combustion phase during which the fuel that has mixed to within combustible limits during the delay period burns 3) Mixing controlled combustion phase the rate of burning depends on the rate of fuel‐air mixing 4) Late combustion phase mixing of residual combustibles, excess of oxygen and low rate of heat release that provides kinetics of oxidation Figure 1.2: Fuel droplet from conventional Diesel combustion and LTC combustion
16 Fuel unburned can occur if fuel‐air mixture is too lean to auto‐ignite or maintaining the flame propagation, or too rich to ignite during the first part of the combustion.
Another important cause is flame quenching, which comes from fuel remaining on the cylinder walls and get scratched away by the piston during cycles. Flame quenching is mostly caused by wrong injection timing, especially too advanced SOI. Instead, if SOI is retarded, under‐mixing is enhanced and fuel can’t burn properly because the combustion is already in a late phase. Under‐mixing (fuel that leaves fuel injector at low velocity, late during the combustion), over‐leaning (fuel mixed to leaner conditions than the limits) and flame quenching cause hydrocarbons presence in the exhaust gas. Over‐leaning zones are usually located at the boundaries of the real schematic behaviour of fuel spray, as it is shown in the figure above. In a swirling flow, ignition occurs first in the spray core: the fuel at a certain distance from the core has already mixed beyond the lean limit and in these regions there will be unburned fuel. The amount of HC in the exhaust gas depends on the amount of fuel injected during ignition delay time and the mixing rate in this period. Certainly there is a strong correlation between ignition delay and HC values.
It’s important to keep the ignition delay as shorter as possible and control the injection timing, not too late (unburned fuel) and not too advanced (flame quenching). The equivalence ratio doesn’t affect HC emissions, until a critical value of 0.9 is reached: from that value, an increasing equivalence ratio will bring critical HC levels. ‐ Carbon Monoxide (CO) CO emissions from Diesel are low enough to be unimportant. That is because carbon monoxide production comes mostly from high equivalence ratios that never occur inside a Diesel engine which works with lean fuel mixture.
17
1.2 BIOFUELS
1.2.1 GENERAL CHARACTERISTICS
Research on biofuel systems covers sustainability aspects in the supply chain from biomass cultivation, harvesting and transport via conversion processes to distribution and end use. A great number of fuel additives are currently produced based on fossil feedstock, but could be replaced by renewables. As biofuels are of high interest for reasons such as climate change, security of supply and economy the demand for the different fuels is steadily increasing from both governmental and users as passengers and heavy duty vehicles. Systems analysis of biofuel production basically covers the whole chain from biomass resource extraction via processing and distribution to end‐use. Basically four major types of biofuel feedstock exist: ‐ Sugar‐based feedstock (e.g. sugar cane or sugar beet) ‐ Starch‐based feedstock (e.g. corn and other cereals) ‐ Oil‐based feedstock (e.g. palm oil, animal fats and others types of oils) ‐ Lignocellulosic feedstock (e.g. wood, forest residues) Figure 1.3: Major steps accounted for biofuel production systems analysis. dLUC= direct land use change iLUC= indirect land use change
18 In addition, related to the feedstock, three principal process platforms for biofuel processing exist:
‐ Thermochemical conversion (suitable for lignocellulosic material)
‐ Biochemical conversion (e.g. fermentation, anaerobic digestion. Suitable for sugar and starch‐based feedstock) ‐ Hydrogenation (conversion of oil‐based materials, such as vegetable oils or animal fats to fuel)
The simpler and schematic representation of the biofuel production is shown above: the production process are also designed to produce net electricity and heat besides the main objective of biofuels. It is possible to have an extended vision of the production processes representing a scheme in which feedstock and processes are completely shown as a block diagram. Figure 1.4: Schematic representation of biofuel production Figure 1.5: Biofuels feedstock and process block diagram
19 The constant research on biofuels is propelled by the knowledge about fossil fuels closing end, reinforced by environment care: it’s well known that great emissions come from all types of fossil fuels and petroleum precursor and the common idea is to move towards a solution that provides cleaner engines related to cleaner fuels.
The variations and usage of alternative fuels is vast for the liquid ones: lots of different fuel configurations have been tested and used over the years. Biodiesel is the most widely used as fuel, starting from low grade blend (7%) in standard diesel, up to higher percentages and also to 100% neat fuel. The most common biodiesel is called FAME (Fatty Acid Methyl Esters), typically produced by an alkali‐catalyzed reaction between fats and methanol. Nowadays there is plenty of renewable sources that could be used as fuels base, include alcohols (methanol, ethanol, propanol, butanol), derivates of alcohols and different ethers. These kind of fuels can’t run an engine by themselves, they need to be blended to fossil fuels, mostly for a matter of reactivity in Diesel engines (there is no spark ignition, more reactivity of the fuel is required).
20 1.2.2 COMBUSTION REACTIVITY The most important quality for the fuels is how good and how fast they burn inside the cylinder. A fuel that doesn’t burn properly is useless, that is why combustion reactivity is the first property to be investigated.
In order to see how a fuel would be prone to auto ignition, two parameters need to be investigated:
‐ RON (Research Octane Number) it represents the measurement of combustion reactivity for gasolines. The higher the RON, the lower the reactivity (the gasoline is more resistant to auto ignition) ‐ CN (Cetane Number) combustion reactivity parameter for Diesels. The higher the CN, the higher the combustion reactivity. A fuel with high CN burns easily than another one with lower CN value. So there is an inverse correlation between RON and CN. Usually gasolines need to be resistant to auto ignition to avoid knock, which represents an usual phenomenon due to too much powerful combustion, with unstable flame that causes literally an explosion above the piston. The tests on RON number are based on the so called PRF (Primary Reference Fuel), which are n‐ heptane and iso‐octane. They have got respectively 0 and 100 RON values. The CN of a fuel is measured by comparing its ignition characteristics with reference fuels in a single‐cylinder diesel engine. The reference scale is based on normal cetane (n‐hexadecane) that shows a CN value of 100. It is also possible to conduct some tests looking at the ignition delay, which is basically directly related to the properties of auto ignition of a fuel, in terms of time. Normally is defined that a fuel falls in the Diesel auto ignition range if CN > 30 and belongs to the gasoline auto ignition range if RON > 60. Diesel fuels have a CN range from 40 to 60 and gasolines have RON range between 90 and 100. The emergence of low temperature combustion strategies, particularly the ones that concern different ways of chemical reactivity, controlled ignition timing and combustion like PPC (Partially Premixed Combustion), offers the potential to significantly improve operating efficiency and
21 reduce emissions. Combustion reactivity is one of the most important property to choose which fuels are better to be tested and what type of combustion control they would need.
The possibility of blending alternative fuels with petroleum‐derived fuels, depends on their combustion reactivity. Diesel RON is in a range between 15 and 25, and the CN is about from 45 to 55. For example, butanol CN is about 25. That means a higher reactivity compare to these alternative fuel alcohols: these fuels can’t burn as neat fuel for a Diesel engine but they could be blended with Diesel or others petroleum‐based fuels. Researchers are looking into the real possibility in blending fuels in order to get lower emissions at the same performances: cleaner fuels for cleaner engines. In the next chapters there will be some results shown, which come from several tests on one if these alcohols blended with n‐heptane as a high reactivity based fuel in a certain percentage. The results involve emissions properties if this blend under different combustion control parameters.
22
1.2.3 CHARACTERISTICS OF TEST FUELS
In the next part, test fuels used for the tests on the heavy duty diesel engine will be described. The focus is on creating different fuel blends that could provide relevant combustion results in terms of control, emissions and efficiency: in particular the effect of chemical structure and stoichiometric air/fuel ratio on emissions and combustion control are investigated for three different fuel blends. The blends need to be suitable for a heavy duty diesel engine for PPC application strategy.
The straight‐chain alkane n‐heptane chemical formula is C7H16 and has the important property of
being a PRF as a 100% n‐heptane fuel shows RON=0.
Due to its high reactivity, n‐heptane presents a really good base to be blended with alternative fuels which are way less reactive: n‐heptane burns really fast and it’s dangerous for gasoline engines because knock can occur. It is perfectly suitable, instead, for diesel engines. Combustion strategy concerned the LTC concept called PPC: the main benefit is to concurrently reduce flame temperature and allow more fuel‐air premixing to produce both low NOx and soot emissions. Some binary oxygenated fuels such as alcohols and other organic compounds are investigated on their chances to be blended with a higher reactivity fuel base, such as n‐heptane. Alcohols chemical structure presents carbon, hydrogen and oxygen with one particular functional group –OH. They are organic compound too, but with a particular structure. Organic compounds present carbon, hydrogen and oxygen in their structures as well, but without the –OH group. In particular, the table below shows a list of binary oxygenated fuels (except for toluene and iso‐ octane which are aromatic hydrocarbons), that will be investigate and analysed in terms of combustion properties such as (A/F)st, RON, LHV (Lower Heating Value) and density.
23
Fuels (A/F)st RON LHV 𝑴𝑱 𝑲𝒈⁄ DENSITY 𝑲𝒈 𝒎⁄ 𝟑
N‐HEPTANE 15,2 0 44,6 684 BUTANOL 11,1 96 34,4 810 ETHANOL 9,0 108 27,0 794 METHANOL 6,5 136 20,1 792 TOLUENE 11,5 121 40,6 867 ANISOLE 10,8 112 33,5 995 BENZYL‐ALCOHOL 10,8 108 33,1 1044 ISO‐BUTANOL 11,2 113 33,0 802 TERT‐BUTANOL 11,1 103 33,0 791 BENZALDEHEYDE 10,4 120 33,2 1040 ISO‐OCTANE 15,1 100 44,8 690 DIESEL 14,4 20 42,6 832 Table 1A: Alternative fuels characteristics The base fuel of the different blends is always n‐heptane, because of its higher reactivity: without it, the other fuels listed in the table above are very difficult to ignite. That’s why n‐heptane represents the starting point for the fuel blends: the analysis is conducted calculating the different values of (A/F)st, RON and LHV for different blending ratios for each fuels related to n‐heptane, using a developed Matlab code.
24 1.3 AIM OF THE THESIS PROJECT The aim of the research is to investigate the influence of stoichiometric air/fuel ratio and chemical structure of the fuels related to NOx and soot emissions. PPC has great potential to achieve high engine efficiency and very low emissions of NOx and soot: the need of specific fuel properties for PPC cannot be fulfilled by using a single component fuel. That’s why test fuels use PRF blends as primary fuels and organic compounds (including alcohols) to have specific RON and (A/F)st but different structures. It is also investigated the case of very similar molecular structures of the blends but different (A/F)st, in order to analyse both chemical structure and (A/F)st influence on emissions. Alcohols have shown good prospects for application in PPC because of their higher latent heat of vaporization and lower reactivity: even at high loads, alcohols provide short ignition delay which is comparable to diesel but they still help to reduce soot emissions.
The first step is to identify test fuel blends, using PRF n‐heptane base blended with organic compounds and alcohols, calculating (A/F)st values and RON. The calculation is done for different blend percentages for all the fuels.
The aim is to find three binary oxygenated fuel blends, with two of them showing the same (A/F)st and different molecular structure and other two showing very similar molecular structure but different (A/F)st.
The target RON is set around 70, because higher octane number fuels are considered problematic with low load and idle conditions. The main focus will be on (A/F)st and structure between the blends, RON from 70 to 80 will be accepted as well: it comes from an approximate calculation, based on a weighted average between RON of n‐heptane and RON of the organic compound depending on blending ratio (chemical tests in the lab would be more precise but it would have been much more time consuming).
As an example, in the table below, n‐heptane/butanol blend characteristics are shown, from 10% to 50% n‐heptane and from 90% to 50% butanol. It’s easy to notice that, due to the lower reactivity of butanol compared to n‐heptane, if butanol percentage decreases, RON decreases as well, while (A/F)st increases.
25
Heptane (%) 1‐butanol (%) A/F st LHV RON
10 90 11,5008 34,0607 86 15 85 11,6753 34,5653 82 20 80 11,8526 35,0780 77 25 75 12,0329 35,5990 72 30 70 12,2161 36,1286 67 35 65 12,4024 36,6668 62 40 60 12,5918 37,2139 58 45 55 12,7844 37,7702 53 50 50 12,9803 38,3359 48 Table 2B: Butanol‐Heptane blend Organic compounds percentage must not exceed a certain percentage in the blend, otherwise the fuel would have a too much high RON and would be too difficult to ignite and control during combustion. The results don’t show three blends with the same (A/F)st, but two of them present very similar values with reasonable blending ratio: the first one is indicated by the red line in the table above, referred to butanol blend. The second one involves benzaldehyde blended with n‐heptane, shown in the table below.
Heptane (%) Benzaldehyde (%) (A/F)st LHV RON
10 90 10,7113 34,0253 108 15 85 10,8817 34,4313 102 20 80 11,0584 34,8522 96 25 75 11,2418 35,2888 90 30 70 11,4322 35,7422 84 35 65 11,6299 36,2131 78 40 60 11,8356 36,7027 72 45 55 12,0496 37,2122 66 50 50 12,2724 37,7427 60 Table 1C: Benzaldehyde‐Heptane blend As it is presented, the (A/F)st is around 11.8 for both the blends and RON is slightly higher than 70: these are suitable conditions for PPC application in a diesel engine.
26 Butanol blending percentage is quite high in the first blend: that fact could lead to unstable combustion at low loads but it’s interesting to investigate also this possibility to test limit of organic compounds before misfire. The other solutions show lower or higher values of (A/F)st compared with these first two: it might be worth it to investigate chemical structure, looking for a similar blending structure with butanol or benzaldehyde. The blending ratio is also important: there is already a high organic compound ratio provides by butanol blend (80%) so now it’s required to remain around 60% like in the benzaldehyde case. The table below shows anisole properties: its chemical structure presents a benzene ring and oxygen just like benzaldehyde, so their structures are quite similar (C7H6O for benzaldehyde and
C7H8O for anisole).
Heptane (%) Anisole (%) A/F st LHV RON
10 90 10,8449 34,2853 100 15 85 10,8520 34,6972 95 20 80 10,8600 35,1229 90 25 75 10,8690 35,5630 84 30 70 10,8792 36,0183 78 35 65 10,8909 36,4896 73 40 60 10,9045 36,9777 67 45 55 10,9205 37,4835 62 50 50 10,9395 38,0081 56 Table 1D: Anisole‐Heptane blend The three fuel blends used for the tests on the heavy duty diesel engine are the following: 1) 20% heptane – 80% butanol 2) 40% heptane – 60% benzaldehyde 3) 40% heptane – 60% anisole
27
CHAPTER 2 – EXPERIMENTAL SETUP AND MEASUREMENTS
2.1 ENGINE AND SETUP
The test setup used, referred to as CYCLOPS, based on a 12.6L six‐cylinder DAF diesel engine, model XE355c. Cylinder 1 is isolated as test cylinder, cylinder 4, 5 and 6 are operated by the stock engine control unit and used to propel the engine, even when the test cylinder is not fired. Cylinders 2 and 3 are empty, without pistons. Figure 2.1: CYCLOPS setup Figure 2.2: Engine Figure 2.3: CYCLOPS setup, hydraulic dynamometer and smoke meter
28 The figure below shows the schematic overview of the test engine.
A standalone fuel injection system propels the test cylinder, which is composed of a Resato double acting air‐driven high‐pressure fuel pump, a pressure regulator and a prototype Delphi injector. The Atlas Copco air compressor provides up to 5 bar of intake air pressure, while exhaust pressure is set to 0.3 bar higher than intake pressure (the reason stands on a correct use of EGR). EGR flow is cooled by an EGR cooler using a variable flow of process water as a coolant medium, temperature can be lowered to 30°C. After the EGR cooler there is a cooled EGR tank, which acts like a intermediate storage for the cooled flow, before the flow pressure drops in the EGR valve. The cooled EGR flow is mixed with the fresh intake air from the air compressor, inside a second tank located before a heater that heats the intake charge to the desired temperature. The air‐circuit and fuel‐circuit of cylinder 1 is separated from the other cylinders. The fuel is directly injected inside the test cylinder using a single ncv (nozzle check valve) 2mm injector. Figure 2.4: Schematic overview of the CYCLOPS setup
29 Engine geometrical characteristics are listed in the table below.
Bore [mm] 130 Stroke [mm] 158 Connecting rod [mm] 266,7 Compression ratio [‐] 15,7 Bowl shape M‐shaped Bowl diameter [mm] 100 Number of valves 4 Exhaust valve close (EVC) [°CA] ‐346 Intake valve close (IVC) [°CA] ‐153 Exhaust valve open (EVO) [°CA] 128 Intake valve open (IVO) [°CA] 344 Table 2A: Geometrical properties of the engine
The compression ratio of the test cylinder has been altered from the original 17:1 to 15,7:1 to allow longer fuel‐air mixing. The engine is connected to a Schenk W450 hydraulic dynamometer: it can be used to measure force, torque and power (for CYCLOPS it is not useful for that purpose because there are the three cylinder propelled by diesel connected to it and not only the test cylinder). It works as a hydraulic brake connected to the crankshaft. Figure 2.5: Resato fuel pump Figure2.6: Schenk W450 hydraulic dynamometer
30
2.2 EMISSION MEASUREMENT SYSTEM
The exhaust system of the test cylinder is separated from the other diesel cylinders. Exhaust gas from the first cylinder goes directly into a tank and then it is recirculated into the EGR cooler: part of it is sent to the emission measurement systems if the setup. These systems include a Horiba measurement system, a smoke meter and the engine exhaust particle sizer (EEPS). These devices detect HC, CO, NOx and soot emissions, analysing exhaust gas samples after test cylinder combustion and they are directly connected to the data acquisition system inside the engine control room. 2.2.1 HORIBA MEASUREMENT SYSTEM In order to fight exhaust emissions, research and development into the engine periphery is being vigorously pursued. To facilitate engine tests, there is a strong need for a measurement system capable of adapting to changing test requirements. The Horiba Mexa 7100 DEGR exhaust analysis system can measure HC, CO and NOx with three different methods for each emission respectively: Flame ionization method (FID) The sample gas is introduced into a hydrogen flame inside the FID. Any hydrocarbons in the sample will produce ions when they are burnt which are detected using a metal collector which is biased with a high DC voltage. The current across this collector is thus proportional to the rate of ionisation which in turn depends upon the concentration of HC in the sample gas. Non‐dispersive infra‐red method (NDIR) Each constituent gas in a sample will absorb some infra red at a particular frequency. By shining an infra‐red beam through a sample cell (containing CO or CO2) and measuring the amount of infra‐red absorbed by the sample at the necessary wavelength, a NDIR detector is able to measure the volumetric concentration of CO or CO2 in the sample.
Cheluminescent method The reaction between NO and O3 (ozone) emits light. This reaction is the basis for the CLD in which the photons produced are detected by a photo multiplier tube (PMT). The CLD output voltage is proportional to NO concentration.
31
2.2.2 SMOKE METER
Increasingly stringent emission regulations for combustion engines are the main drivers for high‐ performance emission measurement instruments. The measurement challenges of engines equipped with exhaust after‐treatment systems are high pressures and temperatures at the exhaust sampling point combined with high emission rates. The AVL Smoke Meter uses the filter paper method to determine the Filter Smoke Number (FSN defined according to ISO 10054) and the soot concentration in mg/m3. This smoke meter has a measurement range of 0 to 10, in which 0 corresponds to the original reflection if the white paper and 10 corresponds to no light reflection. The sampled engine exhaust gas passes through clean filter paper: soot causes the blackening of the filter paper. The paper blackening is measured by a photoelectric measuring head and the result is analysed by a microprocessor. By default the AVL Smoke Meter is equipped with a remaining filter paper indicator on the front of the housing. The led is clearly visible and indicates when the paper supply is low, making it easy to tell whether the paper roll should be replaced. Figure 2.7: AVL smoke meter
32 The exhaust sampling scheme of the smoke meter is shown in the figure below. Some technical data are also presented in the following table. Figure 2.8: Exhaust sampling Figure 2.9: Technical data
33
2.2.3 ENGINE EXHAUST PARTICLE SIZER
The engine exhaust particle sizer (TSI EEPS 3090) spectrometer is a fast‐response, high resolution instrument that measures very low particle number concentrations in diluted exhaust. It is used in the experiments to obtain detailed information about particle concentration and size distribution. It is well‐suited for dynamic and transient test cycles, with real‐time data collection: it measures the size distribution and number concentration of engine exhaust particle emissions in a range from 5.6 to 560 nanometers. The EEPS works charging positively the particles: these are then introduced to the measurement region near the centre of a high‐voltage electrode column. A positive voltage is applied to the electrode and creates an electric field that repels the positively charged particles outward according to their electrical mobility. Charged particles strike the respective electrometers and transfer their charge: a particle with higher electrical mobility strikes an electrometer near the top, whereas a particle with lower electrical mobility strikes an electrometer lower in the stack. This multiple‐detector arrangement using highly sensitive electrometers allows for simultaneous measurements of multiple particle size. Figure 2.10: EEPS
34 A data rate of 1 Hz (electrometers currents are read 1 times per second) enables to identify and correlate particle emissions with specific engine events during the cycle. Hot engine exhaust contains both solid particles (for example carbonaceous soot and ash) and volatile vapours (such as water, sulfate and hydrocarbons). In these experiments, a constant volume system (CVS) tunnel is used for emission testing: that means volatile substances have a chance to condense into droplets, which are detected, as particle together with non‐volatile solid particles. In order to measure only the solid fraction, dilution and thermal condition is required. Dilution can decrease the number concentration of droplets formed in the CVS but it is unable to evaporate them. (passing through the CVS lead to decrease concentration and temperature of the volatile compounds, it is already a first dilution). The second dilution keeps the temperature constant but decreases the volatile mass concentration further. However, the sample needs to be heated above the evaporation point of the volatile compound, after the second dilution, using a thermal conditioner. Before entering the EEPS, the volatile compounds remain in the vapour phase during the cooling process and don’t cross the nucleation curve. In these experiments, real‐time sampling rate and a sampling period of EEPS is set at 1 Hz and 1 minute respectively. The overall dilution ratio is 355. Figure 2.11: EEPS operation process Figure 2.12: Dilution effect
35
2.3 DATA ACQUISITION SYSTEM
The engine is equipped with all the required sensors for engine tests, such as intake and exhaust pressures, intake and exhaust temperatures, cooling water and oil. These quasi steady‐state engine data, together with air and fuel flows and emission levels are recorded at 20 Hz for a period of 40 seconds by means of an in house data acquisition system called TUeDACS. The average of these measurements is taken as the value for the operating point under investigation.
Recording and processing the so‐called fast changing parameters is on the system SMETEC Combi combustion analyser: these fast data, such as in‐cylinder pressure (measured by an AVL GU21C piezo‐electric pressure transducer), common rail fuel pressure and injector current, are fundamental to understand the cyclic variations on each experimental point. All of the channels are logged at 0,1°CA increments for 50 consecutive cycles. From these data, the average and standard deviation of important combustion parameters, such as CA10, CA50 and IMEP (Indicated Mean Effective Pressure) are calculated online by SMETEC software. For the final analysis, the data re post‐process with a custom Matlab script.
36
CHAPTER 3 – PARAMETERS BACKGROUND
3.1 FEATURED COMBUSTION PARAMETERS
The aim of the tests on the heavy duty diesel engine is to control the combustion parameters in order to acquire target information, which allows to study and analyse the engine performances in terms of combustion and emissions.Therefore, it is important, before the tests, to define which combustion parameters will be controlled and acquired real‐time (while the engine is running) and which ones will be investigated with the post‐processing analysis.
In the next part, these different parameters will be described: the results of the research are based on the three different fuel blends (designed in the first chapter) behaviour related to the controlled combustion parameters.
3.1.1 COMBUSTION PHASING – CA50
Advanced model‐based combustion control strategies are typically used to maintain optimal combustion timings, regulate cycle‐to‐cycle variation (CA50 and IMEP) and adjust combustion rate to control peak pressure and PRR (Pressure Rise Rate).
Optimum combustion timing can decrease the emission levels (HC and CO emissions), reduce the cyclic variability and extend the PPC operating range. Crank angle position corresponding to 50% heat release (CA50) is the most commonly used combustion phasing parameter. In PPC combustion strategy, combustion phasing is also a control variable for engine combustion control: the optimum CA50 indicates the best combustion conditions in terms of stability and efficiency. The control of the CA50 is directly related to the SOA (Start Of Actuation) parameter, which allows to moving the combustion advanced or delayed, changing temperature and pressure inside the cylinder. The faster calculation of CA50 can use signals from sensors inside the cylinder, such as ion current, knock and microphone sensors. It is possible to calculate CA50 from cylinder pressure: CYCLOPS setup has an in‐cylinder piezo‐electric pressure transducer and the fast data acquisition system (SMETEC Combi) can calculate real‐time the CA50 position during the combustion.
37 The need to underline combustion phasing as an important combustion control parameters, comes from tests strategy: before testing the three alternative fuels at different loads (8, 12 and 16 bar IMEPg), the optimum CA50 needs to be find. Once the optimum CA50 is set, during the test it will not change: it will remain constant while the other parameters will change to analyse the combustion. The research of the optimum CA50 and the importance of phase combustion changing will be investigated closer in the next chapters. 3.1.2 GROSS INDICATED MEAN EFFECTIVE PRESSURE ‐ IMEPg Normally, if torque and displacement of an engine are known, it is a very practical way to calculate the Brake Mean Effective Pressure (BMEP), for studying the performance of an engine. The CYCLOPS layout does not allow the use of BMEP because the measured torque from the dynamometer is not directly related to the test cylinder but it refers to the whole setup (including the other three cylinder). That is the reason why, in this research, the IMEP value is used, which does not consider the mechanical efficiency. The net indicated mean effective pressure (IMEPn) is calculated from in‐cylinder pressure over the complete engine cycle (720° in a four‐stroke engine), where P is the in‐cylinder pressure and Vd is the displacement volume.
𝐼𝑀𝐸𝑃
∙Figure 3.1: IMEP representation
38 In this research, to evaluate the combustion performance at different intake pressures and exhaust pressures, the gross indicated mean effective pressure (IMEPg), which excludes the gas exchange stroke (it refers to compression and expansion stroke only, which is 360° in a four‐stroke engine), is used as the engine reference load and calculate the indicated emissions.
𝐼𝑀𝐸𝑃
∙ 3.1.3 AIR EXCESS RATIO ‐ λ Engine air‐fuel ratio is defined as the mass flow rate of fresh air to fuel and it is called α.𝐴
𝐹
𝑚
𝑚
𝛼
The air excess ratio is defined as:𝐴
𝐹
𝐴
𝐹
𝜆
Diesel engines normally work with lean combustion, which means λ > 1: compression ignition engines need an air excess to work properly and this leads to high NOx and soot, with low HC and CO emissions. Figure 3.2: Emissions trend with AFR
39 The air‐fuel ratio is a key parameter in LTC methods, which are designed to improve the NOx‐soot trade off lowering the combustion temperature and burning cleaner fuels. The λ value is directly connected to the EGR (Exhaust Gas Recirculation) ratio, defined as the mass flow rate ratio of EGR to the sum of fresh air and EGR. It is also experimentally determined from the ratio of the CO2 volume concentration in the intake gas to the CO2 volume concentration in the exhaust gas. If EGR rate increases, λ increases too and temperature decrease fast. During the tests, EGR rate will be changed between certain value to investigate how the emissions behave when the combustion is richer or leaner at the same load. The calculation of λ in this research is based on Brettschneider equation, which provides the λ‐ value based on exhaust emissions and fuel composition. 𝜆 𝐶𝑂 𝐶𝑂2 𝑂 𝑁𝑂 𝐻4 𝑥 3.5 3.5 𝐶𝑂𝐶𝑂 𝑂 2 𝑥 𝐶𝑂 𝐶𝑂 1 𝐻4 𝑂2 𝑥 𝐶𝑂 𝐶𝑂 𝐶 𝑥 𝐻𝐶 Hcv is the atomic ratio of hydrogen to carbon in the fuel, Ocv is the atomic ratio of oxygen to carbon in the fuel and Cf is the number of carbon atoms in each of the hydrocarbons molecules being measured by Horiba system. The λ obtained is accurate within 1% and it describes different mixtures: stoichiometric ( λ = 1 ), lean combustion ( λ > 1) and rich combustion ( λ < 1 ). 3.1.4 INTAKE TEMPERATURE AND PRESSURE Managing the supply of the intake charge up to the start of combustion position is a critical aspect in modern engines and can impact on emissions, performance and fuel economy. The intake charge supplied to the combustion chamber at all operating conditions meets a number of requirements:
‐ Sufficient quantity of Oxygen is available to ensure complete combustion
‐ Sufficient amount of diluent (e.g., EGR) is present to control the combustion temperature ‐ The temperature and pressure (density) of the charge air in controlled
40 ‐ Suitable bulk motion and kinetic energy is given to the charge air in the cylinder to support
the mixing of air, fuel and intermediate combustion products
In older diesel engines, that did not have to meet stringent exhaust emissions requirements, intake charge systems were relatively straightforward. It was sufficient to ensure that air was clean and that the flow capacity of the intake system was adequate to ensure peak torque and power objectives.
After a while an increasing sensibility towards lower emissions required better controlled intake air properties and matched to suit the engine operating conditions.
Turbocharger, EGR rate were introduced to have higher intake pressure and to lower cylinder temperature: moreover, higher and higher intake pressures required that the intake temperatures, resulting from compression, have to be limited. There are also two main aspects of intake temperature: ‐ Limiting the maximum temperature ‐ Managing low charge temperatures to facilitate engine start‐up, warm‐up and emission control
A too much high intake temperature leads to lower energy density of the intake charge and combustion temperature can become too high, which means higher exhaust emissions.
A too low temperature instead can be problematic in firing the engine and the emissions can be too high during the engine warm‐up. That is the reason why intake air coolers are installed in boosted engines.
In conclusion, higher intake air pressure allows a better mixing inside the cylinder, but higher pressure means higher temperature which is not suitable for a good combustion. Intake air temperature must be controlled, if it is too high in a Diesel engine a lot of NOx emissions will occur.
In this research, the intake pressure value is set higher than the exhaust pressure (0.3 bar difference) to prevent a return of emission gases from the exhaust manifold back to the cylinder.