978-1-5386-5186-5/18/$31.00 ©2018 IEEE
Modeling soil erosion and sediment load for Red
River basin (Vietnam): impact of land use change and
reservoirs operation
Le Van Thinh
Thuyloi University, Vietnam Email: [email protected]
Roberto Ranzi
Università degli Studi di Brescia, Italy Email: [email protected]
Maria Cristina Rulli
Politecnico di Milano, Italy Email: [email protected] Abstract-Erosion and sediment transport have criticalimplications for aquatic ecology, agriculture, water supply and river navigation. In recent years, with the construction and operation of several reservoirs in Red river basin (China-Vietnam), such as Hoa Binh, Lai Chau, Son La, Thac Ba, Tuyen Quang etc., this issue has raised high interest and concern. Reservoirs have been built to meet several important needs including: increasing energy, irrigation, and drinking water demand. However, there are some important issues related to the construction and operation of reservoirs, which the decision maker should pay attention on: they trap sediments and reduce sediment concentration in rivers downstream reservoir, then increasing riverbank erosion and localized erosion around hydraulic structures. In addition, land use change is also to be considered as causing effect on sediment erosion and transport. The aim of this work is to evaluate the effects of separate factors (reservoirs, land use change) and also the combination of such factors on sediment load in the Red River basin. To make this evaluation, an updated and enhanced version of the soil erosion and transport model at the catchment scale, namely DIMOSHONG_RUSLE is applied to the Red river basin. More than 50 years of monthly precipitation, runoff and suspended sediment load data at the monthly scale are processed. Two different historical landuse maps 1983 and 2000 of Da river (right bank of Red River) and a random land use change of Lo river (left bank of the Red River) were also generated base on statistic data of the government. The effect of land use change, reservoirs is assessed on the basis of trends observed in the last decades. Results are in good agreement with observed data. The trap efficiency of the model for Thac Ba reservoir (1971) and Hoa Binh reservoir (1985) are 90% and 94%, respectively, causing the sediment load at Son Tay stations decrease of 55%. Following the construction of two additional reservoirs, Tuyen Quang reservoir (in Lo river) in 2005, and Son La reservoir (in Da river) with the deposition coefficient of 92% and 67%, the result was caused the coefficient sediment of the Da river cascade system decreases 98% (at Hoa Binh station), and also makes the sediment load to lower reach of the Red River 92% (at Son Tay station).
Key word: Soil erosion; sediment load; reservoirs; land-use change; Red River (Vietnam).
I.INTRODUCTION
The Red River system is the second largest river in Vietnam, after the Mekong river system. It is located from 20o0N to 25o30N, and 100o00E to 107o10E. The total area of
the basin is approximately of 169,000 km2, where 81,200 km2
(48%) of the basin area is in China’s territory, 86,660 km2
(51.3%) in Vietnam, and 1,100 km2 in Laos. Administratively,
the Red River basin covers 26 provinces and cities in the Northen region of Vietnam, with three major tributaries of Da river, Lo river, and Thao river (Fig.1). The Red River basin spreads across three regions: mountainous, midland and lowland. The basins are divided into seven irrigation areas based on shape of river and terrain feature [5].
A. The terrain and geomorphology of the Red River
The Red River basin shows complex topography having more than 90% of the hilly area, 70% of the area with elevation over 500m a.s.l. and the average elevation of the basin is 1090m. The topography of the Red River basin is divided into four regions: The Western part consists of large and high mountains located in China; The Northeast is lowland, with the elevation of 600-700m; The Midlands consists of hills stacking bowls alternating with low valleys, having elevation of 150-200m a.s.l. The river delta shows relatively flat terrain, with an average slope of about 0.1m / km from Viet Tri to the sea, with the main slope being North West - South East.
B. Rainfall and runoff in the Red River basin
Rainfall in the Red river basin is characterized by two seasons including rainy season (May to October) and dry season (November to April). Annual rainfall varies from 1,200 to 4,800 mm/yr in Vietnam, 80% of rainfall occurring in rainy season (Fig. 2).
Annual average of main flow characteristics in the Da river basin were calculated based on actual flow data of Hoa Binh station. The average discharge is 2,776 m3/s and the total flow
in the catchment area is 55.6 billion m3. The annual flow tends
to increase from upstream to middle and downstream. The This research was supported by Vietnam International Education
average annual value in Ly Tien Do is 25.2 l/s.km2, Lai Chau is
33.1 l/s.km2 and it increase a little moving to Hoa Binh.
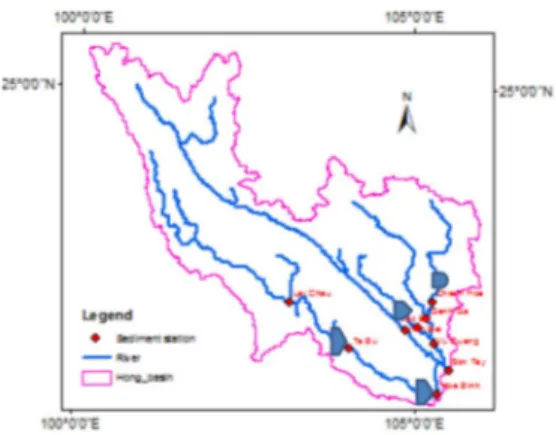
Fig. 1. The Red River basin gauged at Son Tay.
Fig. 2. Monthly precitation in Red River basin (1961-2015).
C. The Red River sediment regime
Red River sediment is mainly supplied by Da river and Thao river. Approximately 72 Mt/yr of sediment is transported through Hoa Binh, that is equal to 57% of the Red River sediment load through Son Tay. The Thao river sediment is approximately 45 Mt/yr, accounting for 35% of the Red River sludge. The sediment load of Lo River is only 9.8 Mt/yr, accounting for about 7.7% of Red River sedimentation. The low amountof sediment load in Lo river might be explained by the type of soil that is composed by many limestone, and granite tutext on the surface.
The difference between the maximum and minimum turbidity during the year of observation is very large. Red River sediment regime strongly depends on the flood regime with about 80% of sediment yield occurring during the flood season. Annual sediment concentration measured in the Red River ranges from 100 g/m3 to 500 g/m3. The average sediment
concentration in Da river at Lai Chau is 1600 g/m3, Ta Bu 1430
g/m3, Hoa Binh 1130 g/m3; In the Thao river at Lao Cai is 2739
g/m3, Yen Bai 1760 g/m3; in Lo-Gam river at Genh Ga is 400
g/m3, Chiem Hoa 410 g/m3. In the main branch of Red River at
Son Tay is 1010 g/m3 (Fig. 1). According to our estimation, the
amount of sediment transported by Red River to the sea is about 120 Mt/yr.
Dam construction is one of the causes of reduced sedimentation [42].
Land cover plays an important role in hydrological response and in sediment detachment and transport [30]; [31].
Assessing the effect of land use change (deforestation/afforestation) on soil losses is crucial for understanding river sediment load. In general, crops cultivation can cause an increase in erosion and sediment transpost, whereas, the forest has usually the effect of protecting soil from water erosion by decreasing the impact of rainfall on soil and the overland flow generation [32], [33], [34] [43]. The effect of land use change and land use pattern on hydrological response and sediment load has been analysed by many authors (es. [40],[38], [35], [17],[2]).
2. METHODOLOGY A. Routing Dimoshong Rusle model
The Universal Soil Loss Equation (USLE) was proposed in 1978 by Wishmeier and Smith [44], and its revised version was developed by Renard et al. [29] and it is used to predict average erosion in watershed. It consists of 6 parameters: R the rainfall-runoff (erosivity) factor, K the soil (erodibility) factor, L the slope length factor, S the slope gradient factor, C the crop and management factor and P the conservation support practice factor. The USLE/RUSLE model is often represented by the equation:
A = R·K·LS·C·P (1) a) Rainfall-runoff erosivity factor (R): R factor was calculated based on the 30 minute rainfall. In case of only daily data are available, the Fournier method can be used [33]:
F =∑ P /P ; R = 4.17*F -152 (2) where: F is the Fournier index, Pi is the monthly rainfall
index, Pyear is the annual rainfall index. Pagonos et al. [22] used
global rainfall data to draw map global erosion.
For this study, R factor has been determined using the method of Loureiro và Coutinho [13], Ranzi et al. [28]:
R= ∑ ∑ 7.05 88.92 , (3)
where: N is the number of observation years, rain10 is monthly rainfall, when ≥10 mm/day; days10 is monthly number of days with rainfall ≥10 mm.
This formula was also developed by López-Vicente et al. [14], [15] successfully applied for rainfall 10 years in the basin of Pre-Pyrences, Spain. In addition, the authors conducted a comparison with the 30-minute rainfall data of the rainfall stations in the Red River basin such as Hoa Binh Air and Water Testing Station, Dong Cao experiment station, and Son Dong experiment station in the northeast.
b) Soil erodibility factor (K): K facotr depends on the terrain, soil type and rainfall characteristics of the basin. The coefficient K was studied in the United States from 0.029 to 0.047 [44]. For Vietnam, Ranzi et al. [28] when calculating erosion for the Lo river basin assumed the average of K factor for the entire basin was 0.022, Vezina et al. [40] caculted K factor for some types of soils in the Ba Be reservoir.
In this study, K facotr is calculated by distributed model, depending on the soil type, soil texture, soil permeability, soil component ratio, and soil organic matter content in each zone
field of study. K factor was determined by using the method in [39] and [33]:
K = (k0*kt + ks + kp) / 759.4 (4) Where: k0, kt, ks and kp are subfactors depending on different soil characteristics, as texture, drainage capacity, structure, and organic matter content.
The soil erodibility organic matter subfactor [3]is:
k0=12 – Om * 1.7 (5)
Om –percent inherent soil organic matter
The soil texture subfactor equation is given by [45]: If Psl + Pvfs ≤ 68 then ktb = 2.1[(Psl + Pvfs)(100-Pcl)]1.14/10000 (6) kt = ktb if Psl + Pvfs > 68 then kt68 = 2.1[68(100 - Pcl)]1.14/10000 (7) kt = ktb – [0.67(ktb-kt68)0.82] (8)
Psl - percent silt; Pvfs - percent very fine sand; Pcl -
percent clay.
The soil profile permeability subfactor
kp=2.5 * (Pr - 3) (9)
Pr – soil profile permeability rating, can be determined
follow Tao et al. [37]. The soil structure subfactor
ks=(2 - Ss) * 3.25 (10)
Ss – soil structure class
c) Slope length and slope gradient factor (LS): There are many different formulations of LS, including the formula [44], [7]. In this study, the author adopted Moore & Burch's formula [18], which has been successfully applied in the Italian basin by Pilotti & Bacchi [24]:
' ' 0896 . 0 sin . 1 . 22 n m s A LS= β (11)
where: As is the area of plot per unit width; m’, n’ are
calibration coefficients; β is slope angle, computed from the DEM.
d) Cropping, vegation cover and management factor (C): C factor is determined according to literature clasification of CORINE Land Cover for European country by Cebecauer et al. [6]. Refer to different authors computed for Vietnam as Cao [4], Vezina et al. [40], Phan et al. [26] based on the SWAT model for the Thai Nguyen area. Ranzi et al. [28] have selected the crop coefficient for Lo - Gam river. Also refer to some Chinese studies ([47], [48]) for similar basins and close to Vietnam.
e) Supporting practice factor (P): P factor is calculated basing on Panagos et al. [23] for European country and Cao [4] for basin in Vietnam.
Using optimization methods to find C parameter for each crop, P fits to the terrain and cultivation measures on Red River basin.
B. Sediment transport in river
Based on the Yang study [46], the river sediment transport capacity was determined. Simultaneously based on sediment transport assumptions according to linear reservoir rules Ranzi et al. [28], and has been successfully applied to the Mekong [36]:
)
1
(
/ , / , 1 , , , k k T i k T k i s k i sq
e
S
e
q
− θ − θ −+
−
=
(12)whrere: qs,i,k (tons/day)- the suspended sediment discharge
at each basin gauging station; T- duration of each month;θk-
mean travel time of basin, depending on the mainstream length and velocity of flow; Sk,i-accumulated monthly sediment
production.
The monthly sediment yield after transport is:
)
1
(
)
1
(
/ , , / , 1 , , ,=
−
+
+
−
− − − k ki ki k T k T k k i s k i sq
e
S
T
S
e
V
θ
θθ
θ (tons) (13)3. RESUTLS AND DISCUSSION A. Simulation result of the model
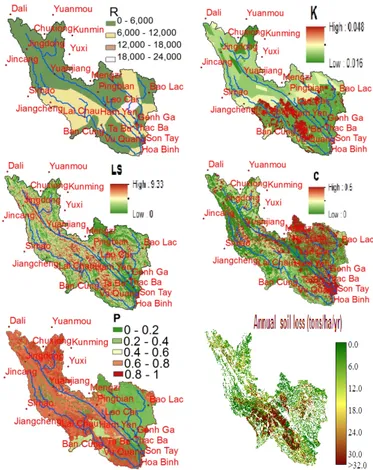
+Rainfall-runoff erosivity factor (R):
Based on rainfall data from 1961 to 2015 [10] of 46 stations on Red River, obtaining from IMHE of Vietnam and China data Center, we calculated R factor through formula (3) and the results are shown in Fig. 3a.
+Soil erodibility factor (K):
Based on soil map available from Atlas Vietnam (1999) [1] for Vietnam territory, and soil map from SOIL-FAO database (1995) [8] for China territory, we determined K factor value according to formula (4) and it is shown in Fig. 3b.
+Slope length and slope gradient factor (LS):
It was computed from DEM and equation (11) and it is reported in Fig. 3c.
+Cropping, vegation cover and management factor (C): They were caculated basing on land use 2000 and they are reported in Fig. 3d.
+Supporting practice factor (P):
It is based on the actual data arable crops and the topography of the region and it is shown in Fig. 3e.
+Average annual erosion A (tons/ha/yr) by RUSLE model, is reported in Fig. 3f.
To compare the sediment load simulated by model and observation data at measuring stations, the Nash-Sutcliffe Efficiency (NSE) is used giving the following results: Hoa Binh 0.65 to 0.72, Ta Bu 0.67 to 0.75, Chiem Hoa 0.51, Thac Ba 0.70, Genh Ga 0.56, Vu Quang 0.61, Yen Bai 0.55 and Son Tay 0.58 (Table 1).
Fig. 3. Spatially distributed parameters and annual erosion of basin (tons/ha/yr).
TABLE1. EROSION MODEL PERFORMANCES FOR RED RIVER BASIN
Station Period NSE
Hoa Binh 1961-1985 0.65 1986-2005 0.72 2006-2014 0.72 Ta Bu 1961-2005 0.67 1986-2005 0.73 2006-2014 0.75 Chiem Hoa 1965-2004 0.51 Thac Ba 1961-1970 0.7 Ghenh Ga 1961-2004 0.56 Vu Quang 1961-2004 0.61 Yen Bai 1961-2007 0.55 Son Tay 1961-1985 0.58
B. Impact of reservoir to sediment transport
In the 1971-1985 period, there was the only one Thac Ba reservoir in the Chay River (tributary of the Lo River), resulting in sediment deposition of 94% (average of 1961 to 1970 was 3.33Mt/yr, 1971 to 1975 was 0.18 Mt/yr). Sediment in Son Tay have not seen significant decline.
When the Hoa Binh reservoir was put into operation (1988-2004), the sediment deposited at the reservoir was in average 53 Mt/yr. The sedimentation rate of Hoa Binh was 90%. Thus, the average annual sediment load of the Red River in Son Tay decreased from 120 Mt/yr to 54 Mt/yr (55%). Since Hoa Binh reservoir has been put in operation, almost all the length of the Da river from Hoa Binh reservoir to Trung Ha (about 55 km)
has been eroded, especially in the 20 km downstream branch of the dam. In this reach erosion depths are up to10m, average 3-5m, and the erosion process is gradually moving to the confluence with the Viet Tri river [21], [19].
Tuyen Quang reservoir was put into operation in 2005. In the following years there was a significant decrease in sediment in Chiem Hoa (73%). The combined impact of Tuyen Quang and Thac Ba hydropower projects resulted in a 67% reduction in sediment accumulation at the Vu Quang station from 11.13 Mt/yr (1961-2004) to 3.62 Mt/yr (2005-2014). The effects of Thac Ba, Hoa Binh, and Tuyen Quang reservoirs are one of the causes of reducing of the amount of sediment transported to Son Tay (79%).
In year 2013, the combination of Thac Ba, Hoa Binh, Tuyen Quang, and Son La reservoirs went into operation resulting in the subsequent years in the reduction of sediment load at Hoa Binh station. In particular, sediment yield decreased from 60.3 Mt/yr (1961-1987) to 0.85 Mt/yr, approximately 98%, thereby greatly influencing the amount of sediment of Son Tay (92%) moving from 120 Mt/yr without reservoir to 9.5 Mt/yr when the reservoir is fully operational. These results are similar to the results of Lu et al. [16] and Vinh et al. [41].
On the Thao River at Yen Bai, although there is no reservoir built on the Vietnamese part, based on observation data, we found that in 2010 the Chinese part has a reservoir in operation. The amount of sediment measured at Yen Bai station decreased from 47 Mt/yr (1961-2008) to 8 Mt/yr (2009-2014).
C. Land use change affect on sediment load
In the Red River basin, the data on land use is asynchronous, we analysed 2 scenarios.
Scenario 1: For the Da river basin (right tributary of the Red River), land use maps available are related to the year 1983 and 2000. The comparison between the 2 land use maps showed that the amount of sediment substantially decreased in Son La stations decreased from 57.6 Mt/yr ( land use 1983) (Fig. 4a) to 52.4 Mt/yr (land use 2000) (Fig. 4b). This is explained by the impact of the transition from shrubs to plantations and forest.
Scenario 2: In contrast, the 1983 land use map was not available in the Lo river basin. Based on the empirical data from Pham [25], from the 2000 map (Fig. 5), the authors assume random land use change from 35% of forest into 20% of shrubs and 15% of rice. The result increases the amount of sediment by 28% [28].
The results of the change in mats trend are consistent with those of Khoi et al. [11] for the Be river basin and Phan et al. [26] for the Cau river basin, Lopez et al. [14], [15] for the Amas River Basin, Spain. According to Nguyen et al. [20], and Podwojewski et al. [27] plot experiment in Hoa Binh, the effect of cultivation tea and cassava on soil detachment is twice higher for runoff coefficient and ten times higher for soil loss than that of other plants.
Fig. 4. Land use maps of 1983 and 2000 of Da river basin (right bank of Red River)
Fig. 5. The cropping, vegetation management of Lo River Basin (left bank of the Red River)
D. Discussion the results
The process of erosion and sediment transport is a complex process.The result of the model simulations for 8 stations and sediment flow measurement show NSE from 0.51 to 0.75, so meeting the technical requirements. However, the results of model simulations are usually smaller than monitoring data on the flood season. This can be explained by the fact that Red River Basin is a large basin, so frequent natural phenomena abnormalities such as flash floods, debris flows, landslides and erosion phenomenon that model has not taken into account can occur in the flood season as [9].
Based on the calculation results of Hoa Binh and Thac Ba reservoirs, the sediment deposition rate is 90% and 95%, respectively, making the sand dunes at Son Tay Station reduced by 55%. After building the Tuyen Quang (Lo river) and Son La reservoirs (Song Da), trap coefficients become 73% and 92%, respectively. As a result, the sedimentation trap of the Da river cascade system decreased sharply by 98% and made the dredging coefficient in Son Tay very high (92%). The results obtained by this model are relatively consistent with Le et al. [12] calculations showing 75% sedimentation in Thac Ba and Hoa Binh reservoirs and Ranzi et al. [28] showing reservoir sedimentation at Thac Ba and Tuyen Quang reservoirs of 71% when put into operation.
This result confirms that the amount of sludge is greatly reduced under the effect of upstream reservoirs on the Red River. Particularly, a number of small reservoirs have been built on the tributaries and Lai Chau reservoir on the mainstream, and many of the Chinese reservoirs have been in operation, so the amount of sediment observed for four years (2010-2014) significantly reduced, especially in 2015.
IV.CONCLUSION
The Dimoshong Rusle distributed model was applied to the Red River basin for investigating erosion and sediment transport.
Three different scenarios have been analysed: 1) natural condition, i.e. without influence of the reservoirs, 2) after the building of Hoa Binh reservoir and Thac Ba reservoir, 3) after the buiding of the new reservoirs system. Before the reservoir building, the amount of sediment transported at Son Tay coming from the Da River was 51%, from the Thao River was 40%, and from the Lo River was 9%. However, after the reservoir, Song Da contributed 7%, Thao 65%, and Lo 28%.
From simulation results, it is possible to apply models to study the effects of other reservoirs being built in the Red River basin, as well as hydropower construction on the Chinese side. It is possible to expand the model of other factors affecting sediment transport such as the impact of future climate change and the impact of forest fires.
ACKNOWLEDGMENT
The authors are thankful to Institute of Meteorology, Hydrology and Environment (IMHEN) and China data Center for providing meteorological data.
REFERENCES
[1] Atlas of Vietnam., (1999). Soil map classification of Vietnam.
[2] Alatoree, L.C., Begueria, S., Lanna-Renault, N., Navas, A., Garcia-Ruiz, J.M., 2012. Soil erosion and sediment delivery in a mountain catchment under scenarios of land use change using a spatially distributed numerical model. Hydrol.Earth Syst.Sci,16,1321-1334.
[3] Bagarello, V., Di Stefano, C., Ferro, V., Giordano, G., Iovino, M., Pampalone, V., 2012. Estinating the USLE soil erodibility factor in Sicily, South Italy. American Society of Agricultural and Biological Engineers.
[4] Cao, D.D., 1992. Research and assessment the deposition of Hoa Binh reservoir and proposal some practice method to reduced the sedimentation. Institute of Metrorological and Hydrology (in Vietnamese).
[5] Castelletti, A., Pianosi, F., Quach, X., Soncini-Sessa, R., 2012. Assessing water reservoirs management and development in Northern Vietnam, Hydrol. Earth Syst. Sci., 16, 189–199.
[6] Cebecauer, T., Súri, M., Hofierka, J., Fulajtár, E., 2004. Corine Land Cover in the context of soil erosion assessment at a regional scale. [7] Desmet, P.J.J. and Govers, G. (1996) A GIS Procedure for
Automatically Calculating the USLE LS Factor on Topographically Complex Landscape Units. Journal of Soil and Water Conservation, 51, 427-433.
[8] FAO., 1995. Digital soil map of the world and derived soil properties. Food and Agriculture Organization of the United Nation, Rome. [9] Gavrilovic Z. 1988. The use of an empirical method (Erosion Potential
Method) for calculating sediment production and transportation in unstudied or torrential streams. International Conference on river regime, Wallingford (UK); 411-422.
[10] Institute of Meteorology, Hydrology and Environment (IMHEN), 1961-2015. Meteo-hydrology monthly during the periods of from 1961-1961-2015. [11] Khoi, D.N., Suetsugi, T., 2012. The responses of hydrological processes
and sediment yield to land-use and climate change in the Be River Catchment, Vietnam. Hydrol. Process.
[12] Le, T.P.Q., Garnier, J., Gilles, B., Sylvain, T., Chau, V.M., 2007. The changing flow regime and sediment load of the Red River, Viet Nam. Journal of Hydrology.
[13] Loureiro, N.S., Coutinho, M.A., 2001. A new procedure to estimate the RUSLE El30 index, based on monthly rainfall data and applied to the Algarve region, Portugal, Journal of Hydrology 250.
[14] López-Vicente, M., Navas, A., Machín J., 2008. Identifying erosive periods by using RUSLE factors in mountain fields of the Central Spanish Pyrenees. Hydrol. Earth Syst. Sci., 12, 523–535.
[15] López-Vicente, M., Lana-Renault, N., García-Ruiz, J.M., Navas, A., 2011. Assessing the potential effect of different land cover management practices on sediment yield from an abandoned farmland catchment in the Spanish Pyrenees. J Soils Sediments.
[16] Lu, X.X., Oeurng, C., Le, T.P.Q., Thuy, D.T., 2015. Sediment budget as affected by construction of a sequence of dams in the lower Red River, Vietnam. Geomorphology, 248, 125-133.
[17] Maeda, E.E., Pellikka, P.K.E., Siljander, M., Clark, B.J.F., 2010. Potential impact of agricultural expansion and climate change on soil erosion in the Eastern Arc Mountains of Kenya. Geomorphology, 123, 279-289.
[18] Moore, I.D., Burch, F.J., 1986. Physical basic of the length-slope factor in the Universal Soil Loss Equation. Soil Science Society of America Journal 50, 1294-1298.
[19] Negm, A.M., Abdel-Aziz, T., Nassar, M., 2017. Estimating the Life Time Span of Aswan High Dam Reservoir Using Numerical Simulation of Nubia Lake. The Nile River.
[20] Nguyen, N.K., Cao, P.N., 2004. Research on soil erosion in plot with different agricultural type. Vietnamese Institute of Meteo-hydrology (in Vietnamese).
[21] Nguyen, V.P., Vu, V.T., Tran, T.X., 2003. Water resource Vietnam. Agricutural Publicing (Vietnamese).
[22] Panagos, P., Borrelli, P., Poesen, J., Ballabio, C., Lugato, E., Meusburger, K., Montanarella, L., Alewell, C., 2015. The new assessment of soil loss by water erosion in Europe. Environmental Scien &Policy 54, 438-447.
[23] Panagos, P., Borrelli, P.,..., 2017.Global rainfall erosivity assessment based on high-temporal resolution rainfall records. Scientific Reports. [24] Pilotti, M., Bacchi, B., 1997. Distributed evaluation of the contribution
of soil erosion to the sediment yield from a watershed, Earth Surface Processes and Landforms 22 (13), 1239-1251.
[25] Pham, H., 2007. Evaluating potential of soil loss erosion in the Ba Be lake basin in Vietnam, Project, Hanoi-Vietnam, (in Vietnamese). [26] Phan, DB., Wu, C.C., Hsieh, S.C., 2011. Land Use Change Effects on
Discharge and Sediment Yield of Song Cau Catchment in Northern Vietnam. J. Envir. Science and Engineering. 5, 92-101.
[27] Podwojewski, P., Orange, D., Jouquet, P., Valentin, C., Nguyen, V.T., Janeau, J.L., Tran, D.T., 2008. Land-use impacts on surface runoff and soil detachment within agricultural sloping lands in northern Vietnam. Catena 74, 109–118.
[28] Ranzi, R., Le, T.H., Rulli, M.C., 2012. A RUSLE approach to model suspended sediment load in the Lo river (Vietnam): effects of reservoirs and land use changes. J.Hydrol.
[29] Renard, K.G., Foster, G.A., Weesies, D.A., McCool, D.K., Yoder, D.C., 1997. Predicting Soil Erosion by Water: A Guide to Conservation Planning with the Revised Universal Soil Loss Equation (RUSLE). Agriculture Handbook No.703, USDA, Washington DC.
[30] Rosso R., M.C. Rulli , (2002) An integrated simulation method for flash-flood risk assessment. 2. Effects of changes in land use under a historical perspective. Hydrology and Earth System Sciences, 6(2), 285-294. [31] Rulli, M.C., Rosso, R., 2005. Modeling catchment erosion after wildfires
in the San Gabriel Mountains of southern California, Geophysical Research Letters 32(19), L19401.
[32] Rulli, M.C., Rosso, R., 2007. Hydrologic response of upland catchments to wildfires, Advances in Water Research 30(10), 2072-2086.
[33] Rulli, M.C., Offeddu, L., Santini, M., 2013. Modeling post-fire water erosion mitigation strategies. Hydrol. Earth Syst. Sci. 17, 2323-2337. [34] Rulli M.C., R. Rosso , (2002) An integrated simulation method for
flash-flood risk assessment. 1. Frequency predictions in the Bisagno river by combining stochastic with deterministic method. Hydrology and Earth System Sciences, 6(2), 267–283.
[35] Rulli M.C., (2010 ) A physically based watershed partitioning method, Advances in Water Resources, doi: 10.1016/j.advwatres.2010.06.011. [36] Suif, Z., Fleifle, A., Yoshimura, C., Saavedra, O., 2016. Spatio-temporal
patterns of soil erosion and suspended sediment dynamics in the Mekong River Basin.Science of the Total Environment.
[37] Tao, C., Rui-quing, N., Ping-xiang, L., Liang-pei, Z., Bo, D., 2010. Regional soil erosion risk mapping using RUSLE, GIS, and remote sensing: a case study in Miyun watershed, North China. Environ Earth Sci.
[38] Tauro, F., Grimaldi, S., Petroselli, A., Rulli, M.C.,Porfiri, M. (2012) Fluorescent particle tracers in surface hydrology: A proof of concept in a semi-natural hillslope. Hydrology and Earth System Sciences Volume 16, Issue 8, Pages 2973-2983 DOI:10.5194/hess-16-2973-2012. [39] USDA-Agricultural Research Service.,2008. Revised Universal Soil
Loss Equation, Version 2 (RUSLE2).
[40] Vezina, K., Bonn, F., Pham, V.C., 2006. Agricultural land-use patterns and soil erosion vulnerability of watershed units in Vietnam’s northern highlands. Landscape Ecology 21 (8), 1311-1325.
[41] Vinh, V.D., Ouillon, S., Thanh, T.D., Chu, L.V., 2014. Impact of the Hoa Binh dam (Vietnam) on water and sediment budgets in the Red River basin and delta. Earth Syst. Sci., 18, 3987-4005.
[42] Walling, D.E., Fang, D., 2003. Recent trends in the suspended sediment loads of the world's rivers. Glob. Planet. Chang. 39, 111–126.
[43] Wardrop, D.H., Brooks, R.P., 1998. The Occurrence and impact of sedimentation in central Pennsylvania wetlands. Environmental Monitoring and Restoration 51, 119–130.
[44] Wischmeier, W.H., Smith, D.D., 1978. Predicting rainfall erosion soil losses, A Guide to Conservation Planning. Agriculture Handbook. [45] Wischmeier, W.H., Johnson, C.B., Cross, B.V., 1971. A soil erodibility
monograph for farmland construction sites. J. Soil and Water Conservation. 26, 189-193.
[46] Yang, C. T., 1973. Incipient motion and sediment transport. J. Hydraul. Div. Am. Soc. Civ. Eng., 99(HY10), 1679-1704.
[47] Zhang, K., Li, S., Peng, W., Yu, B., 2004. Erodibility of agricultural soils on the Loess Plateau of China. Soil and Tillage Research 76, 157-165.
[48] Zhang, K.L., Shu, A.P., Xu, X.L., Yang, Q.K., Yu, B., 2008. Soil erodibility and its estimation for agricultural soils in China. Journal of Arid Environments 72, 1002-1011.