L
IST OF
R
EVISIONS
Revision
Date
Scope of revision
Page
Title: Development of BE numerical tools for LFR design and safety analysis (2018)
Project: ADP ENEA-MSE PAR 2017
Distribution PUBLIC Issue Date 29.01.2019 Pag. RICERCA SISTEMA ELETTRICO Ref. ADPFISS-LP2-167 Rev. 0
4 di 163
(Page intentionally left blank)L
IST OF CONTENTS
L
IST OFR
EVISIONS... 3
L
IST OF FIGURES... 9
L
IST OF TABLES... 13
L
IST OF ABBREVIATIONS... 15
F
OREWORD... 17
1
T
HERMO-M
ECHANICS OF THE FUEL PIN–
DEVELOPMENT AND ASSESSMENT OF MODELS AND ALGORITHMS DESCRIBING INERT GAS BEHAVIOR FOR USE INTRANSURANUS ... 19
1.1
Progress from the results presented in the previous PARs ... 21
1.2
List of References ... 23
2
V
ALIDATION OFRELAP53D
BYCIRCE-ICE
EXPERIMENTAL TESTS... 25
2.1
Background and references ... 27
2.2
Body of the report concerning the ongoing activities ... 28
2.2.1 CIRCE-ICE facility ... 28 2.2.2 Experimental test ... 29 2.2.3 Thermal-hydraulic model ... 29 2.2.4 Simulation results ... 31
2.3
Conclusive remarks ... 32
2.4
List of References ... 45
3
A
PPLICATION OFRELAP5-3D
ONPHENIX
EXPERIMENTAL TESTS... 47
3.1
Background and references ... 49
3.2
Body of the report concerning the ongoing activities ... 49
3.2.1 Phénix reactor ... 49 3.2.2 Dissymmetric test ... 50 3.2.3 Phénix model ... 51 3.2.4 Results ... 53
3.3
Conclusive remarks ... 54
3.4
List of References ... 67
4
D
EVELOPMENT AND VALIDATION OF CODES FOR THE COUPLING OF THETitle: Development of BE numerical tools for LFR design and safety analysis (2018)
Project: ADP ENEA-MSE PAR 2017
Distribution PUBLIC Issue Date 29.01.2019 Pag. RICERCA SISTEMA ELETTRICO Ref. ADPFISS-LP2-167 Rev. 0
6 di 163
OF
4
THG
ENERATIONL
EAD-C
OOLEDF
ASTR
EACTORS.
V
ALIDATION OF THECOUPLING WITH DATA EXPERIMENTS FROM THE
TALL-3D
FACILITY. ... 69
4.1
Background and reference ... 71
4.2
Developed boundary conditions in OpenFOAM ... 72
4.2.1 Heat exchange with surrounding environment ... 72
4.2.2 Heat exchange with immersed steel disk. ... 72
4.2.3 Results obtained with new boundary conditions ... 73
4.3
Model of the TALL-3D test section with simple heat dispersion effects ... 74
4.3.1 Geometry and physical properties of the basic new model ... 74
4.3.2 Boundary conditions ... 75
4.3.3 Initial conditions of the coupled simulation ... 76
4.3.4 CATHARE stand alone and previous model simulations ... 76
4.3.5 Cathare-OpenFOAM coupling with heat dispersion in the TALL-3D test section. ... 77
4.4
Role of the activity, general goals and future development. ... 77
4.5
List of References ... 96
5
T
HREE-
DIMENSIONAL NEUTRONIC-
THERMAL-
HYDRAULIC DYNAMICS MODELLING:
SERPENT-OPENFOAM-FRENETIC
COMPARISON AND APPLICATION TOALFRED
DESIGN... 99
5.1
Introduction ... 101
5.2
ALFRED steady-state critical configuration in FRENETIC ... 101
5.3
ALFRED time-dependent neutronic simulation: safety rod insertion ... 102
5.4
ALFRED time-dependent coupled NE-TH simulations: LOFA... 102
5.5
ALFRED time-dependent coupled NE-TH simulations: reactivity insertion ... 102
5.6
Conclusive remarks ... 103
List of References ... 109
6
MONTE
CARLO
–
CFD
COUPLING FORLFR
MULTIPHYSICS MODELLING.. 111
6.1
Background and references ... 113
6.1.1 Monte Carlo - CFD coupling ... 113
6.2
Body of the report concerning the ongoing activities ... 114
6.2.1 Monte Carlo – CFD coupling techniques ... 114
6.2.2 Full core SERPENT model of the ALFRED reactor ... 117
6.2.3 CFD model for the FA of ALFRED ... 117
6.2.4 SERPENT – OpenFOAM coupling for one-sixth of FA ... 119
6.3
Role of the activity, general goals and future development ... 119
6.4
Activity PAR 2018 – Porous media approach for the LFR design and safety analysis ... 120
6.5
List of References ... 129
7
SIMMER
III-RELAP5
COUPLING
CODES
DEVELOPMENT ... 131
7.3
Qualitative results ... 133
7.4
List of References ... 138
8
F
UEL-
COOLANT CHEMICAL INTERACTION... 139
8.1
Progress of the computational and experimental activities ... 141
9
CFD
ANALYSIS
OF
FLOW
BLOCKAGE
IN
THE
ALFRED
FA ... 143
9.1
Abstract ... 145
9.2
Introduction ... 145
9.3
Models and Methods ... 147
9.4
Numerical methods ... 147
9.5
Alfred Fa CFD Model And Test Matrix ... 148
9.6
Results and Discussion... 149
9.7
Conclusions ... 150
9.8
List of References ... 161
Title: Development of BE numerical tools for LFR design and safety analysis (2018)
Project: ADP ENEA-MSE PAR 2017
Distribution PUBLIC Issue Date 29.01.2019 Pag. RICERCA SISTEMA ELETTRICO Ref. ADPFISS-LP2-167 Rev. 0
8 di 163
(Page intentionally left blank)L
IST OF FIGURES
Fig. 2.1 – CIRCE isometric view ... 34
Fig. 2.2 – ICE test section ... 34
Fig. 2.3 – ICE test section: primary flow path ... 35
Fig. 2.4 – FPS cross section ... 36
Fig. 2.5 – HX bayonet tube ... 36
Fig. 2.6 – CIRCE instrumentation: FPS (1) ... 37
Fig. 2.7 – CIRCE instrumentation: FPS (2) ... 38
Fig. 2.8 – CIRCE instrumentation: pool ... 39
Fig. 2.9 – Nodalizzation scheme: mono-dimensional model ... 40
Fig. 2.10 – Nodalizzation scheme: multi-dimensional model ... 41
Fig. 2.11 – Nodalizzation scheme: FPS ... 41
Fig. 2.12 – LBE mass flow rate ... 42
Fig. 2.13 – FPS inlet/outlet temperature ... 42
Fig. 2.14 – HX inlet/outlet temperature ... 42
Fig. 2.15 – DHR inlet/outlet temperature ... 42
Fig. 2.16 – TS and MC: 25000 s... 43
Fig. 2.17 – TS and MC: 80000 s... 43
Fig. 2.18 – TS and MC: 200000 s... 44
Fig. 3.1 – Reactor block ... 55
Fig. 3.2 – Intermediate heat exchanger ... 56
Fig. 3.3 – Reactor top view ... 56
Fig. 3.4 – Primary pump ... 57
Fig. 3.5 – Vessel cooling system flow path ... 57
Fig. 3.6 – Reactor core top view ... 58
Fig. 3.7 – Fuel and fertile SA axial composition ... 58
Fig. 3.8 – Overview of radial and azimuthal meshes of MULTID component ... 59
Fig. 3.9 – Scheme of MULTID component for porosity factor ... 59
Fig. 3.10 – SAs inlet area (m2) ... 60
Fig. 3.11 – SAs inlet K loss ... 60
Fig. 3.12 – Pumps, IHXs and VCS nodalization scheme ... 61
Fig. 3.13 – Comparison of the model and design relevant height ... 61
Title: Development of BE numerical tools for LFR design and safety analysis (2018)
Project: ADP ENEA-MSE PAR 2017
Distribution PUBLIC Issue Date 29.01.2019 Pag. RICERCA SISTEMA ELETTRICO Ref. ADPFISS-LP2-167 Rev. 0
10 di 163
Fig. 3.15 – Power removed by IHXs ... 62
Fig. 3.16 – Power % removed by IHXs ... 63
Fig. 3.17 – IHXs outlet coolant temperature ... 63
Fig. 3.18 – Transient conditions ... 64
Fig. 3.19 – Primary pumps inlet temperatures ... 64
Fig. 3.20 – Primary pumps mass flow rate ... 65
Fig. 3.21 – Core temperature ... 65
Fig. 3.22 – IHXS inlet temperatures ... 66
Fig. 4.1 - TALL-3D facility (left) with geometric dimensions (right). ... 83
Fig. 4.2 - Experimental data for test series TG03S301(03) [4.9]. ... 83
Fig. 4.3 - STH modeling for TALL-3D. Left, central and right vertical leg (from left to right) in 1D system model with 3D test section [4.9]. ... 84
Fig. 4.4 - STH modeling for TALL-3D. One-dimensional CATHARE model (left) and point of interests S1-S2 of the left leg (right), S3-S4 of the central leg and S5-S6 of the right vertical leg. For details see [4.9]. ... 84
Fig. 4.5 - Modelling for TALL-3D. Geometry and dimensions. ... 85
Fig. 4.6 - Simulated geometry for the study with heat exchange between the TALL-3D main section and the surrounding environment between fluid and steel disk (a) together with a close up view of the test section (b). ... 85
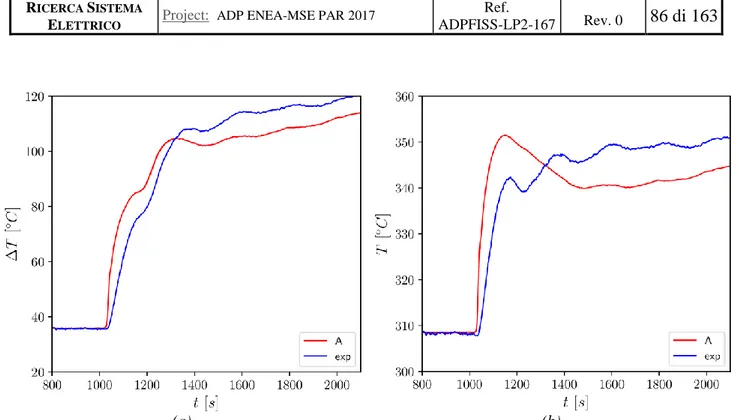
Fig. 4.7 - Comparison between case A and experimental values of temperature difference between outlet and inlet section (a) and outlet temperature values (b). ... 86
Fig. 4.8 - Comparison between case A, case B and experimental values of temperature difference between outlet and inlet section (a) and outlet temperature values (b). ... 86
Fig. 4.9 - Comparison between case A, B, C and experimental values of temperature difference between outlet and inlet section (a) and outlet temperature values (b). ... 87
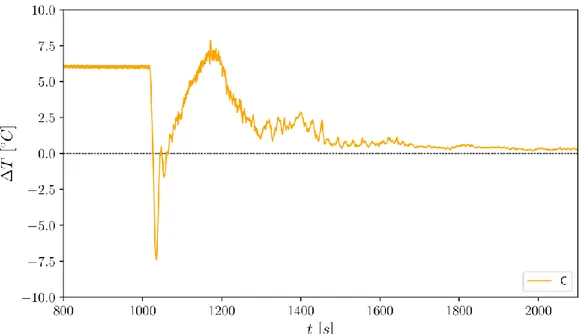
Fig. 4.10 - Different profile between outlet and steel disk temperature values for case C. ... 87
Fig. 4.11 - Comparison between case A, B, C, D and experimental values of temperature profiles between outlet and inlet section (a) and outlet temperature values (b). ... 88
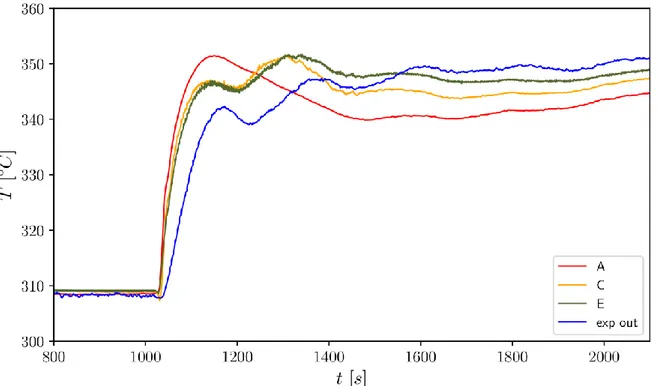
Fig. 4.12 - Comparison of outlet temperature values between cases A, C, E and experimental data. ... 88
Fig. 4.13 - Geometry: HA=axis (AX), NMLI=disk (DSK), EO=uprightwall (URW), DO=downrightwall (DRW), FE=top (TOP), CD=bottom (BOT), AB=inlet (IN), HG=outlet (OUT), CB=downleftwall (CB), GF=upleftwall (GF)... 89
Fig. 4.14 - Initial steady state and turbulent variables for CFD OpenFOAM code with the turbulent flow model κ-ω. ... 91
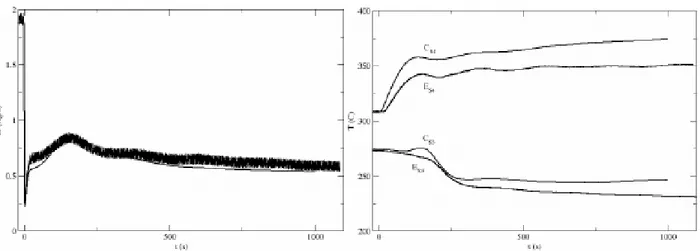
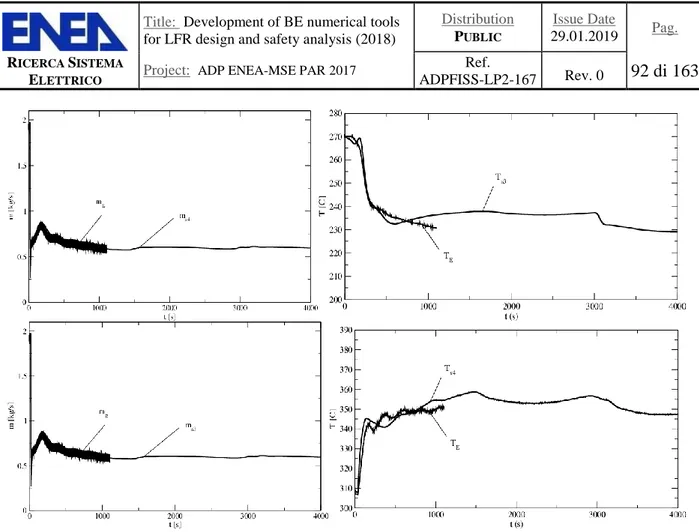
Fig. 4.15 - Cathare standalone simulation. Computed mass flow rate m (left) and temperature (right) at the points S3-S4 of the central leg as a function of time t, from [4.9]. ... 91 Fig. 4.16 - Mass flow rate (right) and temperature (left) at reference point S4 (top) and S3 (below) of
Fig. 4.17 - Mass flow rate (right) and temperature (left) at reference point S4 (top) and S3 (below) of the central leg for experimental data (E) and coupling Cathare-OpenFOAM with heat
dispersion on the TALL-3D test section. ... 92
Fig. 4.18 - Velocity module U and streamline profiles over the 3D test component at time t = 0, 4, 20, 80, 180, 580, 1780 and 2780s by using two-equation κ-ω turbulence model in OpenFOAM. ... 93
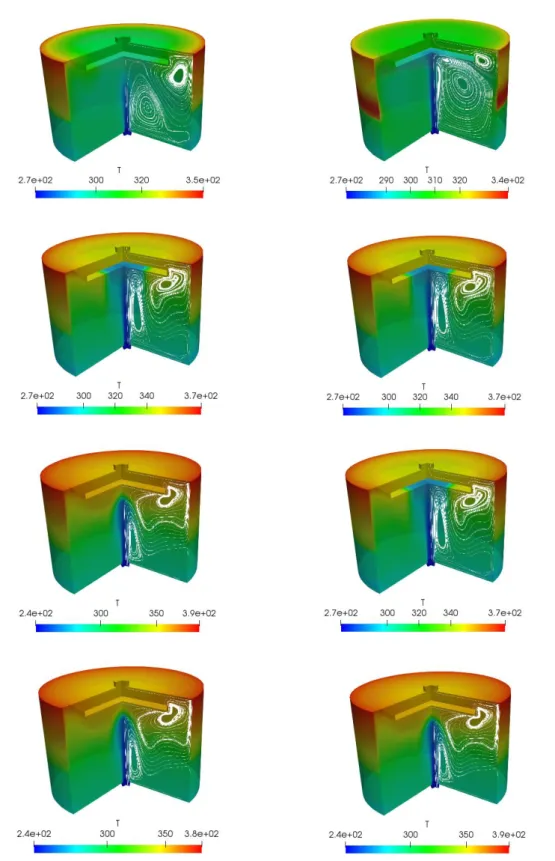
Fig. 4.19 - Temperature T and streamline profiles over the 3D test component at time t = 0, 4, 20, 80, 180, 580, 1780 and 2780s by using two-equation κ-ω turbulence model in OpenFOAM. ... 94
Fig. 4.20 - Turbulent viscosity νt and streamline profiles over the 3D test component at time t = 0, 4, 20, 80, 180, 580, 1780 and 2780s by using two-equation κ-ω turbulence model in OpenFOAM. ... 95
Fig. 5.1 – Neutron flux spectra computed by Serpent for selected regions of the core. Black dashed lines identify the 5-group energy subdivision originally adopted, while the blue dashed line identifies the additional group added to better account for the reflector spectrum. ... 103
Fig. 5.2 – Radial scheme of the FRENETIC model of the ALFRED core. ... 104
Fig. 5.3 Radial (left) and axial (right) view of the ALFRED configuration simulated in Serpent. ... 104
Fig. 5.4: core configuration with rod position adjusted to reach a condition closer to criticality. ... 105
Fig. 5.5: ALFRED core configuration as in the benchmark calculations against Serpent/OpenFoam [5.1]. ... 105
Fig. 5.6: Core power distribution with rods insertion adjusted to reach a condition closer to criticality (left) and relative difference with respect to the previous case. ... 106
Fig. 5.7: Identification of the position of the safety rod inserted in the pure NE transient. ... 106
Fig. 5.8: Thermal power and reactivity evolution in the safety rod insertion NE transient. ... 106
Fig. 5.9: Safety rod insertion transient: radial power map (in MW per FA) at t=0s (left) and t=7s (right). Different scales are adopted to highlight the differences and the spatial distortion around the safety rod location. ... 107
Fig. 5.10: Mass flow rate reduction adopted in the LOFA simulation. ... 107
Fig. 5.11: Reactivity and thermal power evolution during the LOFA. ... 107
Fig. 5.12: Evolution of the maximum temperature for both the coolant and the fuel in the central fuel assembly during the LOFA... 108
Fig. 5.13: Radial power map (in MW per FA) at t=0s (left) and t=1s (right) during the control rod extraction transient. ... 108
Fig. 6.1 – Unstable behavior of Monte Carlo – CFD coupling (EPR case). Evolution of a) volumetric power, b) fuel temperature in the first 4 iterations. ... 123
Fig. 6.2 – The fixed-point coupling algorithm. ... 124
Fig. 6.3 – The stochastic approximation coupling algorithm ... 125
Fig. 6.4 – Radial view (a) and longitudinal view (b) of the SERPENT model of the ALFRED reactor. ... 125
Fig. 6.5 – Power peaking factor of one-fourth of ALFRED reactor core for BOC. ... 126
Fig. 6.6 – a) Geometry and b) mesh of ALFRED one-sixth of FA... 126
Fig. 6.7 – Relative power variation at each iteration for the fixed-point scheme. ... 127
Title: Development of BE numerical tools for LFR design and safety analysis (2018)
Project: ADP ENEA-MSE PAR 2017
Distribution PUBLIC Issue Date 29.01.2019 Pag. RICERCA SISTEMA ELETTRICO Ref. ADPFISS-LP2-167 Rev. 0
12 di 163
Fig. 6.9 – Velocity profile calculated with the Monte Carlo – CFD coupling scheme. ... 128
Fig. 7.1 – Injection transient, qualitative results. Time = 0 to 1 secs (TOP), time = 1.03 (MIDDLE), time = 1.05 (BOTTOM) ... 135
Fig. 7.2 – Time evolution of liquid fraction at first cell ... 136
Fig. 7.3 – Time evolution of global pressure in the vessel ... 136
Fig. 7.4 – Time evolution of global temperature (mass averaged) inside the vessel ... 137
Fig. 7.5 – Time evolution of hydrogen mass inside the vessel ... 137
Fig. 9.1 Sketch of the ALFRED Fuel Assembly: top view. ... 153
Fig. 9.2 Sketch of the ALFRED Fuel Assembly: lateral view. ... 154
Fig. 9.3 Sketch of the 3D CFD model adopted. ... 154
Fig. 9.4 Computational mesh in the fuel pin bundle active region. ... 155
Fig. 9.5 Velocity and temperature distribution in a cross-section placed 200 mm downstream the beginning of the active region for the unperturbed case 0. ... 155
Fig. 9.6 Clad temperature distribution for the unperturbed case 0. ... 155
Fig. 9.7 Cross-section averaged pressure distribution along the streamwise direction for case 0. ... 156
Fig. 9.8 Vortex behind the sector blockage for case 1. ... 156
Fig. 9.9 Streamwise velocity contours in a cross section at the beginning of the active region for case1. ... 156
Fig. 9.10 Temperature distribution in the clad for case 1. ... 157
Fig. 9.11 Streamwise velocity contours at the beginning of the active region (z=0) for case2. ... 157
Fig. 9.12 Pin temperature distribution for case2, double sector blockage at the lower spacer grid. ... 158
Fig. 9.13 Pin temperature distribution for case 3, corner blockage at the lower spacer grid. ... 158
Fig. 9.14 Maximum pin temperature in the active region for the 3 test cases with blockage in the lower grid. ... 158
Fig. 9.15 Pin temperature distribution for case 5, single sector blockage at the middle spacer grid. ... 159
Fig. 9.16 Streamwise velocity contours in the blockage region for case9 (double sector upper blockage). . 159
Fig. 9.17 Pin temperature distribution for case 9, double sector blockage at the upper spacer grid. ... 159
Fig. 9.18 Maximum pin temperature in the active region for case 8(upper double sector) and case0(unblocked). ... 160
L
IST OF TABLES
Tab. 2.1 – CIRCE S100 main parameters ... 33
Tab. 2.2 – TEST IV boundary conditions ... 33
Tab. 2.3 – CIRCE-ICE nodalization scheme: main parameters ... 33
Tab. 3.1 – Dissymmetrical test: sequence of events ... 55
Tab. 3.2 – Seady state conditions ... 55
Tab. 4.1 – Physical properties used in the modeling of the TALL-3D facility. ... 79
Tab. 4.2 - OpenFOAM boundary field U, φ and p for the Navier-Stokes equation. ... 79
Tab. 4.3 - OpenFOAM boundary properties values for the Navier-Stokes equation. ... 80
Tab. 4.4 - OpenFOAM boundary field for temperature T of the heat equation. ... 80
Tab. 4.5 - OpenFOAM boundary field for properties of the heat equation. ... 81
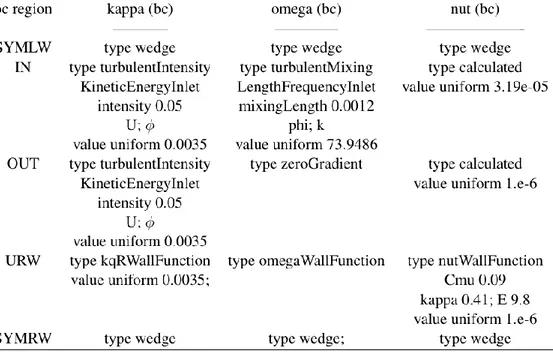
Tab. 4.6 - OpenFOAM boundary field for temperature turbulent variables (k,ω) and turbulent property νt of the k-ω two equation model (I). ... 81
Tab. 4.7 - OpenFOAM boundary field for temperature turbulent variables (k, ω) and turbulent property νt of the k-ω two equation model (II). ... 81
Tab. 4.8 - Initial condition for OpenFOAM volume field before coupling. ... 82
Tab. 4.9 - Initial state condition for the one-dimensional Problem C (Cathare). The STH code initial condition satisfies the steady state equation. ... 82
Tab. 6.1 – Comparison of some core parameters. ... 121
Tab. 6.2 – Comparison of the reactivity coefficients, BoC. ... 121
Tab. 6.3 – Default parameters applied in the OpenFOAM solver for k-ε turbulence model. ... 121
Tab. 6.4 – Correlations for density and thermal conductivity of coolant and fuel. ... 121
Tab. 7.1 – Initial and boundary conditions for the SIMMER/RELAP5 simulation of LIFUS5. ... 134
Tab. 9.1 Physical properties of Lead at 450 °C. ... 152
Tab. 9.2 Physical properties of SS 15-15 Ti (Clad material) at 450 °C. ... 152
Tab. 9.3 Basic Geometrical and Thermal-hydraulic parameters of the DEMO ALFRED Core... 152
Title: Development of BE numerical tools for LFR design and safety analysis (2018)
Project: ADP ENEA-MSE PAR 2017
Distribution PUBLIC Issue Date 29.01.2019 Pag. RICERCA SISTEMA ELETTRICO Ref. ADPFISS-LP2-167 Rev. 0
14 di 163
(Page intentionally left blank)L
IST OF ABBREVIATIONS
AdP Accordo di Programma
ALFRED Advanced Lead Fast Reactor European Demonstrator
ATHENA Advanced Thermal Hydraulic Experiment for Nuclear Application BE Best Estimate
BEPU Best Estimate Plus Uncertainty BoP Balance of Plant
BoT Beginning of Transient
CEA Commissariat a l'Energie Atomique et aux Energies Alternatives CFD Computational Fluid Dynamics
CIRCE Circolazione Eutettico
CIRTEN Interuniversity Consortium for Technological Nuclear Research CHEOPEIII Chemistry Operation III Facility
cp Specific heat
CR Control Rod d Pin diameter
DBA Design Base Accident
Deq Subchannel equivalent diameter
DHR Decay Heat Removal DHRS Decay Heat Removal System DOC Design-Oriented Code DSA Deterministic Safety Analysis
ENEA Italian National Agency for New Technologies, Energy and Sustainable Economic Development ESFRI European Strategy Forum on Research Infrastructures
EoT End of Transient FA Fuel Assembly
FALCON Fostering ALFRED Construction FPC Fuel Performace Code
FPS Fuel Pin Simulator FR Fast Reactor GEN-IV Generation IV GIF Generation IV forum GIORDI Grid to Rod fretting facility HBS High Burnup Structure
HELENA Heavy Liquid Metal Experimental Loop for Advanced Nuclear Applications HLM Heavy Liquid Metal
HX or HEX Heat Exchanger
I&C Instrumentation and Control k Thermal conductivity L Active Length
LBE Lead Bismuth Eutectic LECOR Lead Corrosion Loop
LEADER Lead-cooled Advanced Demonstration Reactor LIFUS5 Lead-Lithium for Fusion Facility (5)
LFR Lead Fast Reactor LM Liquid Metal LMR Liquid Metal Reactor LWR Light Water Reactor
𝑚̇ Mass flow rate
Title: Development of BE numerical tools for LFR design and safety analysis (2018)
Project: ADP ENEA-MSE PAR 2017
Distribution PUBLIC Issue Date 29.01.2019 Pag. RICERCA SISTEMA ELETTRICO Ref. ADPFISS-LP2-167 Rev. 0
16 di 163
MA Minor ActinideMABB Minor Actinides Bearing Blankets MOX (U-Pu) Mixed Oxide
NACIE Natural Circulation Experiment Loop NPPs Nuclear Power Plants
O&M Operation and Maintenance PAR Piani Annuali di Realizzazione
PID Proportional-Integral-Derivative controllers PLD Pulsed Laser Deposition
POLIMI Politecnico di Milano POLITO Politecnico di Torino PP Primary Pump Pr Prandtl number
PSA Probabilistic Safety Analysis
RACHELE Reactions and Advanced chemistry for Lead
Q Thermal power
qwall Wall heat flux
RANS Reynolds Averaged Navier-Stokes RMS Root Mean Square
RSE Ricerca Sistema Elettrico RV Reactor Vessel
RVACS Reactor Vessel Air-Cooling System SA Safety Analysis
SET-PLAN Strategic Energy Technology Plan SG Steam Generator
SGTR Steam Generator Tube Rupture SISO Single Input Single Output
SYS System
SYS-TH System- ThermalHydraulics SS Stainless Steel
TH Thermal-Hydraulics Tinlet Inlet temperature
TKE Turbulent Kinetic Energy Tmax Maximum temperature
Toutlet Outlet temperature
TRL Technological Readiness Level TSO Technical Safety Organization ULOF Unprotected Loss of Flow UNIBO Università di Bologna UNIPI Università di Pisa
UNIROMA1 Università di Roma - Sapienza VOC Verification-Oriented Code V&V Verification & Validation
y+ Dimensionless distance from the wall
Thermal expansion coefficient β Blockage area factor
Density
F
OREWORD
The Lead-cooled Fast Reactor (LFR) technology brings about the possibility of fully complying with all the Generation IV requirements. This capability being more and more acknowledged in international fora, the LFR is gathering a continuously increasing interest, with new industrial actors committing on LFR-related initiatives. In this context, the Italian nuclear community evaluates strategic to continue elevating the competences and capabilities, with the perspective of extending the support to the design and safety analysis of future LFR systems. The most appropriate framework for this advancement is the Accordo di Programma (AdP), within which ENEA and CIRTEN (the consortium gathering all Italian universities engaged in nuclear education, training and research) are already cooperating on the LFR technology since 2006, along with national industry as main stakeholder. Within the AdP, the LFR system chosen as reference for all studies and investigations is ALFRED, the Advanced Lead-cooled Fast Reactor European Demonstrator. As a demonstration reactor, indeed, it was reckoned as the system best fitting with the research and development (R&D) nature of the activities performed in the AdP, being demonstration the step that logically follows R&D in the advancement of the LFR technology by readiness levels. Moreover, ALFRED is envisaged as the key facility of a distributed research infrastructure of pan-European interest, open to scientists and technologists for relevant experiments to be performed on a fully LFR-representative and integral environment, with the long-term perspective of supporting to the safe and sustainable operation of future LFRs, thereby fulfilling the general objectives of the AdP itself.
In the wide spectrum of possible activities to support the further development of the LFR technology, and exploiting the specific expertise acquired by the universities in the past years, within the scope of the 2016 Piano Annuale di Realizzazione (PAR) it was decided to focus the cooperative efforts shared between ENEA and CIRTEN towards the development of an best estimate computational tools supporting the various
stages of design and safety analyses of LFR systems, so to increase – or help in viewing how to fill the
Title: Development of BE numerical tools for LFR design and safety analysis (2018)
Project: ADP ENEA-MSE PAR 2017
Distribution PUBLIC Issue Date 29.01.2019 Pag. RICERCA SISTEMA ELETTRICO Ref. ADPFISS-LP2-167 Rev. 0
18 di 163
(Page intentionally left blank)1 T
HERMO-M
ECHANICS OF THE FUEL PIN–
DEVELOPMENT AND ASSESSMENT OF MODELS AND ALGORITHMS DESCRIBING INERT GAS BEHAVIOR FOR USE INTRANSURANUS
Title: Development of BE numerical tools for LFR design and safety analysis (2018)
Project: ADP ENEA-MSE PAR 2017
Distribution PUBLIC Issue Date 29.01.2019 Pag. RICERCA SISTEMA ELETTRICO Ref. ADPFISS-LP2-167 Rev. 0
20 di 163
(Page intentionally left blank)1.1 Progress from the results presented in the previous PARs
This document summarizes the activities performed by POLIMI in continuation of those included in the PAR2017 (and previous PARs). The objective of POLIMI’s activities for PAR2016 [1.1] and PAR2017 [1.2] was twofold: (1) we derived new correlations for key properties of the helium//oxide fuel system, i.e., helium diffusivity [1.3] and helium solubility [1.4], and (2) we developed new algorithms for the treatment of mathematical models describing inert gas behaviour, tailored for use in fuel performance codes such as TRANSURANUS [1.5],[1.6].
As briefly reported hereafter, these parameters are of critical importance for the ongoing development of a physics-based model describing helium behaviour in MOX fuel. Helium behaviour is fundamental in MOX fuel, both in-reactor as well as during storage. Due to the enrichment in plutonium, higher concentrations of minor actinides are produced during irradiation compared to UO2. Most of these isotopes undergo α-decay, which are effectively helium nuclei created in the fuel matrix1.
To describe the intra-granular behaviour of helium in MOX fuel, we propose a physics-based model that extends the one proposed by Talip et al. [1.7]. Namely:
where cHe (at m -3
) and mHe (at m -3
) are the concentration of helium dissolved in the fuel matrix and trapped in intra-granular bubbles, respectively. DHe (m
2
s-1) is the diffusion coefficient, β (s-1) is the trapping rate [1.8], α (s-1
) is the re-solution rate [1.9],[1.10], and SHe (at m -3
s-1) is the production rate of helium. cS,He (at m
-3 ) is the solubility limit of helium in the fuel matrix. t (s) and r (m) are respectively time and the radial coordinate within the fuel grain, assumed as spherical [1.11]. Eq. 1,2 are to be solved imposing a Dirichlet boundary condition at the grain radius.
Eqs. 1,2 physically describe the behaviour of intra-granular helium. The helium atoms are produced in the fuel matrix. The excess of atoms with respect to the solubility is progressively trapped into intra-granular bubbles. The trapping process is counteracted by the re-solution of atoms from the intra-granular bubbles caused by the interaction of the fission fragments. The proposed model is thus physics-based and describes helium behaviour at the scale of fuel grains, therefore being in line with the development guidelines detailed in Section 1.
The effective application of Eqs. 1,2 requires the definition of the model parameters specific to helium, i.e., the production rate SHe, the diffusion coefficient DHe, and the solubility limit cS,He. A new suitable correlation
for the diffusion coefficient has been derived as part of the activities of PAR2016 [1.1],[1.3], while a new correlation for the solubility limit is the one of the outcomes of PAR2017 [1.2],[1.4].
The effective use of the above described model (Eqs. 1,2) in fuel performance codes requires special numerical treatment. This requirement arises from the difference in scales between this helium behaviour
1
Secondary mechanisms of helium formation are from ternary fissions (yield around 0.2%) and (n,α)-reactions on 16O for high-energy neutrons.
𝜕 𝜕𝑡𝑐He= DHe 1 𝑟2 𝜕 𝜕𝑟𝑟2 𝜕 𝜕𝑟𝑐He− β(𝑐He− 𝑐𝑆,He) + α𝑚He+ SHe (1.1) 𝜕 𝜕𝑡𝑚He= β(𝑐He− 𝑐𝑆,He) − α𝑚He (1.2)
Title: Development of BE numerical tools for LFR design and safety analysis (2018)
Project: ADP ENEA-MSE PAR 2017
Distribution PUBLIC Issue Date 29.01.2019 Pag. RICERCA SISTEMA ELETTRICO Ref. ADPFISS-LP2-167 Rev. 0
22 di 163
model (fuel grain scale, i.e., few micrometres) and the typical domain of a fuel performance code such as TRANSURANUS (fuel pin scale, i.e., from centimetres to metres). For this reason, as part of the previous PARs, we developed dedicated numerical algorithms [1.5],[1.6].
The next step in the development of this model is going to be its implementation in SCIANTIX [12] and its validation against separate effect data of annealed fuel samples [1.8],[1.13].
1.2 List of References
[1.1] L. Luzzi, D. Pizzocri, T. Barani, L. Cognini, Development/assessment of models describing the inert gas behavior in the fuel for application to the TRANSURANUS fuel pin thermo-mechanical code, PAR2016: LP2.A.3_a. (2017).
[1.2] L. Luzzi, D. Pizzocri, T. Barani, L. Cognini, A. Magni, Thermo-mechanics of the fuel pin – Development and assessment of models and algorithms describing inert gas behavior for use in TRANSURANUS, PAR2017: LP2.a.3.1. (2018).
[1.3] L. Luzzi, L. Cognini, D. Pizzocri, T. Barani, G. Pastore, A. Schubert, T. Wiss, P. Van Uffelen, Helium diffusivity in oxide nuclear fuel: Critical data analysis and new correlations, Nucl. Eng. Des. 330 (2018) 265–271.
[1.4] L. Cognini, D. Pizzocri, T. Barani, P. Van Uffelen, A. Schubert, T. Wiss, L. Luzzi, Helium solubility in oxide nuclear fuel:Derivation of new correlations for Henry’s constant, Nucl. Eng. Des. 340 (2018) 240–244. doi:10.1016/j.nucengdes.2018.09.024.
[1.5] D. Pizzocri, C. Rabiti, L. Luzzi, T. Barani, P. Van Uffelen, G. Pastore, PolyPole-1: An accurate numerical algorithm for intra-granular fission gas release, J. Nucl. Mater. 478 (2016) 333–342. [1.6] G. Pastore, D. Pizzocri, C. Rabiti, T. Barani, P. Van Uffelen, L. Luzzi, An effective numerical
algorithm for intra-granular fission gas release during non-equilibrium trapping and resolution, J. Nucl. Mater. 509 (2018) 687–699.
[1.7] Z. Talip, T. Wiss, V. Di Marcello, A. Janssen, J.Y. Colle, P. Van Uffelen, P. Raison, R.J.M. Konings, Thermal diffusion of helium in 238Pu-doped UO2, J. Nucl. Mater. 445 (2014) 117–127. doi:10.1016/j.jnucmat.2013.10.066.
[1.8] F.S. Ham, Theory of diffusion-limited precipitation, J. Phys. Chem. Solids. 6 (1958) 335–351. [1.9] P. Lösönen, On the behaviour of intragranular fission gas in UO2 fuel, J. Nucl. Mater. 280 (2000)
56–72. doi:10.1016/S0022-3115(00)00028-3.
[1.10] D.R. Olander, D. Wongsawaeng, Re-solution of fission gas - A review: Part I. Intragranular bubbles, J. Nucl. Mater. 354 (2006) 94–109. doi:10.1016/j.jnucmat.2006.03.010.
[1.11] A.H. Booth, A method of calculating fission gas diffusion from UO2 fuel and its application to the X-2-f loop test, At. Energy Canada Ltd. Chalk River Proj. Res. Dev. Rep. AECL-496. (1957) 1–23. [1.12] D. Pizzocri, T. Barani, L. Luzzi, SCIANTIX, Https://gitlab.com/poliminrg/sciantix. (2018).
[1.13] Z. Talip, T. Wiss, E.A. Maugeri, J.Y. Colle, P.E. Raison, E. Gilabert, M. Ernstberger, D. Staicu, R.J.M. Konings, Helium behaviour in stoichiometric and hyper-stoichiometric UO2, J. Eur. Ceram. Soc. 34 (2014) 1265–1277. doi:10.1016/j.jeurceramsoc.2013.11.032.
Title: Development of BE numerical tools for LFR design and safety analysis (2018)
Project: ADP ENEA-MSE PAR 2017
Distribution PUBLIC Issue Date 29.01.2019 Pag. RICERCA SISTEMA ELETTRICO Ref. ADPFISS-LP2-167 Rev. 0
24 di 163
(Page intentionally left blank)2 V
ALIDATION OFRELAP53D
BYCIRCE-ICE
EXPERIMENTAL TESTSV. Narcisi, F. Giannetti, G. Caruso
Title: Development of BE numerical tools for LFR design and safety analysis (2018)
Project: ADP ENEA-MSE PAR 2017
Distribution PUBLIC Issue Date 29.01.2019 Pag. RICERCA SISTEMA ELETTRICO Ref. ADPFISS-LP2-167 Rev. 0
26 di 163
(Page intentionally left blank)2.1 Background and references
The Lead-cooled Fast Reactor (LFR) belongs to the six concepts selected by the Generation IV International Forum (GIF) as Generation IV systems (GEN-IV). GEN-IV reactors are developing in order to help meet the word’s future energy needs and to minimize the long-term stewardship burden. The goals of the innovative Nuclear Power Plants (NPP) are summarized in four main topics: sustainability, economics, safety & reliability and proliferation resistance & physical protection.
The LFR concept includes the lead and lead-bismuth eutectic alloy (LBE) technologies. both coolants are chemically inert and they offer other attractive characteristics in terms of interaction with structural materials and thermodynamic features. LFR systems also well respond to lesson of Fukushima accident allowing natural circulation both in nominal and accident conditions. This feature offers considerable grace time in order to cope with unprotected loss of flow transient and permits to introduce fully passive decay heat removal system (DHR), assuring very high safety features over long periods without need for operator actions, combined with active systems.
Several R&D programs has been promoted in the UE, focused on the development of the LFR systems. In this framework, the validation of the best estimate computer codes is a crucial aspect. The most computational codes are improved to include the capability to simulates the main phenomena occurring in the GEN-IV system reactors. In order to use these analytical tools for the NPP safety assessment, each improvement must be validated against several experimental data which cover every operational scenario of the nuclear system, including accidental sequences. The validation approach is not possible against experimental tests performed on NPP; however, the accidental scenario can be replaced with dedicated facility and the experimental data can be compared with the analytical results.
In this framework, from 2010, “Sapienza” University of Rome (UNIROMA1), in collaboration with ENEA Brasimone Research Center, was involved in the development of innovative LFR technologies (Ref. [2.1], [2.2], [2.3], [2.4] and [2.5]), dealing with several operative aspects. In 2013, UNIROMA1 started to investigate the capability of RELAP5-3D© code (R5-3D) to reproduce the main thermal-hydraulic phenomena in a lead-cooled fast reactor. In Ref. [2.6], a comparison between RELAP5 mod.3.3 and RELAP5-3D highlighted that the correlation implemented in R5-3D for the evaluation of the heat transfer coefficient (HTC) in bundle geometry (the Westinghouse correlation, in Ref. [2.7]), underestimates the HTC in comparison with the actual state of art. In Ref. [2.8], a tool for the generation of new lead and LBE thermophysical properties (according to the NEA recommendation, in Ref. [2.9]) binary files was presented, showing a comparison between the state-of-art data and the RELAP5-3D default properties.
In 2010, in the framework of LEADER project, a new configuration of the steam generator (SG) was proposed for ALFRED (Advanced Lead Fast Reactor European Demonstrator): the super-heated steam double wall bayonet tube type with leakage monitoring. ENEA Brasimone Research Center designed and constructed the HERO (Heavy liquid mEtal pRessurized water cOoled tubes) test section to investigate the capability of a bundle of double wall bayonet tubes 1:1 in length with the ALFRED SG (Ref. [2.10]). In the framework of the H2020 SESAME project (http://sesame-h2020.eu/), a validation benchmark has been proposed, based on the experimental campaign conducted on CIRCE-HERO test facility (Ref. [2.11]). UNIROMA1 has been involved in this experimental campaign, performing the pre-test calculations (Ref. [2.12], [2.13], [2.14] and [2.15]) and carring out the experiment in collaboration with ENEA.
The CIRCE-HERO pre-test calculation has been performed using RELAP5-3D; the nodalization scheme has been developed starting from the thermal-hydraulic model of previous configuration of the facility, called CIRCE-ICE facility. ICE test section was installed into CIRCE facility in order to reproduce a typical primary system of a HLM cooled pool-type reactor; the experimental campaign aimed to investigate mixing
Title: Development of BE numerical tools for LFR design and safety analysis (2018)
Project: ADP ENEA-MSE PAR 2017
Distribution PUBLIC Issue Date 29.01.2019 Pag. RICERCA SISTEMA ELETTRICO Ref. ADPFISS-LP2-167 Rev. 0
28 di 163
validation of analytical codes. The simulation activities carried out by UNIROMA1 in the previous years, has been highlighted that the nodalization scheme has well reproduced the thermal-hydraulics of the primary flow path in full power conditions and the implementation in RELAP5-3D of the most recent LBE thermophysical properties correlations has allowed a better estimation of the HLM conditions. Concerning the thermal-hydraulic phenomena into the pool, the calculations has highlighted the prospect to reproduce the thermal stratification with RELAP5-3D, but some discrepancy has been noticed comparing the calculated results with the experimental data (Ref. [2.16], [2.17] and [2.18]).
This report follows the activity of the past year. The thermal-hydraulic model of CIRCE-ICE has been used for the simulation of an integral test aimed to reproduce a protected loss of heat sink (PLOHS) with loss of flow (LOF).
2.2 Body of the report concerning the ongoing activities
2.2.1 CIRCE-ICE facility
CIRCE is a multipurpose pool facility designed to host different test sections welded to and hung from bolted vessel heads for the investigation of thermal-hydraulic aspects related to the HLM pool system. The facility consists of a main vessel, earmarked for containing test section and filled with about 70 tons of molten LBE, two auxiliary tanks, dedicated to store LBE during maintenance phases and to transfer liquid metal during loading and drainage phases, and data acquisition system. The main vessel (S100) is characterized by the outer diameter of 1200 mm and the height of 8500 mm. The Fig. 2.1 depicts the isometric view of the facility and the main parameters are summarized in Tab. 2.1.
The experimental campaign is conducted on ICE test section, installed into the main vessel. ICE aims to simulate the primary system of a HLM pool type reactor and the main objectives of the experimental campaign were to investigate thermal stratification and mixing convection phenomena into the pool and to provide experimental data for the validation of analytical codes. These are two of the main topics for the development of LFR system: the thermal stratification could induce thermo-mechanical stress on the structure and the validation of TH (Thermal Hydraulics) codes against the experimental data is a fundamental step in order to justify their use in the design phase for improving safety aspects.
The principal components and the primary main flow path of the test section are depicted in Fig. 2.2 and Fig. 2.3; the inlet section consists of the feeding conduit, which allows the hydraulic connection between the lower plenum of the pool and the fuel pin simulator (FPS). The value of the LBE mass flow rate entering the FPS is measured by a Venturi-nozzle flow meter, installed into the feeding conduit. The fuel pin simulator represents the heat source of the unit. It consists of an electrical pin bundle with a nominal thermal power of 800 kW and an active length of 1000 mm. The bundle is composed of 37 electrically heated pins arranged in a wrapped hexagonal lattice and characterized by a pitch to diameter ratio equal to 1.8 (Fig. 2.4); the relative position between the pin bundle and the external wrapper is fixed by three spacer grids, located along the heat source, and the unit rests to the lower grid, placed at the inlet section of the FPS. Each pin has an outer diameter of 8.2 mm, a thermal power of 25 kW and a heat flux at the pin wall of 1 MW/m2. The hot fluid exits the core and it is introduced into the fitting volume, which allows the connection between the fuel pin simulator and the riser, double wall insulated pipe connecting the fitting volume and the separator. At the inlet section of the riser, a nozzle is installed allowing the injection of argon in order to promote the circulation of the primary coolant. The mixture flows upward and collects inside the separator, where the separation of LBE and Ar occurs (LBE enters the heat exchanger while Ar flows upward into the gas plenum through the free surface). The HX (heat exchanger) is made of 91 bayonet tubes, characterized by an active length of 3462 mm, contained into a cylindrical shell. The relative position between the tubes and the external shell is fixed by only one grid at the outlet section of the HX. Fig. 2.5 shows a sketch of the bayonet
then upward into the annular riser between inner and middle tube, where the change of phase take place; the double physical separation is obtained with the second and the third tube and the LBE flows downwards outside the tubes.
The volume between middle and outer tube is filled by pressurized helium to detect any leakage. Exiting the HX, primary coolant flows through the downcomer reaching the lower plenum. The DHR system is located in the upper zone of the pool, as shown in Fig. 2.2. It consists of only one bayonet tube and the decay power is removed by forced circulation of air. The tube is located inside a double wall shell with a thin air insulation gap to thermally decouple the DHR from the external LBE pool. Hot LBE enters the DHR by the upper inlet section, it flows downward decreasing the temperature and it exits the component in the downcomer (Ref. [2.19]).
The test section is equipped with several thermocouples to investigate the thermal behavior of the LBE. The primary coolant temperature inside the FPS is measured by 36 TCs (thermocouples), arranged at 7 different axial levels. Two series of penetration are obtained at the inlet and outlet section of the active zone, as shown in Fig. 2.6. In addition, along the HS active length, four different sections are monitored as depicted in Fig. 2.7, investigating the temperature of the LBE along three characteristic sub-channels and the pin clads. Several TCs are also installed inside the pool in order to investigate mixing convection and thermal stratification phenomena. 119 thermocouples are installed in 17 axial levels and 9 different azimuthal positions, as shown in Fig. 2.8.
2.2.2 Experimental test
The objective of the experimental campaign is to investigate the thermal stratification and the mixing convection phenomena inside the pool of the facility, in both enhanced and natural circulation conditions. The experimental test analyzed is called TEST 9; it aims to reproduce a protected loss of heat sink (PLOHS) plus a loss of flow (LOF) simulating the total loss of primary flow, the loss of the secondary circuit, the consequent scram of the reactor and the activation of the DHR system. To reproduce the accident in CIRCE-ICE facility, the thermal power supplied to the FPS is reduced to the 7% of the nominal power, following a typical decay heat curve for a HLM fast reactor, the argon injection is stopped, simulating the blackout of the primary pumping system, the secondary system is disabled and the DHR system is activated, injected air on the DHR secondary side. The boundary conditions of the TEST 9 are summarized in Tab. 2.2.
2.2.3 Thermal-hydraulic model
The nodalization scheme of CIRCE-ICE test facility has been developed using RELAP5-3D© ver. 4.3.4. RELAP5 is a light water reactor transient analysis code developed by the U.S. Nuclear Regulatory Commission (NRC) for use in rulemaking, licensing audit calculations, evaluation of operator guidelines and as a basis for a nuclear plant analyzer. It is a generic code that, in addition to calculating the behavior of a reactor coolant system during a transient, can be used for simulation of a wide variety of hydraulic and thermal transients in both nuclear and nuclear systems involving mixtures of steam, water, non-condensable and solute. R5-3D is the last version of the series of RELAP5 code and contains several improvements; two enhancements from the previous versions are the multi-dimensional thermal-hydraulic capability and the addition of new working fluids, including heavy liquid metals (Ref.[2.20]).
The geometrical model consists of two macro-regions, coupled to reproduce the whole test facility: a mono-dimensional model, that simulate the primary main flow path, the HX secondary system and the DHR system (see Fig. 2.9), and a multi-dimensional component, shown in Fig. 2.10, where the internal components are depicted only to display the positioning, to investigate phenomena such as mixing convection and thermal stratification inside the pool.
Title: Development of BE numerical tools for LFR design and safety analysis (2018)
Project: ADP ENEA-MSE PAR 2017
Distribution PUBLIC Issue Date 29.01.2019 Pag. RICERCA SISTEMA ELETTRICO Ref. ADPFISS-LP2-167 Rev. 0
30 di 163
linked with 1536 cross junction to reproduce the mass transfer between the sub-channels. The thermal power supplied by the electrical heated pins is simulated with 5760 heat structure active nodes and other 1728 thermal nodes reproduce the heat dissipation through the hexagonal shroud. In order to simulate the heat transfer between the sub-channels, 3456 heat transfer nodes are introduced, assuming a “fake” material with negligible heat capacity and with LBE thermal conductivity. The FPS nodalization scheme is obtained to compare the LBE temperature in the exact position of the thermo-couples. For the evaluation of the heat transfer coefficient (HTC) on heavy liquid metals, Todreas & Kazimi correlation (Ref. [2.7]) is implemented in R5-3D. 𝑁𝑢 = 4.0 + 0.33 (𝑝 𝑑) 3.8 (𝑃𝑒 100) 0.86 + 0.16 (𝑝 𝑑) 5
Previous calculations on HLM system showed that this correlation underestimates the Nusselt number for pitch-to-diameter ratio greater than 1.2 (Ref. [2.6]). Additionally, R5- 3D does not permit a pitch-to-diameter ratio of 1.8 and the p/d of the pin bundle was set to the maximum allowed value of 1.4. In order to improve the HTC according to Ushakov correlation (more accurate in this case)
𝑁𝑢 = 7.55𝑝 𝑑− 20 ( 𝑝 𝑑) −13 + 3.67 (90𝑝𝑑)2 𝑃𝑒(0.56+0.19𝑝𝑑)
and to correct the heat exchange to experimental p/d value, an artificial multiplicative factor of 1.31, evaluated as the ratio between the two correlations in nominal flow conditions, was applied to the HTC. For the non-bundle geometry, the Seban-Shimazaki correlation is used:
𝑁𝑢 = 5.0 + 0.025𝑃𝑒0.8
Upstream the FPS, the pressure drop of the Venturi nozzle was simulated by a concentrated pressure loss coefficient K, dependent on the flow conditions, according to the equation:
0.014 10.5Re
Venturi
K
The argon injection at the riser inlet section is simulated with boundary conditions: the time-dependent volume sets the gas inlet conditions and the time-dependent junction, connected with the bottom edge of the riser second control volume, adjusts the mass flow rate injection. The pressure of the gas plenum of the facility is regulated by an additional time-dependent volume, that simulates the gas extraction through the gas circuit. The HX primary side is simulated by a single equivalent pipe and one heat structure, which thermally couples the primary and the secondary side. A calibrated fouling factor of 1.02 is evaluated as the ratio between Ushakov and Todreas & Kazimi correlation and it is applied on the LBE side to increase the HTC. The bayonet tubes are modelled using two pipes in order to simulate the descending and ascending side of water/steam tubes and one heat structure to model heat dispersion between the two pipes.
The pressure losses due to grids installed into FPS and heat exchanger are calculated by the Rheme correlation (Ref. [2.21]): 2 2
0.5
grid vp
C
v
grid flow
A A
The Cv parameter is a modified drag coefficient and it is calculated as: 10 0.264 2.79 2 73.14 2.79 10 2.6 3.5 , Re Re v C MIN
The bayonet tube of the DHR system is simulated and it is composed of one pipe for the LBE channel and two pipes to model the descending and ascending air side.
The region number 2 is the 3D component which simulates the volume between the main vessel and the internals. The nodalization scheme is obtained to compare the LBE temperature in the exact position of the thermocouples into the pool, in order to investigate the capability of the code to reproduce thermal stratification and mixing convection phenomena. The model consists of 51 axial levels, 4 radial meshes and 8 azimuthal intervals. The mono-dimensional model and the 3D component is hydraulically coupled with 12 junctions and the heat dispersions through the internals and the main vessel were evaluated with several heat structures.
The dimensions of the whole model are summarized in Tab. 2.3.
2.2.4 Simulation results
The simulation has been carried out using the most accurate LBE thermo-physical properties correlations; recommended by NEA (Ref. [2.9]). The boundary conditions applied for the simulations are summarized in Tab. 2.2. The test starts in no-power steady state conditions, where the argon injection, the FW and the air mass flow rate and the FPS are disabled. At 25000 s the transition from enhanced to natural circulation occurs: the FPS thermal power decreases to the decay heat value, the Ar injection system and the FW mass flow rate are disabled and the DHR is fed by air flow rate. The simulated value of the thermal power supplied by the FPS has been reduced of 5% of the electrical signal to take into account the dissipations which occur in the cables and connectors of the outer circuits, which does not contribute to the thermal power supplied.
Fig. 2.12 depicts the comparison between the LBE mass flow rate measured by the Venturi flow meter (in red) and calculated by R5-3D (in black). Unless the experimental fluctuations, R5-3D well reproduces the LBE mass flow rate through the main flow path, in both GHC and NC conditions; after the transition, the code slightly overestimates the mass flow (about 0.5 kg/s). Fig. 2.13 shows the LBE temperature trend at the inlet and the outlet of the FPS active zone. At the inlet section, the code underestimates the LBE temperature, due to the lower temperature calculated inside the pool. The analysis of the pool temperature will be carried out in the following. At the outlet of the HS, the LBE temperature changes considering different sub-channels, due to the heat dissipation through the hexagonal shell. In order to valuate this effect, Fig. 2.13 shows the temperature measured by the TCs T-FPS-36 (in a central sub-channel) and T-FPS-34 (in a external sub-channel), comparing with the LBE temperature evaluated by the code in the same positions. The Fig. 2.13 shows that in the simulations a more predominant effect of the heat dissipation during the full power operation occurs. Then, after the transition, the calculations are in good agreement with the experimental data, highlighting that the code well reproduces the heat dissipation through the FPS external shell.
Title: Development of BE numerical tools for LFR design and safety analysis (2018)
Project: ADP ENEA-MSE PAR 2017
Distribution PUBLIC Issue Date 29.01.2019 Pag. RICERCA SISTEMA ELETTRICO Ref. ADPFISS-LP2-167 Rev. 0
32 di 163
The temperature drop across the HX is compared in Fig. 2.14; the primary inlet and outlet temperature follows a similar trend of the FPS. The HX inlet temperature is lower than the FPS outlet temperature (about 30 K), due to the heat dissipations through the walls of the fitting volume, the riser and the separator, highlighting a good prediction of the heat dissipations by the code. After the simulated station blackout, the temperature drop across the HX is due to the heat dissipation through the cylindrical shell, which are well predicted by R5-3D. Fig. 2.15 depicts the comparison of the DHR temperature drop of the LBE. During the first 25000 s, the temperature distribution along the DHR primary side is strongly affected by the thermal stratification of the LBE inside the pool, due to the low air mass flow rate on the secondary side. After the transition, the air starts to flow along the DHR and the LBE temperature is well predicted by the code. In the las part of the test, the inlet temperature is a slightly overestimated, due to the buoyancy effects inside the pool.
One of the main tasks of the activity is the investigation of the capability of RELAP5-3D to reproduce three-dimensional phenomena occurring in large volumes, such as the pool of HLM reactor. CIRCE facility offers useful data for this evaluation. The analysis, presented from Fig. 2.16 to Fig. 2.18, is carried out at final conditions of the full power operation (25000 s) and at two instants of the NC conditions (at 80000 s, 200000 s), showing the evolution of the LBE temperature during the whole test. From Fig. 2.16 to Fig. 2.18 the calculation results are compared with the experimental data, measured by the 119 TCs installed inside the pool (see Fig. 2.8). In the picture (a), the temperature obtained averaging the data acquired by the thermocouples A, B, C, D and E is compared with the temperature calculated in the same position (between the HX and the DHR) by R5-3D; in the same way, the average temperature of the TCs F and G and the temperature measured by TCs I and H are compared with the simulation results in pictures (b), (c) and (d). The experimental campaign highlighted that phenomena of mixing convection do not occur inside the pool; the LBE temperature assumes the same value at each level. This result is also obtained by R5-3D; for this reason, the analysis is focused on the vertical thermal stratification. The test starts at uniform conditions inside the pool (about 600 K). After the activation of the gas injection system, of FPS and of FW system, the LBE temperature in the upper part of the pool starts to increase, due to the heat dissipations from the primary flow path, and the temperature in the lower part starts to decrease, due to the cold LBE exiting the HX. The qualitative trend of the LBE temperature is the same of the DHR inlet and outlet in the first 25000 seconds. The axial distribution of the temperature is shown in Fig. 2.16, which highlights that the code is able to reproduce the qualitative trend of the temperature inside the pool. The underestimation of the temperature is probably due to the overestimation of the heat losses toward the environment.
After the simulated station blackout, the temperature in the upper part of the pool rapidly decreases, due to the reduction of the LBE temperature through the main flow path. Fig. 2.17 shows the comparison at 80000 s; during the experiment, the gradient between 5 m and 7 m, rapidly reduces, obtaining a slightly uniform temperature of about 575 K, and the second gradient moves downward at the DHR outlet level, where the cold LBE exits. The code well reproduces this transition. After that, the temperature inside the pool increases, following the same trend of the primary flow path. The code is able to reproduce this evolution, evaluating very well the level where the thermal stratification occurs.
2.3 Conclusive remarks
The aims of the experimental campaign performed on CIRCE-ICE have been to investigate the main thermal-hydraulic phenomena which characterize the HLM systems and to provide data for the validation of the computational code. The experiment has reproduced a protected loss of heat sink (PLOHS) plus a loss of flow (LOF) simulating the total loss of primary flow, the loss of the secondary circuit, the consequent scram of the reactor and the activation of the DHR system. The goal of the activity has been to investigate the capability of RELAP5-3D to reproduce the transition between gas enhanced circulation to natural circulation
The thermal-hydraulic model has been developed in order to compare the main parameters in the exact position of the instrumentations. At this purpose, a mono-dimensional nodalization scheme has been developed to reproduce the primary and the secondary main flow path and a detailed three-dimensional component to model the pool.
The comparison between the experimental data and the calculations results has highlighted the capability of R5-3D to reproduce the thermal-hydraulic behavior of the main primary flow path. The code is able to reproduce the LBE circulation in both gas-enhanced and natural conditions; moreover, the LBE thermal-hydraulic properties correlations, implemented in RELAP5-3D as descripted in Ref. [2.8], well simulate the coolant behavior and the HLM default correlations for the heat exchange, assuming little corrections following the actual state of art, provide good estimation of the thermal power exchanged through the main mono-dimensional components.
One of the main tasks of the activity has been to investigate the capability of RELAP5-3D to reproduce 3D thermal-hydraulic phenomena inside large volumes, such as HLM pools. At this purpose, CIRCE facility, equipped with 119 TCs to obtain the LBE temperature inside the pool, offers useful data. The comparison between experimental data and simulation results highlights that the movement and the mixing convection of the fluid inside the pool is well reproduced. The main phenomenon which occurs inside the pool is the axial thermal stratification, due to the heat losses through the wall of the primary flow path. The code is able to reproduce the heat dissipations and the LBE temperature trend inside the pool. Slight discrepancy has been noticed in the central part of the pool, probably due to the prediction of the heat dissipations in this level. In fact, the operative range of the heat exchange correlation implemented in RELAP5-3D are not respected in a large volume such as a pool. The fitting volume provides a large heat exchange area in this axial level and an underestimation of the heat transfer coefficient on the pool side provides a slight underestimation of the heat dissipated through its wall. The future activities should be focused on the development and the implementation of correlations for the estimation of the HTC in large HLM volumes.
Parameters Value
Outside diameter (mm) 1200
Wall thickness (mm) 15
Material AISI 316L
Max LBE inventory (ton) 90
Temperature range (K) 473 to 773
Tab. 2.1 – CIRCE S100 main parameters
Parameters GHC NC
Duration (h) 8 97
Electical power supplied (kW) 600 23
Ar injection (Nl/s) 5.2 0
Feed-water mass flow rate (kg/s) 0.5 0
DHR air injection (kg/s) ~0 0.289
Tab. 2.2 – TEST IV boundary conditions
Parameters Value
Number of hydrodynamic volumes 1929 Number of hydrodynamic junctions 4856 Number of heat structure mesh points 15353
Title: Development of BE numerical tools for LFR design and safety analysis (2018)
Project: ADP ENEA-MSE PAR 2017
Distribution PUBLIC Issue Date 29.01.2019 Pag. RICERCA SISTEMA ELETTRICO Ref. ADPFISS-LP2-167 Rev. 0
34 di 163
Fig. 2.1 – CIRCE isometric view
Title: Development of BE numerical tools for LFR design and safety analysis (2018)
Project: ADP ENEA-MSE PAR 2017
Distribution PUBLIC Issue Date 29.01.2019 Pag. RICERCA SISTEMA ELETTRICO Ref. ADPFISS-LP2-167 Rev. 0
36 di 163
Fig. 2.4 – FPS cross section
Title: Development of BE numerical tools for LFR design and safety analysis (2018)
Project: ADP ENEA-MSE PAR 2017
Distribution PUBLIC Issue Date 29.01.2019 Pag. RICERCA SISTEMA ELETTRICO Ref. ADPFISS-LP2-167 Rev. 0
38 di 163
Title: Development of BE numerical tools for LFR design and safety analysis (2018)
Project: ADP ENEA-MSE PAR 2017
Distribution PUBLIC Issue Date 29.01.2019 Pag. RICERCA SISTEMA ELETTRICO Ref. ADPFISS-LP2-167 Rev. 0
40 di 163
Fig. 2.10 – Nodalizzation scheme: multi-dimensional model
Title: Development of BE numerical tools for LFR design and safety analysis (2018)
Project: ADP ENEA-MSE PAR 2017
Distribution PUBLIC Issue Date 29.01.2019 Pag. RICERCA SISTEMA ELETTRICO Ref. ADPFISS-LP2-167 Rev. 0
42 di 163
Fig. 2.12 – LBE mass flow rate
Fig. 2.13 – FPS inlet/outlet temperature
Fig. 2.14 – HX inlet/outlet temperature
Fig. 2.15 – DHR inlet/outlet temperature
(c) (d)
Fig. 2.16 – TS and MC: 25000 s
(a) (b)
(c) (d)
Title: Development of BE numerical tools for LFR design and safety analysis (2018)
Project: ADP ENEA-MSE PAR 2017
Distribution PUBLIC Issue Date 29.01.2019 Pag. RICERCA SISTEMA ELETTRICO Ref. ADPFISS-LP2-167 Rev. 0
44 di 163
(a) (b) (c) (d)Fig. 2.18 – TS and MC: 200000 s
2.4 List of References
[2.1] L. Gramiccia, D. Vitale Di Maio, F. Giannetti, M. Tarantino, D. Rozzia, A. Toti, Definizione ed implementazione preliminare di un laboratorio per l'investigazione della termofluidodinamica dei metalli liquidi (Double-wall bayonet tube steam generator for LFR application. Preliminary characterization). Report RdS/2011/50, 2011.
[2.2] A. Gandini, L. Cretara, F. Giannetti, M. Frullini, V. Peluso, Attività di analisi di sensitività con metodologie GPT applicate a noccioli critici e sottocritici raffreddati a piombo. Report RdS/2012/37, 2012.
[2.3] L. Ferroni, F. Giannetti, J. Manzano, M. Ciotti, Studi di sostenibilità sui sistemi nucleari refrigerati a piombo. CERSE-UNIRM RL 1190/2013, 2013.
[2.4] C. Parisi, F. Giannetti, A. Naviglio, G. Caruso, Determinazione dei parametri di sicurezza del core e dell’andamento del burnup di un reattore veloce refrigerato a metallo liquido. ADPFISS-LP2-000, 2013.
[2.5] A. Cammi, S. Lorenzi, R. Ponciroli, L. Ferroni, F. Giannetti, D. Vitale Di Maio, V. Covicchio, Studi di sostenibilità volti a massimizzare l’utilizzo del combustibile e a minimizzare le scorie nucleari con i sistmi veloci refrigerati a piombo. ADPFISS-LP2-045, 2014.
[2.6] F. Giannetti, D. Vitale Di Maio, A. Naviglio, G. Caruso, Thermal-hydraulic analysis of an innovative decay heat removal system for lead-cooled fast reactors. Nucl. Eng. Des. 305, 168-178,
http://dx.doi.org/10.1016/j.nucengdes.2016.05.005, 2016.
[2.7] N. E. Todreas, M. S. Kazimi, Nuclear System – Thermal Hydraulic Fundamentals. Taylor $ Francis, ISBN 0-89116-935-0, 1993.
[2.8] P. Balestra, F. Giannetti, G. Caruso, A. Alfonsi, New RELAP5-3D lead and LBE thermophysical properties implementation for safety analysis of Gen IV reactors. Sci. Technol. Nucl. Install.,
http://dx.doi.org/10.1155/2016/1687946, 2016.
[2.9] OECD/NEA Nuclear Science Committee, Handbook on Lead-bismuth Eutectic Alloy AND Lead Properties, Materials Compatibility, Thermal-hydraulics and Technologies. 2015.
[2.10] D. Rozzia, A. Del Nevo, M. Tarantino, V. Narcisi, D. Vitale di Maio, F. Giannetti, G. Caruso, ALFRED-SGBT. Preliminary cheracterization by the HERO test section. ADPFISS-LP2-100, 2015. [2.11] M. Tarantino, D. Rozzia, A. Del Nevo, F. Giannetti, CIRCE-HERO test setup. Tech. Rep. D4.3,
H2020 SESAME project, 2016.
[2.12] V. Narcisi, F. Giannetti, A. Del Nevo, M. Tarantino, G. Caruso, Pre-test analysis of the protected loss of primary pump transient in CIRCE-HERO facility. J. Phys. Conf. Ser. 923 (012005).
http://dx.doi.org/10.1088/1742-6596/923/1/012005
[2.13] V. Narcisi, F. Giannetti, A. Del Nevo, M. Tarantino, G. Caruso, Pre-test analysis of accidental transients for ALFRED SGBT mock-up characterization. Nucl. Eng. Des. 333, 181-195,
https://doi.org/10.1016/j.nucengdes.2018.04.015, 2018.
[2.14] V. Narcisi, F. Giannetti, G. Caruso, D. Rozzia, A. Del Nevo, M. Tarantino, Installazione della sezione di prova HERO nella facility CIRCE: sviluppo nodalizzazione e progettazione della campagna sperimentale. ADPFISS-LP2-133, 2016.
[2.15] V. Narcisi, P. Lorusso, F. Giannetti, A. Del Nevo, M. Tarantino, Analisi di pre-test della campagna sperimentale CIRCE/HERO con codici di sistema. ADPFISS-LP2-151, 2017.

![Fig. 4.3 - STH modeling for TALL-3D. Left, central and right vertical leg (from left to right) in 1D system model with 3D test section [4.9]](https://thumb-eu.123doks.com/thumbv2/123dokorg/5605604.67926/84.892.95.791.81.553/modeling-tall-left-central-right-vertical-model-section.webp)