INDEX
page
1. OBJECTIVE AND SCOPE 10
2. STRUCTURE 11
3. CALCULATIONAL TOOLS 13
3.1 Codes 13
3.2 Nuclear Data and Physics 13
Dpa cross-sections 13
Neutron and photon flux-to-dose response functions 14
Temperature of neutron data 14
Physics options within MCNP/X 14
3.3 Variance reduction 14
4. BASIC CALCULATIONAL MODEL OUT TO THE PRESSURE VESSEL 16
WELL
4.1 Source description 16
4.1.1 Source energy description 16
4.1.2 Source spatial description 17
4.2 Geometrical and material description 17
4.2.1 Core: active zone 17
Radial description 17
Axial description 18
Compositions 18
4.2.2 Core: regions between the core plates and the active zone 18
4.2.4 Top core plate 19 4.2.5 Region above the top plate and within the reflector and the barrel 20
4.2.6 Reflector 20
4.2.7 Barrel 20
4.2.8 Radial interstitial water within barrel 20
4.2.9 Lower barrel annular support with its eight azimuthal supports 21
4.2.10 Bottom shield 21
4.2.11 Between the core and the pressure vessel 21
4.2.12 Pressure vessel liner and vessel 22
4.2.13 Concrete liner and concrete outside the PV 22
5. RESULTS FOR PRESSURE VESSEL DAMAGE 23
5.1 Reference calculation (Case “R”) 23
5.1.1 Contributions from different parts of the fission spectrum 23
Discussion 23
5.2 Smearing the 40 outer assemblies (both source and geometry) (Case “A”) 24 5.2.1 The neutron flux leaking from the pressure vessel (for purposes of comparison) 24 5.2.2 Further examination of neutron fluence and neutron-induced dpa 25
underneath the azimuthal struts
5.2.3 Comparison of neutron-induced dpa using BISERM and JEFF-3.1 data 26
5.3 Employing a 241Pu fission spectrum (case “B”) 27
Discussion 27
5.4 Reducing the reflector thickness (case “C”) 27
5.5 Changing from the Standard to the Enhanced Moderation assemblies (case “D”) 28 5.5.1 The neutron flux leaking from the pressure vessel (for purposes of comparison) 28 5.6 Changing from the Standard to the Enhanced Moderation assemblies, 28
simultaneously reducing the reflector thickness
Discussion 29 5.8 Addressing the spatial distribution of the fission source (case “E”) 29
5.9 Calculated upper limits and damage limits 30
5.9.1 Reference case 30
5.9.2 Case “D” (Enhanced Moderation fuel assemblies with thinner reflector) 31
6. DOSE DURING RUNNING OUTSIDE THE BIOLOGICAL SHIELD 33
6.1 Calculational model: geometrical and material description 33 6.1.1 Between the pressure vessel and the containment vessel 33
6.1.2 Steam generators 34
First model 34
Second model 36
6.1.3 Outside the containment vessel 37
6.2 Source and core description 37
6.3 Results for dose during running outside the biological shield 38
Discussion 39
Tables 6.1 – 6.7 40
7. EOL ACTIVITY IN PV LINER, PV, CONCRETE LINER AND CONCRETE 47
7.1 Calculational model: materials and geometry 47
7.1.1 Pressure vessel liner and pressure vessel 47
Neutron and gamma transport 47
Activation 47
7.1.2 Steel liner of concrete 47
Neutron and gamma transport 47
Activation 47
Neutron and gamma transport 47
Activation 49
7.1.4 Question of the impurities perturbing the neutron fluxes 50 7.2 Calculational model for finding the maximum activities: spatial binning 50
of the neutron fluxes
7.3 Results for activation rates of PV liner, PV, concrete liner and concrete 51 in PV well
7.4 Results for maximum EOL activity in PV liner, PV, concrete liner 52 and concrete in PV well
Discussion 52
7.5 Results for maximum EOL activity in PV liner, PV, concrete liner 54 and concrete in PV well with concrete boration
Discussion 54
7.6 Results for average EOL activity in PV liner and PV 55
Discussion 56
Tables 7.1 – 7.16 57
8. MAINTENANCE DOSES IN THE PRESSURE VESSEL WELL 70
8.1 Calculational model for the neutron transport: materials and geometry 70
8.1.1 Core 70
8.1.2 Upper and lower plena regions 70
8.2 Calculational model for the neutron transport: spatial binning of the 71 neutron fluxes
8.3 Calculational model for the activation gamma transport: materials and 72 geometry
8.4 Results 72
8.4.1 Activation and activity 72
Active core 72
Plena 74
Discussion 74 8.4.3 Gamma doses from core and lower plenum after 3 days cooling 75
Discussion 75
8.4.4 Gamma doses with four times the reference cobalt content in the barrel 75
Discussion 75
8.4.5 Gamma doses from the cobalt in the PV 75
Discussion 75
Tables 8.1 – 8.4 76
9. IMPROVED MODELING OF THE STEAM GENERATORS 80
9.1 Geometrical and material description 80
9.1.1 Steam generator lower supports 80
First (homogeneous) model 80
Second (heterogeneous) model 80
9.1.2 Steam generators: third model 81
9.1.3 Materials 82
9.2 Calculational model: spatial binning of the neutron fluxes 82
9.3 Results 83
10. MAINTENANCE DOSES BETWEEN THE PRESSURE VESSEL AND THE 84
CONTAINMENT VESSEL
10.1 Calculational model for generating the neutron fluxes: geometrical and 84 material description
10.1.1 Emergency boron tanks 84
10.1.2 LGMS injection tanks 84
10.1.3 ADS quench tank 85
10.1.4 Gratings 85
10.1.6 Illustration of tanks, gratings and water pipes 85
10.2 Source and core description 86
10.3 Calculational model for generating the activation sources: spatial binning 86 of the neutron fluxes
Sources inside the pressure vessel including the pressure vessel itself 87 10.4 Calculational model for the activation gamma transport: materials and 87
geometry
10.5 Activity dose points between the PV and CV 88
10.6 Results for maintenance doses between the PV and CV 89 10.7 Gamma doses from core and upper plenum after 3 days cooling 91 10.8 Results for maintenance doses between the PV and CV with four times the 91
reference cobalt content in the steel of the inlet nozzles and main deck gratings
Discussion 91
10.9 Gamma doses from the cobalt in the PV 92
Discussion 92
10.10 Removing the end flange of the inlet nozzle 92
Tables 10.1 – 10.6 93
11. DOSES DURING RUNNING IN THE AREA UNDER THE REACTOR, 98
HOUSING THE SEISMIC ISOLATORS
11.1 Calculational model 98
11.2 Results 98
12. ACTIVATION DOSE AROUND BARE STEAM GENERATOR 99
12.1 Calculational model for generating the neutron fluxes: geometrical and 99 material description
12.2 Calculational model: activation and activity 99
12.3 Results for doses around bare, extracted steam generator 99
12.4 Results for doses around bare, extracted steam generator with four times the 100 reference cobalt content
Discussion 100
Tables 12.1 – 12.2 101
13. EOL ACTIVITY IN REFLECTOR AND BARREL AND CONSEQUENT 103
ACTIVATION DOSE AROUND BARE REFLECTOR AND BARREL
13.1 Calculational model for generating the neutron fluxes: geometrical and 103 material description
13.2 Calculational model: activation and activity 103
13.3 Results for EOL activity in reflector and barrel 103
Discussion 103
13.4 Results for doses around bare, extracted reflector and barrel 103
Discussion 104
13.5 Results for doses around bare, extracted reflector and barrel with four 104 times the reference cobalt content
Discussion 104
Tables 13.1 – 13.4 105
14. CHANGING THE CONCRETE IN THE PV WELL TO CARBON STEEL: 108
IMPACT ON EOL ACTIVITY
14.1 Calculational model for generating the neutron fluxes: geometrical 108 and material description
14.2 Calculational model: activation and activity 108
14.3 Results for activation rates in the carbon steel in PV well 108 14.4 Results for maximum EOL activity in the carbon steel in PV well 109
Discussion 109
Tables 14.1 – 14.3 111
16. SUMMARY OF RESULTS 115
16.1 Damage to the Pressure Vessel (§5) 115
Fast neutron fluence (>1 MeV) 115
Neutron dpa 115
Gamma dpa 115
16.2 Doses during running outside the biological shield (§6) 116 16.3 EOL activity in PV liner, PV, concrete liner and concrete of 117
PV well (§7)
Maximum activities without concrete boration 117
Maximum activities with concrete boration 118
Average activities in the PV liner and PV 118
16.4 Maintenance doses in the PV well (§8) 119
16.5 Maintenance doses in cavities between the PV and the 120 containment (§10)
16.6 Dose during running in the area housing the seismic isolators (§11) 121 16.7 Maintenance dose around an extracted steam generator (§12) 122 16.8 EOL activity in reflector/barrel and consequent activation dose 122
around extracted reflector/barrel (§13)
16.9 Changing the concrete in the PV well to carbon steel: impact on 123 EOL activity (§14)
Acknowledgements 124
REFERENCES 125
FIGURES 1 – 187 130
1. OBJECTIVE AND SCOPE
This work was carried out in the period November 2007 to October 2009. It used as starting point work done by the Politecnico di Milano in the period 2002-2003 (references cited in the text). It was coordinated by Westinghouse and Georgia Tech. (see acknowledgements) through frequent conference calls and workshops (the latter roughly every six months, sometimes within the IRIS team meetings, sometimes outside).
With the IRIS design as at roughly the beginning of 2008, the objectives were:
- to calculate the pressure vessel (PV) damage from all radiation types and to verify whether the bottom shield, present in the design at the end of 2007, could be removed. - to calculate the dose during running in the control room.
- to calculate the activity at end-of-life (EOL) of the PV, concrete liner and concrete in the PV well.
- to calculate the dose around an extracted activated steam generator during a maintenance period.
- to calculate some doses during maintenance operations in the zones between the PV and the containment vessel.
Subsequently during the work the objectives were expanded to include estimations of: - the dose during maintenance operations in the PV well.
- the dose during running in the zone under the reactor, housing the seismic isolators and the lifetime dose to the isolators themselves.
- the dose around the extracted reflector and barrel at EOL.
The radiation source was the fission rate in the reactor core. The fission neutrons contribute directly to some responses (neutron damage to the vessel, neutron dose during running), indirectly, via the production of prompt gamma rays, to others (gamma damage to the vessel, gamma dose during running) and also indirectly, through activation, activity and delayed gamma rays, to doses at various times after shut-down and after various lengths of operation.
Not included are other radiation sources such as spent fuel assemblies outside the core, waste tanks, deposits in pumps, deposits in pipes, deposits in filters, etc. As far as the latter are concerned, note that in general only fixed structure activation sources are considered, and not transported sources such as deposits, plating, etc.
Furthermore the presence of 16N (T1/2: 7.1 s) as a radiation source in the primary coolant
was ignored. This was justifiable for the calculation of the doses during maintenance operations which were assumed to be never less than 24 h after shutdown. Instead for the calculation of the dose during running [around the seismic isolators (§11 and §16.6) and especially in the control room (§6 and §16.2)], this may not be justified. (For example the time for the primary water to get from the core to the upper part of the PV, at a similar level to accessible parts of the reactor building, is not very much longer than the half life of 16N.)
Accident scenarios were not considered. Notwithstanding, some of the results, such as
2. STRUCTURE
Chapter 3 cites the tools employed for the study: codes and data and mentions any modifications to standard codes that were made for this work. Also the in-house variance reduction vehicle is summarised.
Chapter 4 describes the basic calculational model: the fission source in the core with its spatial and energy distribution and the geometry and materials from the core out to the concrete of the PV well.
In chapter 5 the results for radiation damage to the pressure vessel are presented, both for the reference configuration (§5.1) and for a number of variations around this configuration (Fig. 18). For these results, a 60 year lifetime is assumed. It is shown that the bottom shield is redundant from the point of view of PV damage.
In chapter 6 the geometrical and material model is extended out to the control room. Dose results are generated for a 1 m thick biological shield. As the important radiation path from the core to the control room is through the lower part of the steam generators, new doses are generated with an improved modeling of this zone. Finally the thickness of the biological shield was increased from 1m to 1.5 m and dose results are presented for the new thickness.
In chapter 7 the maximum activities after two different irradiation times (60 and 100 years) and four different cooling times (7 days, 60 days, 2 years and 10 years) of the PV liner, PV, concrete liner and concrete in the PV well are calculated. The activities are calculated for the most important nuclides and compared with the clearance levels. The same results are generated with borated concrete. Average activities are also generated for the PV liner and PV (both separately and together).
In chapter 8 activation doses in the PV well are generated for 100 year irradiation time (10 years for the fuel assemblies) and 1 day cooling. The source in the active core (responsible for most of the dose) is checked with other codes and data. Variations on the reference are: 3 days cooling for the core and the plena, 4 times the reference cobalt content in the barrel and isolation of the cobalt contribution to the dose from the PV.
In chapter 9 an improved modeling of the steam generators and inclusion of their lower supports is presented.
Chapter 10 presents results for the dose during maintenance operations in the cavities between the PV and the containment vessel and outside the PV well. First the modeling of the various structures in these zones that are activated is introduced. The spatial division of these structures to score the neutron flux is discussed. The dose after 100 years irradiation (10 years for active core and plena) and 1 day cooling is presented at a variety of points throughout these cavities. An estimate is made of the dose from structure that has not been explicitly modeled (employing the “Gross Structure Constant”). Variations on the reference are: 3 days cooling for the core and the plena, 4 times the reference cobalt content in selected structures between the PV and the containment, isolation of the cobalt contribution to the dose from the PV and voiding the secondary circuit and removing the end flange of the inlet nozzle.
In chapter 11 the dose results in the zone under the reactor, housing the seismic isolators are presented.
In chapter 12 the doses around an extracted steam generator are presented, under the conditions of 100 year irradiation and 1 day cooling. A variation on the reference is 4 times the reference cobalt content in the lower support structure and bottom header.
In chapter 13 the doses around the extracted reflector and barrel are presented, under the conditions of 100 year irradiation and 2 year cooling. The activity of the reflector and barrel are also given. Only for the dose results, a variation on the reference is 4 times the reference cobalt content in the reflector and barrel.
Chapter 14 deals with the substitution of the concrete in the PV well by carbon steel and considers the activity of this steel at EOL [100 years operation and four different cooling times (7 days, 60 days, 2 years and 10 years)].
In chapter 15 some quality control considerations are made concerning the internal consistency of the Monte Carlo calculations.
Chapter 16 gives summary results and concluding remarks. (Note that here the results for radiation damage to the pressure vessel assume a 100 year lifetime.)
3. CALCULATIONAL TOOLS
3.1 Codes
For the neutron and gamma ray (prompt or activation gamma’s) transport, MCNP5 [1] (RSICC-NEA distribution) was employed for the calculations with all 89 core assemblies modeled in a homogeneous fashion (see §4.2.1). Instead MCNPX2.6.d [2] ( test version) was employed for the calculations with the 40 outer assemblies modeled pin-by-pin and the 49 inner assemblies modeled homogeneously. (Use of the two codes was called for because of computer memory problems with the MPI implementation of MCNP5 for the mixed pin-by-pin/homogeneous core model.)
For the activation and activity calculations and generation of the activation gamma ray source, FISPACT (2001 version) [3] was employed together with the option of the XMAS 172 energy group structure.
3.2 Nuclear Data and Physics
With both MCNP-based codes, the cross-sections available with MCNP5 were employed: – neutron cross-sections: all from the “ACTIA” file (Appendix G in [1], [4] and [5]) (based on ENDF/B-VI Release 8) with the exception of: 2H, 10B, 11B, Cnat, 17O, 31P, Zrnat, 93Nb, Monat, 235U
and 238U which were from the ENDF66 file (Appendix G in [1], [6] and [7]) (based on ENDF/B-VI Release 6) and Snnat from the ENDL-92 file (Appendix G in [1], and [8]) (based on ENDL
data).
– thermal neutron data libraries: hydrogen in light water from the SAB2002 file (based on ENDF/B-VI Release 3) (Appendix G in [1], and [9]). Note that, due to an oversight, older data from the TMCCS file (based on ENDF/B-III) (ibid.) were employed in the pressure vessel damage calculations.
– photon cross-sections: all from the “MCPLIB04” file (Appendix G in [1], [10] and [11]) (based on ENDF/B-VI Release 8).
FISPACT employs EAF2001 data [12] that originate from a number of sources (JEF-2.2, EFF-2.4, ENDF/B-VI, JENDL-3.2/A and IRDF-90.2).
Dpa cross-sections
Neutron dpa cross-sections for 50Cr, 52Cr, 53Cr, 54Cr, 55Mn, 54Fe, 56Fe, 57Fe, 58Fe, 58Ni and
60
Ni were used from the BISERM data library [13], obtained with the IOTA code [14]. Results were also verified independently, employing neutron dpa cross-sections for all the components of the pressure vessel (see §4.2.12) from a library based on JEFF-3.1 [15].
Neutron and photon flux-to-dose response functions
For the dose tallies, neutron and photon flux-to-dose response functions were taken from [17]. (For neutrons, the maximum dose equivalent along the diameter of the ICRU sphere was used. For photons, up to and including 3 MeV, the H*(10) (ambient dose equivalent) values were used; above 3 MeV the maximum dose equivalent along the diameter of the ICRU sphere was used.) The same flux-to-dose response functions were employed both for the normal tallies and for the mesh tallies.
Temperature of neutron data
All neutron cross-sections employed, including those in the core, were doppler broadened to 20°C. (This should be slightly conservative.) Then the elastic scattering cross-section in the thermal range was adjusted to 300°C with the free gas thermal treatment model for all cross-sections of materials within the pressure vessel including the vessel itself. (Also with the same model the velocity of the target nucleus was adjusted to 300°C.) Instead for all cross-sections of materials outside the pressure vessel, a temperature of 20°C was employed for the thermal treatment with the free gas model.
At energies less than 4 eV, the S(,) data employed for hydrogen attached to the water molecule were at two different temperatures: 300°K and 600°K (600°K everywhere within the vessel, 300°K outside).
Physics options within MCNP/X
When data tables were available, the probability table treatment in the unresolved resonance energy range was employed.
For photons, the options chosen were “detailed physics” with coherent scattering and production of bremsstrahlung photons with the thick target bremsstrahlung model, but with no Doppler energy broadening. For the damage calculations, because of the threshold energy for dpa, an energy cut-off of 700 keV was employed. In this case these options are surely not necessary and the “simple physics” could have been used.
3.3 Variance reduction
The method employed was the DSA (Direct Statistical Approach) (see for example [18]). The DSA currently runs with MCNPX2.1.5 [19]. Therefore small changes needed to be made to the inputs for MCNP5 to be compatible with the older MCNPX2.1.5. (The inputs for MCNPX2.6.d, employed for the calculations with the 40 outer assemblies modeled pin-by-pin, were run with the DSA. Instead variance reduction parameters generated with the DSA for the case of all-smeared assemblies were converted to the appropriate format in the inputs that contained the pin-by-pin description in the outer assemblies.)
Because of the very different variance reduction parameters required for neutrons compared with gamma rays, usually separate runs were made for the neutron responses and for the gamma responses. In the n- runs (with no source biasing), the standard DSA cell-importance mode was employed. Instead in the neutron-only runs (with an aggressive source biasing – see §4.1.1) the DSA weight-line mode was employed [20]. In both cases the resulting optimized variance
reduction parameters were converted to a weight window so as to be used in the standard versions MCNP5 and MCNPX2.6.d. [It is worthwhile noting that the parameter in MCNP/MCNPX that controls the maximum amount of splitting / Russian roulette (MXSPLN) is given much higher values, typically 100 or greater, than its default value of 5.] Strong source biasing was also employed in the gamma-only runs (i.e. activation gamma’s). Therefore the DSA weight-line mode was also employed in these calculations.
In all DSA calculations, the multi-response capability [18] was employed. For the calculation of the pressure vessel responses (fluxes, dpa’a and activation rates) the neutron flux in 4 energy groups (> 7 MeV, 1 – 7 MeV, 100 keV – 1 MeV and < 1 eV) in various spatial segments was employed with typically a total of 12 responses of interest. (The range 1 eV – 100 keV is then automatically covered through the neutron transport mechanism.) For the activation rates in the geometry outside the PV, the neutron flux in 3 energy groups (> 1 keV, 1 eV – 1 keV and < 1 eV) in various spatial segments was employed. For the gamma damage calculations to the PV, the gamma flux in 4 energy groups (> 6 MeV, 3 – 6 MeV, 1 MeV – 3 MeV and < 1 MeV) in various spatial segments was employed with again typically 12 responses of interest. (Although with the data used [16], the gammadpa threshold is 1 MeV and the effective lowest energy is roughly 4 MeV.) For the dose calculations (neutron and prompt gamma’s and activation gamma’s) the dose rate was directly employed as response-of-interest, albeit at a number of different spatial points (usually surface or volume segments).
The above energy division concerns the fluxes to be used as scoring the responses-of-interest. In the transport process, the variance reduction parameters were defined for neutrons in typically 10 energy groups (> 11.5 MeV, 8 - 11.5 MeV, 5.5 – 8 MeV, 2 – 5.5 MeV, 500 keV – 2 MeV, 100 – 500 keV, 10 – 100 keV, 100 eV – 10 keV, 1 – 100 eV and < 1 eV) and for gamma’s in typically 6 energy groups (> 5 MeV, 3 - 5 MeV, 1.5 – 3 MeV, 700 keV – 1.5 MeV, 200 – 700 keV, < 200 keV). The spatial grouping of the MCNP cells (of which there were typically around 2500) was into around 50 “macrocells” for the earlier limited geometries (up to the PV well) and around 80 macrocells for the later geometries that included the control room and the various structures between the PV and the containment.
The optimum variance reduction parameters (cell importances or weight lines) were then generated in a matrix of 5010 or 8010 phase space cells for the neutron runs and a matrix of 506 or 806 phase space cells for the gamma runs. For the n- runs, two matrices were employed for the neutrons and for the gamma’s. The optimisation was then carried out in the presence of up to 12 responses-of-interest.
If possible, the optimised variance reduction parameters already generated for a previous set of responses were employed in a new calculation. Usually this was not possible. (It would actually have been possible in more cases if the standard DSA cell-importance mode had been more often employed rather than the weight-line mode.) Therefore the optimization procedure usually had to be rerun (for a total of 10 – 20 times).
4. BASIC CALCULATIONAL MODEL OUT TO THE PRESSURE VESSEL
WELL
4.1 Source description
The fission source provided by WEC for running at 1000 MW (th) assumed 1/4 core azimuthal symmetry [21], [22]. There were two distinct spatial descriptions: pin-by-pin or smeared over each pin assembly. Both descriptions included the same axial variation: 37 axial bins distributed non-uniformly (with a finer binning at the top and bottom of the core). For each spatial bin (axial bin and assembly for the smeared case or axial bin and pin for the pin-by-pin case), the probability of the fissioning isotope was given for four isotopes: 235U, 238U, 239Pu and
241
Pu.
Two representative sources have been generated for each spatial description: an average source and a maximum source, the latter to be used for (high) instantaneous dose calculations during operation [23]. In all results presented here, the average source was employed. MCNP inputs have also been generated for the maximum source (both with the smeared assembly description and with the pin-by-pin description in the outer assemblies) but have not been used.
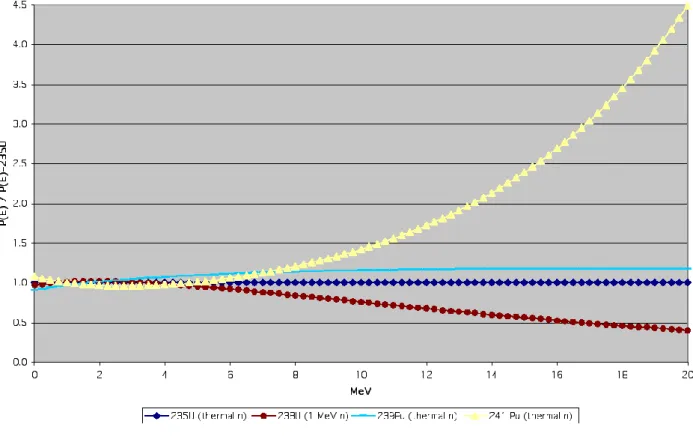
As a first model it was decided to choose a single isotope and therefore separate the space and energy variables. For the reference calculation 235U was chosen. Fig.1 shows the fission spectra of 238U, 239Pu and 241Pu normalized to that of 235U (see §4.1.1). Probably a more conservative and realistic spectrum for the reference calculation would have been to use 239Pu and not 235U. The choice of 235U is considered in §5.1.1 (and in §7.4) where spectral safety factors are defined. In §5.3 a comparison is made with results generated from a 241Pu fission source spectrum.
4.1.1 Source energy description
MCNP/X allows a continuous energy analytic description of the fission spectrum. For the fissionable nuclides of interest here, the Watt fission spectrum is used for 235U, 238U and 239Pu and the Maxwell fission spectrum for 241Pu, each spectrum with the recommended parameters for the particular nuclide (Appendix H in [1]).
It was desired to flag different parts of the source energy spectrum to see their differential contributions to selected results of interest. It was not possible to effect this with the continuous, analytic, source fission spectrum. Therefore a group-wise source fission spectrum was generated from the analytic one in 200 energy bins. It is thought that this introduced negligible error with respect to the analytic spectrum. Whilst the 200 bins were employed for the sampling of the source energy, they were grouped into 20 macro energy bins for the source energy flagging.
The high energy tail of the fission spectrum provides the major contribution to ex-core neutron responses. This is particularly the case in IRIS where the pressure vessel is much farther from the core compared to conventional designs. Therefore a strong source biasing was applied (in the 20 macro energy bins which represented the first level of sampling). This source biasing was only applied for the neutron-only runs. In the n- runs (with all the responses gamma) no source energy biasing was applied because the gamma’s are mainly born in the reactor internals (principally the reflector and barrel) and, as progenitors, have neutrons from the higher probability part of the fission spectrum.
4.1.2 Source spatial description
The spatial source description was made compatible with the core geometry description (see §4.2.1). This resulted in two models:
- the source smeared over each of the 89 assemblies
- the source smeared over each of the 49 inner assemblies whilst maintaining a pin-by-pin description for the outer ring of 40 assemblies.
In both models the WEC axial description was preserved with the 37 axial bins [24].
To try to maintain a minimum of quality control, it was decided not to employ a “SOURCE” subroutine but to use the capabilities of the “SDEF” logic within MCNP/X. This proved possible with the 89 assembly-smeared source model but not with the model involving a mixture of smeared inner assemblies and pin-by-pin outer assemblies. For this model, it was necessary to modify MCNPX2.6.d (employed as discussed in §3.1 instead of MCNP5 for the mixed model). Such modification annulled to a great extent the reason for not employing a “SOURCE” subroutine.
For both spatial source models it was necessary to convert the WEC source format to that requested by the chosen “SDEF” logic (requiring also an expansion from 1/4 core to full core with the 89 assembly-smeared source model). For this purpose ad-hoc fortran programs were written. Although tested with various sources, including an artificially skewed source [25], these represent a diminution of quality control. Furthermore some manual data manipulation is still required to transfer sections of the outputs of these fortran programs to the appropriate array in “SDEF”, implying a further reduction of quality control.
4.2 Geometrical and material description
4.2.1 Core: active zone
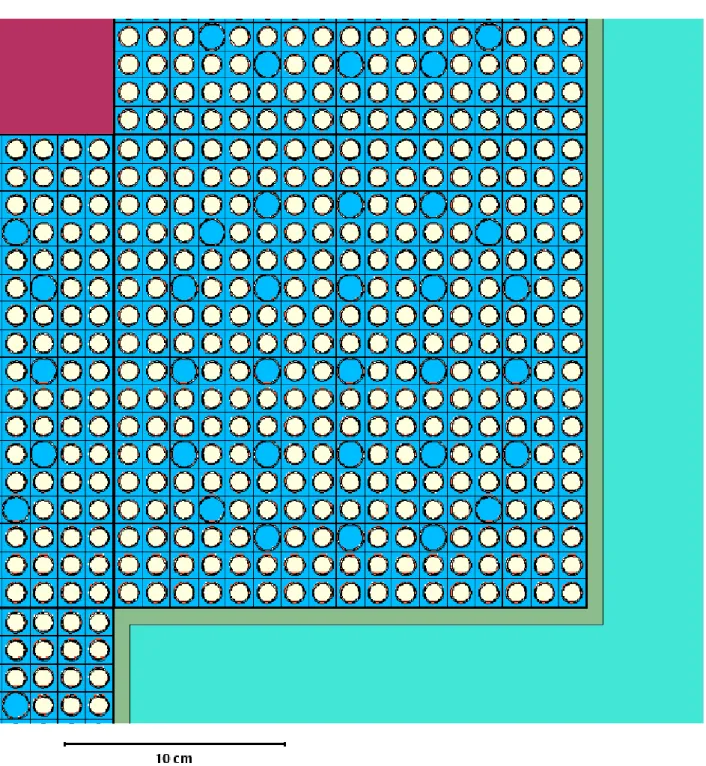
Radial descriptionReference calculation:Standard Westinghouse 17x17 fuel (the fuel data is given in [26] and [27]). A variation was to employ an assembly referred to as the “Enhanced Moderation lattice”, which features the same fuel dimensions (clad and pellet) as the Standard Westinghouse fuel, but with a slightly larger pitch between the rods. The enhanced moderation improves neutron thermalization, and thereby increases fuel utilization under typical LWR fuel management schemes. An MCNP model of the Standard fuel assembly design (one of the outer assemblies) is shown in Fig. 2.
For the case of smeared assemblies, the same composition was adopted (radially) for all the assemblies. That is, 1/2 the assembly-assembly gap was included on all four sides of each assembly, in the composition of the assembly. The same was done for the 28 assemblies that have 1 or 2 faces that correspond to the outer surface of the core.
For the core with the Enhanced Moderation fuel assemblies, the reflector dimensions are given in [28]. Water gaps between the core and the reflector are calculated accordingly (going from the smallest core/reflector dimension to the largest):
– pin-by-pin outer assemblies: cm. 0.973, 0.964, 0.960, 0.956 (from the outer surface of the cladding of the outer pin to the inner surface of the reflector).
The inner reflector dimensions were not defined for the Standard Westinghouse 17x17 fuel assembly. These were taken instead from [27] and produced the following core-reflector gaps (going from the smallest core/reflector dimension to the largest):
– smeared outer assemblies: cm. 0.746, 0.738, 0.733, 0.729;
– pin-by-pin outer assemblies: cm. 0.944, 0.935, 0.931, 0.926 (from the outer surface of the cladding of the outer pin to the inner surface of the reflector).
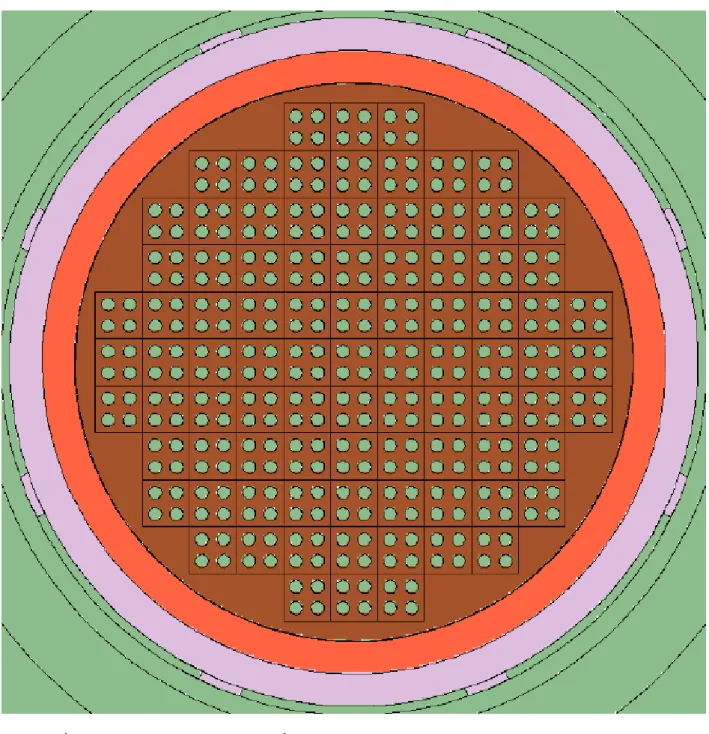
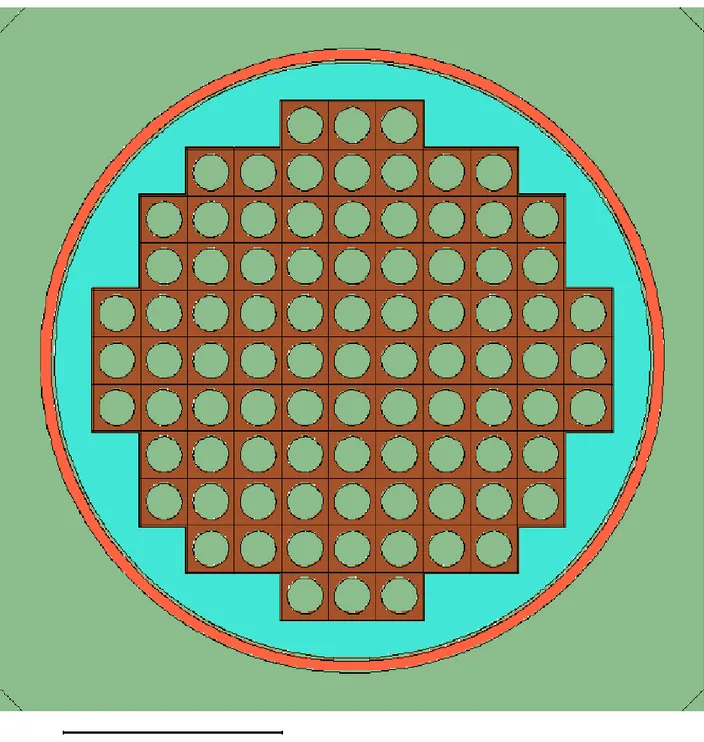
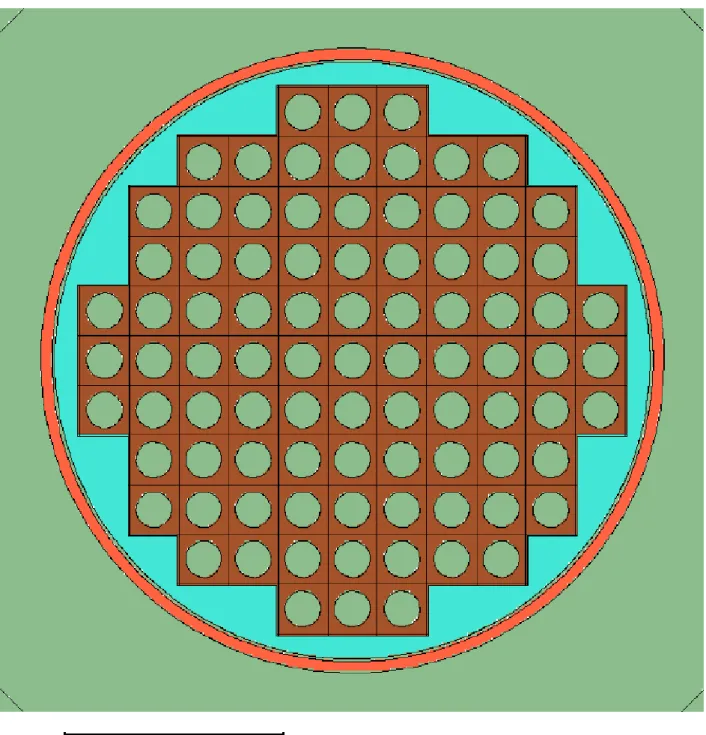
Fig. 3 shows a section of the MCNP model at the core centre for the case with the Standard Westinghouse 17x17 fuel and all assembly compositions smeared. (Note the change of colour of the materials in this and all following figures compared with Fig. 2.) Fig. 4 shows the same section for the core with the Enhanced Moderation fuel assemblies. Fig. 5 shows a quarter core section at the core centre for the case of the core with the Standard Westinghouse 17x17 fuel, inner assemblies smeared and outer assemblies modeled pin-by-pin.
Axial description
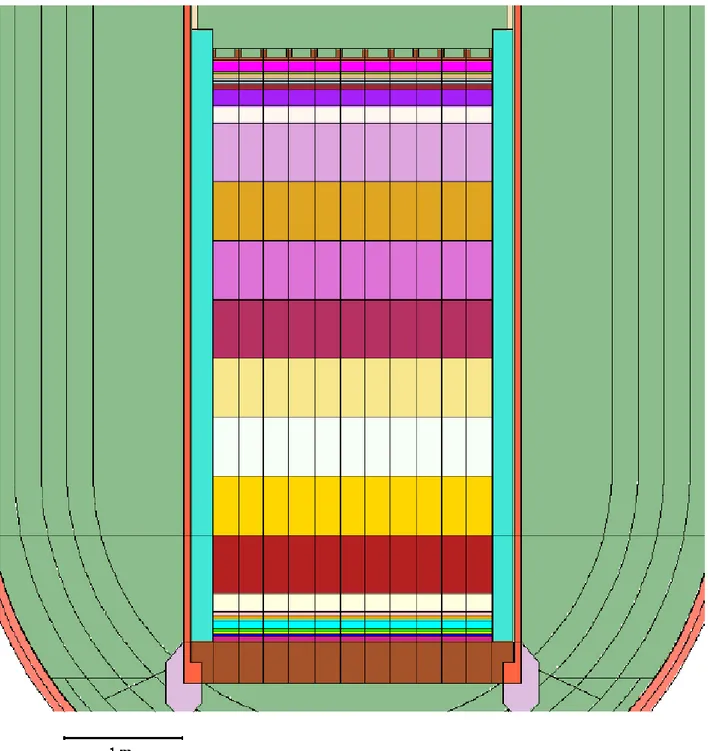
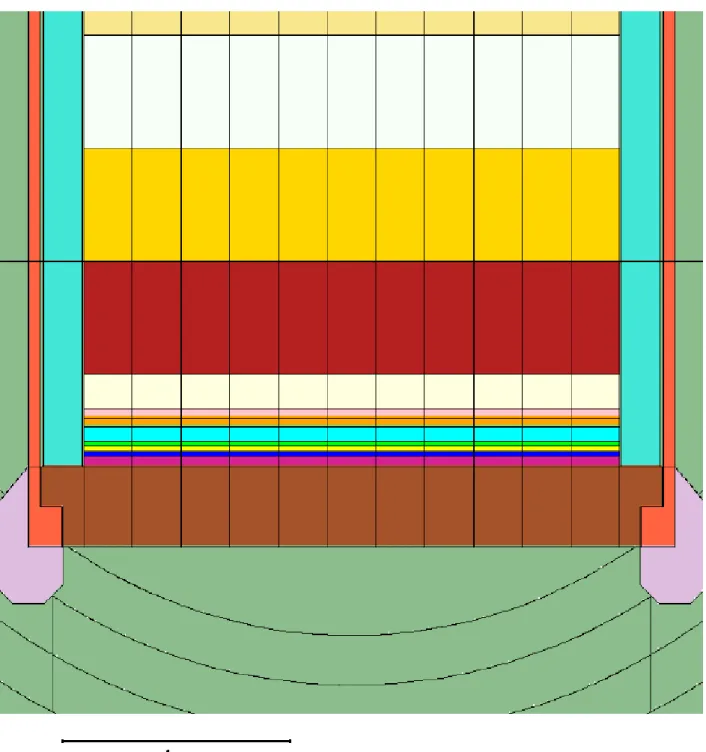
For both the Standard Westinghouse 17x17 fuel and the Enhanced Moderation fuel assembly, the active length of the core is taken from [21]. This is the length at the operating temperature. The corresponding variation of water density along the axial length of the core is given in [29]. Linear interpolation was employed to generate average water densities in 10 axial segments from the bottom to the top of the core [30], the first and last segments corresponding to the two end blankets. Fig. 6 shows an axial section of the MCNP model of the Standard fuel assemblies core with all the assemblies smeared.
Compositions
The fuel density for both the full-enriched and low-enriched (blanket) parts was taken as 10.412 g cm-3 (from the UO2 theoretical density reduced by a density factor). The full-enriched
part was taken as 4.95% (by wt) enrichment in 235U and the blankets as 2.10%. Simple chemical stoichiometry was assumed.
Zircaloy-4 composition and density (6.553 g cm-3) was taken from [31].
With these geometrical and material data, smeared compositions were generated in each of the 10 axial segments for the Standard Westinghouse fuel assemblies [32] and the Enhanced Moderation fuel assemblies [33]. Note that grids and sleeves, accounting for < 0.01 Zircaloy-4 volume fraction [34], have been neglected.
4.2.2 Core: regions between the core plates and the active zone
The only data available for the regions between the lower plate and the active zone and between the active zone and the upper plate (plena, end plug, nozzle, grid, springs, etc.) has been homogenized into 8 axial regions above the active zone and 7 axial regions below the active zone [35]. These data were used both for the Standard Westinghouse fuel assemblies (with both the pin-by-pin and the smeared description of the active zone) and for the Enhanced Moderation fuel assemblies. From these data, MCNP-compatible data were generated [36], employing the same
composition for steel as that used previously by PoliMi - AISI-304L [37] (7.85 g cm-3) and for inconel from [38] [8.1 g cm-3, % (assumed by weight) Ni 61, Cr 22.5, Fe 15.1, Al 1.4].
The hypothesis of homogeneous compositions in these regions is likely not conservative which is an important issue for the radiation impinging on the lower part of the PV. However:
– it was thought that this should not be too large an effect
– the results will show that the a much higher neutron flux impinges on the vessel due to radial rather than axial leakage from the lower part of the core.
Thus this non-conservative modeling is probably acceptable.
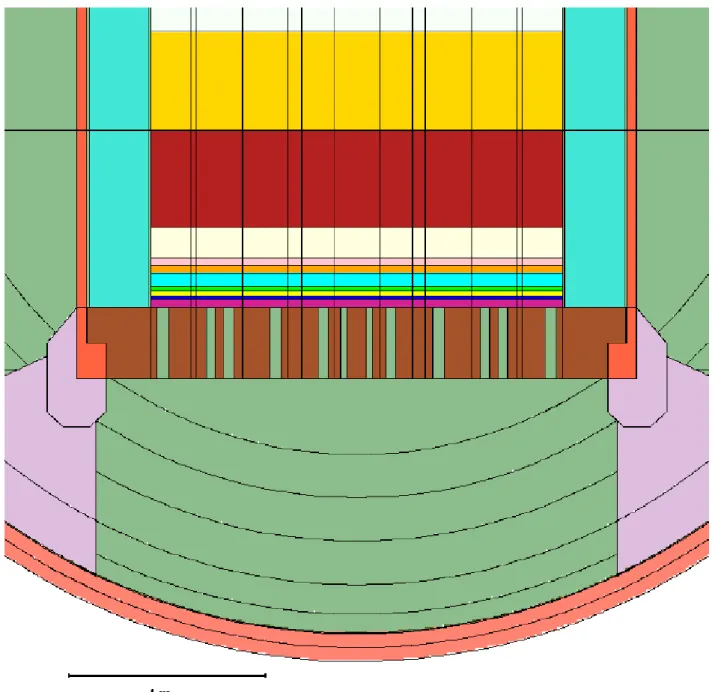
Fig. 7 shows the MCNP model of the region between the active core and the top plate and Fig. 8 shows the region between the active core and the bottom plate. Both Fig. 7 and Fig. 8 are for the core with Standard 17x17 fuel.
4.2.3 Bottom core plate
The position of the bottom core plate with respect to the lower surface of the active zone is defined by [35]. The dimensions are taken from [39]. The water channel lattice in [39] has been modeled explicitly. The water density is taken as 0.74264 g cm-3 - the temperature at the bottom of the active region [29]. The steel is taken as AISI-304L steel from [37] (7.85 g cm-3). There is assumed no structure within each water channel.
Fig. 9 shows a radial section of the MCNP model of the bottom core plate for the Standard fuel assemblies and Fig. 10 shows the same for the Enhanced Moderation fuel assemblies.
4.2.4 Top core plate
The position of the top core plate with respect to the upper surface of the active zone is defined by [35]. A drawing of the top plate was not available.
The thickness is apparently 76 mm [40]. {n.b. The quoted thickness of the bottom plate of the “Reactor Internals” is also 76 mm [41]. This plate is assumed by the author not to be the top plate of the core because the former rests on the thicker part of the reflector that follows the core’s radial cartesian shape [28], [42]. Instead the lower surface of the core top plate in the developed model is approximately 23.5 cm below the top surface of the thicker part of the reflector (using [21], [28], [35] and from [42] that the lower surface of the reflector rests on the upper surface of the core bottom plate).}
The outer surfaces of the top plate are assumed to be identical to the inner surfaces of the reflector.
The structure is assumed the same as the bottom plate, AISI-304L steel [37] (7.85 g cm-3). The water channels in the top plate were taken conservatively as 1 water channel of diameter 6.47 inch per fuel assembly, in the same lattice structure as the fuel assemblies [43]. The water density is taken as 0.65027 g cm-3 - the temperature at the top of the active region [29]. There is assumed no assembly structure within each water channel.
Fig. 11 shows a radial section of the MCNP model of the top core plate for the Standard fuel assemblies and Fig. 12 shows the same for the Enhanced Moderation fuel assemblies.
4.2.5 Region above the top plate and within the reflector and the barrel
The “Reactor Internals” [41] have not been modeled, neither is any structure present between the core top plate and the bottom plate of the “Reactor Internals”. All the region is filled with water at 0.65027 g cm-3 - the temperature at the top of the active region [29] (see for example Fig. 6).
4.2.6 Reflector
The reflector has been modeled faithfully as in [28] with a lower thicker part whose inner surface follows the core’s radial cartesian shape and an upper thinner part whose inner surface is cylindrical. From [42] the lower surface of the reflector rests on the upper surface of the core bottom plate. The reflector material is AISI-304L steel [37] (7.85 g cm-3).
The lower thicker part of the reflector (height 518.2 cm [28]) is modeled as a homogeneous mixture of 90% by vol. AISI-304L and 10% by vol. water (at 0.74264 g cm-3) to simulate the many small water tubes for cooling [44] (using data from [26], Table 2.5).
As discussed in §4.2.1, the inner radial dimensions of the reflector are defined in [28] for the Enhanced Moderation core assemblies. For the core with Standard Westinghouse 17x17 fuel assemblies, the inner radial dimensions were chosen so as to approximately maintain the fuel assembly-reflector water gap and are given in §4.2.1. See Figs. 3-8 and 11-12.
4.2.7 Barrel
The barrel is modeled as a simple cylinder with a thicker annular “foot” as in [45]. The bottom surface of the annular foot corresponds to the lower surface of the bottom core plate whilst the top surface of the annular foot corresponds to the point at which the outer radius of the bottom core plate changes [39], [42]. See for example Fig. 6.
The barrel material is AISI-304L steel [37] (7.85 g cm-3).
4.2.8 Radial interstitial water within barrel
The water channel between the core and the reflector of thickness 0.72-0.75 cm (for smeared outer core Standard assemblies) or thickness 0.92-0.95 cm (for pin-by-pin outer core Standard assemblies) is modeled explicitly with density 0.74264 g cm-3. For the Enhanced Moderation assemblies, the channel is of thickness 0.72-0.75 cm (for smeared outer core assemblies) or thickness 0.95-0.98 cm (for pin-by-pin outer core assemblies).
The water channel between the reflector and the barrel of thickness 1.5 cm and with density 0.74264 g cm-3 is also modeled explicitly.
The water channel between the upper part of the bottom core plate and the inner surface of the barrel is 5 mm thick whilst that between the lower part of the bottom core plate and the inner surface of the barrel is 2.5 mm thick. Both channels have water of density 0.74264 g cm-3.
4.2.9 Lower barrel annular support with its eight azimuthal supports
The data are given in [46]. The lower annular “foot” of the barrel fits into the annular support with coincident surfaces. The lower inner surface of the annular support is identical to the outer surface of the lower part of the bottom plate. Then some simplifications were made:
The angular surface near the top of the annular support which looks from [46] to be slightly curved (in the vertical section) was made conical. The point at which this surface meets the outer vertical surface of the annular support (diameter 315 cm) was estimated by eye from [46]. The rounded corners both on the inside and outside of the bottom of the annular support were approximated as conical surfaces. Fig. 13 shows an axial section of the MCNP model of the lower barrel annular support.
The “surge orifices” in the eight azimuthal supports were ignored. The inner radius of the azimuthal supports is not quoted. It was estimated by eye from [46] and for simplicity assumed cylindrical (around the core axis). The outer/upper surface of the azimuthal supports was assumed conical (around the core axis). Although the angle between the inner and outer/upper surfaces of each of the azimuthal supports is quoted (65°), the point at which the outer/upper surface intersects with the outer surface of the lower barrel annular support is not quoted. This was estimated by eye from [46].
From [42] we see that the azimuthal supports rest on the PV. Fig. 14 shows an axial section of the MCNP model of two of the eight azimuthal supports.
The material of both the lower barrel annular support and the eight azimuthal supports is AISI-304L steel [37] (7.85 g cm-3).
4.2.10 Bottom shield
For the reference calculation, the bottom shield was not modeled. The shield is in the
form of a spherical cap, intersecting the 8 azimuthal supports of the lower barrel annular support. It is shown in [42] and in [46] where it is quoted with thickness 15 cm. In [47] (left side) the position of the bottom shield (and of the lower part of the PV) is defined with respect to the lower surface of the lower annular “foot” of the barrel and therefore with respect to the core bottom plate. The upper limit of the bottom shield is not quoted, but is taken conservatively as the lower surface of the flange (at 176.52 cm below the focal centre point – see [46]). Fig. 15 shows an axial section of the MCNP model of the bottom shield.
The material of the bottom shield is AISI-304L steel [37] (7.85 g cm-3).
4.2.11 Between the core and the pressure vessel
Currently no other structure below the core, and no structure above the core or in the downcomer has been modeled. Water above the core and within the barrel (which is modeled to the top of the geometry) has the density: 0.65027 g cm-3 - the temperature at the top of the active region [29]. Water below the core and in the downcomer has the density: 0.74264 g cm-3 - the temperature at the bottom of the active region [29]. This may not be conservative, especially for the downcomer.
4.2.12 Pressure vessel liner and vessel
The vessel data is taken from [48]. The position of the vessel with respect to the core is given by [47] (left side). The point at which the thickness of the vessel changes from 28 cm to 14 cm was taken as the point {quoted in [47] (left side)} where the thickness begins to reduce from 28 cm (see Fig. 16). This is therefore conservative (for responses outside the vessel in this direction).
The vessel liner is 5 mm thick [49]. The material of the vessel liner is taken as AISI-304L steel [37] (7.85 g cm-3).
The material composition of the pressure vessel is taken from [50], density 7.833 g cm-3 [51].
Note there is no vessel support skirt below the vessel [42], [48].
4.2.13 Concrete liner and concrete outside the PV
The steel liner of the concrete was taken as 2 cm thick (identical to the value for the previous PoliMi calculations [52]) and as steel type, AISI-304L [37] (7.85 g cm-3).
The inner radius of the cylindrical part of the concrete was taken as 4 m [53]. From section A-A of [54] the thickness of the surrounding concrete was estimated as 1 m (both in the radial cylindrical part and in the bottom well).
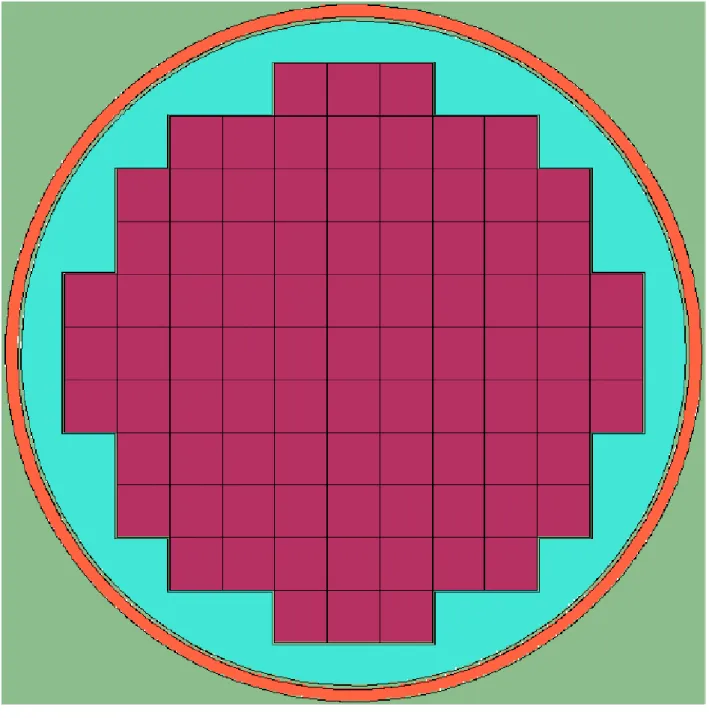
The position of the PV with respect to the concrete well (and therefore also with respect to the centre of the 22.5 m diameter containment vessel) was established from [53] and [48]. [The common point is the plane of support of the vessel skirt (although the skirt is not currently modeled)]. Fig. 17 shows the concrete surrounding the PV (section through the azimuthal supports of the bottom plate annular support).
The concrete composition (Portland) was taken from [55], density 2.3 g cm-3 from [56] (composition also suggested by PoliMi [57]). The presence of reinforcement rods (“rebar”) was neglected. This is not conservative for the PV responses. However the effect should be very small.
5. RESULTS FOR PRESSURE VESSEL DAMAGE
The scheme of the various geometrical and source models is shown in Fig. 18. Most calculations were made with all the assemblies, including the 40 outer assemblies, smeared because of issues concerning the local computing environment (these calculations were made with MCNP5 with MPI under AIX whilst the reference calculation with the 40 outer assemblies pin-by-pin was made with MCNPX2.6.d with MPICH under LINUX). [In Fig. 18 actually the first calculation was that in the bottom left corner (Enhanced Moderation fuel assemblies; thinner reflector; including bottom shield; 235U fission spectrum; 40 outer assemblies smeared), then we worked our way up the diagram, with some variations left and right until we arrived at the reference calculation at the top.]
As far as the coupled neutron-gamma calculations are concerned, because of the threshold on the dpa cross-section [16] a gamma energy cut-off of 700 keV was employed in all the vessel damage runs.
Results will be presented in detail only for the reference calculation. Then results for the other calculations will be summarised as variations with respect to the results of the reference calculation.
n.b. The gamma dpa calculations initially employed an erroneous interpretation of the response function defined in [16] which led to an underestimate of the total gamma dpa results (by a factor of between 1.15 and 1.2). The results presented for the reference calculation in Figs. 40 – 46 in §5.1 have been corrected (actually the ratios in Figs. 41 and 42 did not change). All the other gamma dpa results (in Fig. 47, case “A” in §5.2, case “B” in §5.3, case “C” in §5.4, case “D” in §5.5 and case “F” in §5.7) employed the initial, erroneous interpretation of the gamma dpa response function. However none of these results are absolute values but instead are all differences or ratios. In this case we estimate that the error involved through the use of the erroneous response function is negligible.
5.1 Reference calculation (Case “R”)
The results for the neutron fluences are shown in Figs. 19 – 25, for the neutron dpa’s in Figs. 26 – 32, for the gamma fluences in Figs. 33 – 39 and for the gamma dpa’s in Figs. 40 – 46.
(Note that although the illustration in each figure is for the all-homogeneous assembly case, the reference case is with the 40 outer assemblies pin-by-pin).
5.1.1 Contributions from different parts of the fission spectrum
Fig. 47 shows the contribution to the neutron and gamma dpa results on the cylindrical and spherical segments of the pressure vessel inner surface shown in Fig. 27 as a function of the energy of the fission neutrons. Shown also is the 235U fission spectrum.
Discussion
As expected, the high energy (low probability) tail of the fission spectrum provides all the contributions to the neutron dpa, with the maximum contribution probability around 10 MeV for the dpa to the cylindrical part of the vessel and slightly less for the dpa to the spherical part of the vessel. Instead the part of the fission spectrum responsible for gamma dpa to the vessel is at a much lower energy (maximum around 2 MeV) as the gamma’s are born in the reflector and the barrel.
As a consequence although uncertainties in the fission spectrum or in the fissioning nuclide (see Fig. 1) should not lead to uncertainties in the gamma-induced dpa or damage, such uncertainties do have an impact on the uncertainty of the neutron-induced dpa or damage. (However in §5.3 it is noted that the neutron-induced dpa below the azimuthal struts is unchanged in going from a 235U fission spectrum to a 241Pu one.)
Taking into account Figs. 1 and 47, it was decided to include a “Spectral Safety Factor” of 1.3 on the neutron-induced damage results outside the azimuthal struts for the UO2 core and 1.5
for a 100% MOX core [58]. (These factors are not included in the results in Figs. 19 – 32). These factors are checked in §5.3 where results obtained using a 241Pu fission spectrum are compared with those from a 235U fission spectrum.
Note that the Spectral Safety Factors are intended to take into account the fact that in both the UO2 and the MOX cores there are four possible fissioning nuclides: 235U, 238U, 239Pu and 241
Pu (in different proportions) whilst only one, 235U, is actually modeled. They are also intended to take into account the fact that we are using an analytic spectrum that is an approximation for the actual fission spectrum of 235U.
5.2 Smearing the 40 outer assemblies (both source and geometry) (Case “A”)
The variations in the vessel responses in going from case “R” to case “A” are summarised as follows:
– The neutron fluences and neutron-induced dpa’s increase by a factor of between 1.16 and 1.18 at all energies on both the cylindrical and the spherical parts (above the azimuthal struts) of the PV.
– Instead on the segment of the PV underneath the azimuthal struts, there is a greater variation in both the neutron fluence and neutron-induced dpa, depending on the energy. This increase is by a factor of 1.12 above 1 MeV, this factor rising to around 1.25 both above 100 keV and for the total.
– The gamma fluences and gamma-induced dpa’s increase by a factor of 1.23 at all energies on the cylindrical part and by a factor of between 1.25 and 1.26 at all energies on the spherical part (above the azimuthal struts).
5.2.1 The neutron flux leaking from the pressure vessel (for purposes of
comparison)
For comparison purposes with other plant designs, it is of interest to report the flux leaking from the pressure vessel around the core mid-plane. Note that this is not the maximum flux leaking from the vessel because a) as already shown, the flux impinging on the spherical part of the vessel is higher than that on the cylindrical part around the core mid-plane and b) the spherical part of the vessel is 14 cm thick, half the thickness of the part around the core mid-plane. However as we see from Fig. 17, leaking neutrons from the spherical part of the pressure vessel are much less important for responses above the core within or outside the containment vessel compared with leaking neutrons from the cylindrical part of the pressure vessel. The fluxes are tallied over the same segment as that shown in Fig. 20 (and over 360° as in Fig. 20) but on the outer surface of the 28 cm thick cylindrical vessel.
n (n cm-2 s-1)
> 1 MeV 4.9E+2
>100 keV 5.2E+3
total 1.2E+4
Note these values must be adjusted downwards by a factor of around 1.17 to provide reference values as discussed in the first paragraph of §5.2.
5.2.2 Further examination of neutron fluence and neutron-induced dpa underneath
the azimuthal struts
As the neutron-induced dpa on the PV underneath the azimuthal struts is comparable to the maximum value on the spherical part of the PV just above the azimuthal struts (for the reference case 1.30E-7 and 1.04E-7 respectively and for case “A” 1.61E-7 and 1.22E-7 respectively although the value above the struts is averaged over 360°), it is of interest to sub-divide the segment underneath the struts.
Referring to Figs. 23 or 30, we imagine subdividing the intersection of the strut with the PV as illustrated in the lower left corner into 5 roughly equal segments, in moving towards the bottom of the spherical part of the PV, while leaving the other dimension as illustrated in the top right corner of the figure unsegmented. This produces the following variations (down the page represents moving towards the bottom of the spherical part of the PV) with respect to the mean value over the whole strut intersection with the PV:
n (> 100 keV) DPA (tot)
0.53 0.71
1.34 1.28
1.76 1.63
1.12 1.07
0.39 0.51
[Note that the strut at 22.5° to the horizontal (E-W), rather than the one at 67.5° to the horizontal actually has slightly higher flux and dpa values (presumably due to the different source assembly powers). The results presented in Figs. 23 and 30 are for the struts at 67.5° to the horizontal as shown. The results in the above table include the additional factor for the strut at 22.5° to the horizontal, which is around 1.08 for both the flux above 100 keV and total dpa.]
Thus we note that there is an appreciable variation under each strut, that, with a finer segmentation, we may hypothesize gives a factor of 2.5 times the neutron-induced dpa as a maximum value under the strut at 22.5° to E-W compared with the average value under the strut at 67.5° to E-W. Note that this estimate of 2.5 is not necessarily conservative as we have not investigated the variation in the responses in the other dimension (over the 20 cm thickness [46] of the strut). This will be borne in mind.
5.2.3 Comparison of neutron-induced dpa using BISERM and JEFF-3.1 data
The comparison of the dpa results was first made for the cylindrical segment of the vessel inner surface shown in Fig. 27 (note the results in Fig. 27 are for the reference case whilst the results here are for case A):
DPA (> 1 MeV) DPA (> 100 keV) DPA (tot)
BISERM data: 3.3E-8 3.8E-8 3.8E-8
JEFF-3.1 data: 3.1E-8 3.6E-8 3.7E-8
The same comparison was made for the spherical segment of the vessel inner surface shown in Fig. 27:
DPA (> 1 MeV) DPA (> 100 keV) DPA (tot)
BISERM data: 1.0E-7 1.2E-7 1.2E-7
JEFF-3.1 data: 9.8E-8 1.1E-7 1.2E-7
and for the segment of the vessel inner surface under the azimuthal struts shown in Fig. 30: DPA (> 1 MeV) DPA (> 100 keV) DPA (tot)
BISERM data: 1.5E-8 1.1E-7 1.4E-7
JEFF-3.1 data: 1.5E-8 1.1E-7 1.4E-7
The BISERM results differ from those shown in Figs. 27 and 30 by the correction factors given in the first paragraph of §5.2 for going from the reference case to case “A”. We see a good agreement between the BISERM results and the JEFF-3.1 results both in the harder neutron spectrum on the cylindrical and spherical segments and in the softer neutron spectrum under the azimuthal struts. The results for the finer subdivision of the segments of the pressure vessel under the azimuthal struts (and including the factor for the strut at 22.5° to the horizontal), presented in §5.2.2 for the BISERM data, are shown below for both sets of data:
DPA (tot) (BISERM data) DPA (tot) (JEFF-3.1 data)
0.71 0.71
1.28 1.26
1.63 1.59
1.07 1.07
0.51 0.50
Thus the variation of the response under the azimuthal struts in one of the dimensions (and including the different struts), is confirmed.
5.3 Employing a
241Pu fission spectrum (case “B”)
Compared with case “A”:
– The neutron fluences and neutron-induced dpa’s on the cylindrical part of the pressure vessel are higher by a factor between 1.52 and 1.63 (dpa’s nearer the higher value, fluences nearer the lower value). Instead on the spherical part of the pressure vessel the factor is lower, between 1.37 and 1.48 with again the dpa’s nearer the higher value and fluences nearer the lower value.
– The situation is different underneath the azimuthal struts. Here both the neutron fluence and neutron-induced dpa’s above 1 MeV are raised by a factor of 1.43. Instead the neutron fluence and neutron-induced dpa’s above 100 keV as well as the total fluence and total dpa are virtually unchanged. (We remind ourselves that underneath the azimuthal struts the dpa from neutrons > 1 MeV accounts for about 15% of the total neutron-induced dpa.) Thus as a consequence the maximum value of the total neutron-induced dpa, which in Cases “R” and “A” looked comparable underneath the azimuthal struts and just above the azimuthal struts on the spherical part of the PV, is in this case at the latter point.
– The gamma fluences and gamma-induced dpa’s at the pressure vessel are unchanged.
Discussion
The higher results obtained with the 241Pu fission spectrum are consistent with the Spectral Safety Factors of §5.1.1.
5.4 Reducing the reflector thickness (case “C”)
The geometry as shown in Fig. 3 is modified by reducing the thickness of the reflector to that shown in Fig. 4 whilst however maintaining the core size shown in Fig. 3 (i.e. retaining the Standard fuel assemblies). The wider gap between the outer fuel assemblies and the reflector is filled with water previously in the narrow gap.
It should also be mentioned that the density of the water outside the active zone was slightly lower than in case “A” due to a mistake, subsequently corrected in cases “A”, “B” and “R”. The difference in results should however mainly be due to the different reflector thickness.
Compared with case “A”:
– The neutron fluences and neutron-induced dpa’s on the cylindrical part of the pressure vessel are higher by a factor of 2.22. On the spherical part of the pressure vessel the factor is slightly higher, around 2.29.
– The situation is again different underneath the azimuthal struts. Here both the neutron fluence and neutron-induced dpa’s above 1 MeV are raised by a factor of about 1.75. Instead the neutron fluence and neutron-induced dpa’s above 100 keV as well as the total fluence and dpa are lower, the fluences by a factor of around 0.75 and the dpa’s by a factor of around 0.90. As in case “B”, the maximum value of the total neutron-induced dpa, which in cases “R” and “A” looked comparable underneath the azimuthal struts and just above the azimuthal struts on the spherical part of the PV, is at the latter point.
– The gamma fluences above 4 MeV and above 8 MeV and the gamma-induced dpa’s at all energies reduce by a factor of around 0.75 on both the cylindrical and spherical parts (above the azimuthal struts). (This factor is around 0.80 for the total gamma fluence.)
5.5 Changing from the Standard to the Enhanced Moderation assemblies (case
“D”)
The geometry is now that shown in Fig. 4. Compared with case “C”:
– The neutron fluences and neutron-induced dpa’s on the cylindrical part of the pressure vessel are higher by a factor of between 1.55 and 1.60. On the spherical part of the pressure vessel the factor is slightly lower, between 1.45 and 1.50.
– Underneath the azimuthal struts the neutron fluence and neutron-induced dpa’s above 1 MeV are higher by a factor of about 1.33. Instead the neutron fluence and neutron-induced dpa’s above 100 keV as well as the total fluence and dpa are higher by a factor of about 1.40. As in cases “B” and “C”, the maximum value of the total neutron-induced dpa, which in cases “R” and “A” looked comparable underneath the azimuthal struts and just above the azimuthal struts on the spherical part of the PV, is at the latter point.
– The gamma fluences and the gamma-induced dpa’s at all energies increase by a factor between 2.10 and 2.15.
5.5.1 The neutron flux leaking from the pressure vessel (for purposes of
comparison)
In an analogous fashion to what was done for case “A” in §5.2.1, for comparison purposes with other plant designs, it is of interest to report the flux leaking from the pressure vessel around the core mid-plane. The fluxes are tallied over the same segment as that shown in Fig. 20 (and over 360° as in Fig. 20) but on the outer surface of the 28 cm thick cylindrical vessel.
n (n cm-2 s-1)
> 1 MeV 1.8E+3
>100 keV 1.8E+4
total 4.7E+4
If we adjust these values by the factor: 11.575 (§5.5) to go from case “D” back to case “C” and successively by the factor 12.22 (§5.4) to go from case “C” back to case “A”, we obtain consistent leakage flux values to those cited in §5.2.1. The factor of 1.17, mentioned in §5.2.1, to adjust these values downwards to provide reference values is assumed to be approximately valid for the model of case “D”.
5.6 Changing from the Standard to the Enhanced Moderation assemblies,
simultaneously reducing the reflector thickness
This is equivalent to going from case “A” to case “D”. The appropriate factors can be extracted as accumulative (multiplicative) values from the factors given in §5.4 and §5.5.
5.7 Adding a bottom shield (case “F”)
The geometry is shown in Fig. 15 and is described in §4.2.10. Compared with case “D”: – The neutron and gamma fluences and neutron and gamma-induced dpa’s on the cylindrical part of the pressure vessel are of course unchanged. The results on the spherical part of the vessel not directly underneath the shield are also unchanged. (That is, considering for example Fig. 26 and comparing with Fig. 15, the results in the upper four segments of the spherical part of the vessel.)
– On the spherical part of the pressure vessel underneath the shield, the neutron fluence above 1 MeV is reduced by a factor of 0.56 in the segment that is partially occluded by the shield. This factor then reduces to 0.24 at the bottom of the vessel. Instead the neutron fluence above 100 keV has higher factors: 0.64 reducing to 0.37 at the bottom of the vessel, but with a rise to 0.92 in the annular segment that includes the struts. This trend is accentuated for the total flux with a factor of 0.82 reducing to 0.71 at the bottom of the vessel, but now with a factor of 1.33 in the annular segment that includes the struts. Underneath the struts, the factor is 0.50 for the fluence above 1 MeV, 1.20 for the fluence above 100 keV and 1.36 for the total fluence, whilst between the struts these factors are 0.34, 0.65 and 1.20 respectively.
– On the spherical part of the pressure vessel underneath the shield, the neutron-induced dpa above 1 MeV is reduced by a factor of 0.54 in the segment that is partially occluded by the shield. This factor then reduces to 0.21 at the bottom of the vessel. For the neutron-induced dpa above 100 keV, the same factors are 0.57 and 0.25 respectively and for the total neutron-induced dpa they are 0.58 and 0.25 respectively. Underneath the struts, the factor is 0.41 for the neutron-induced dpa above 1 MeV, 1.04 for the neutron-neutron-induced dpa above 100 keV and 1.10 for the total neutron-induced dpa, whilst between the struts these factors are 0.32, 0.40 and 0.43 respectively.
– The gamma fluences and the gamma-induced dpa’s at all energies decrease by a factor of around 0.4 in the segment that is partially occluded by the shield. This factor then reduces to below 0.05 in all other segments that are underneath the shield.
Discussion
In the cases with the thinner reflector (“C”, “D”, “E”, “F”), the maximum neutron-induced damage to the vessel is at a point that is unaffected by the presence of the shield. In the cases with the thicker reflector (“A”, “B”, “R”), the neutron-induced damage is comparable underneath the struts and just above the struts. Just above the struts, the shield makes no difference. Underneath the struts, the shield actually increases the total neutron-induced dpa by 10%. Such an effect may be accentuated with a thicker reflector.
The maximum gamma-induced damage to the vessel is on the cylindrical part of the vessel where the shield has no effect.
5.8 Addressing the spatial distribution of the fission source (case “E”)
It was of interest to examine the model of a homogeneous spatial fission source in the active zone (similar to that used in the previous analysis [59], where however only the outer 15-17 cm thick stratum was considered with an assumed 1/2 of the average specific core power). Instead here a source throughout the active zone, including the upper and lower blankets was
considered. (Although we concur that the inner assemblies give a negligible contribution to the leakage contributon flux from the core.)
A homogeneous source with a specific power equal to the average specific core power always overestimates the vessel damage responses presented here: PV fluences and dpa’s.
A homogeneous source with a specific power equal to half the average specific core power underestimates on the cylindrical part and overestimates on the spherical part of the vessel the vessel damage responses presented here: PV fluences and dpa’s. The overestimates can reach a factor of 2, although they are generally around 1.5.
This only concerns neutron responses: neutron fluences and neutron-induced dpa’s. The verification has not been made for the gamma responses.
5.9 Calculated upper limits and damage limits
The upper limit for the fast neutron fluence (> 1 MeV) over the PV lifetime required for licensing is 2E+19 n cm-2 [60], [61] and for a surveillance programme is 1E+17 n cm-2 [60], [61], [62]. There are approximately three orders of magnitude between the calculated result in §5.1 for the maximum fast neutron fluence in 60 years functioning at 100% power and the latter limit. However as we have seen the maximum neutron-induced dpa at the PV is not necessarily where the fast neutron fluence (> 1 MeV) is a maximum. Furthermore the maximum gamma-induced dpa at the PV is around two orders of magnitude greater than the maximum neutron-induced dpa (see §5.1).
5.9.1 Reference case
The maximum result of 6.8E+13 n cm-2 in Fig. 19 for the fast neutron fluence (> 1 MeV) over the PV lifetime of 60 years has been averaged over the circumference of the spherical part of the PV. This should be multiplied by 1.21 from Fig. 22 to account for the maximum around the azimuth, giving 8.2E+13 n cm-2. This should be further multiplied by the “Spectral Safety Factor” (§5.1.1) to give 1.1E+14 n cm-2 for a UO2 core and 1.2E+14 n cm-2 for a 100% MOX core,
factors of approximately 900 and 850 respectively below the surveillance limit.
In terms of total neutron-induced dpa, the maximum result of 1.0E-7 on the spherical part of the PV in Fig. 26 (at exactly the same location as the fast neutron fluence of 6.8E+13 n cm-2) over the PV lifetime of 60 years has been averaged over the circumference. This should be multiplied by 1.20 from Fig. 29 to account for the maximum around the azimuth, giving 1.2E-7. This should be further multiplied by the “Spectral Safety Factor” (§5.1.1) to give 1.6E-7 for a UO2 core and 1.8E-7 for a 100% MOX core (where the total neutron-induced dpa results of
1.6E-7 and 1.8E-1.6E-7 are at exactly the same location as the above fast neutron fluences of 1.1E+14 n cm
-2
and 1.2E+14 n cm-2).
Instead, the total neutron dpa result averaged under the azimuthal struts of 1.3E-7 in Fig. 30 should be multiplied by the factor 2.5 to account for the difference between the strut at 22.5° to (E-W) and the one at 67.5° and to account for the maximum value in the middle of the strut (see §5.2.2). (This assumes the transferability of the results in §5.2.2 for case “A” to the reference case.) This gives 3.3E-7, substantially higher than the value outside the struts (and we remember that the factor 2.5 is not necessarily a conservative estimate).