UNIVERSITÀ DEGLI STUDI DI ROMA
“SAPIENZA”
P
H
D
S
CHOOL IN
I
MMUNOLOGICAL
,
H
AEMATOLOGICAL AND
R
HEUMATOLOGICAL
S
CIENCES
AND
INNOVATION IN IMMUNO
-
MEDIATED AND HEMATOLOGICAL DISORDERS
XXXII
CYCLE
Innovative 3D model for the establishment of primary
paediatric brain tumour cultures: new platform for the
preclinical study of immunotherapeutic approaches
Coordinator:
Prof.ssa Angela Santoni
Supervisor:
Candidate:
Dr.ssa Del Bufalo Francesca
Belardinilli Tamascia
ABSTRACT
Gliomas, encompassing Low Grade (LGGs) and High Grade (HGGs) diseases are, overall, the most common solid tumors of the pediatric population. Children affected by LGGs that cannot be cured often struggle to obtain a complete remission of the disease, suffering from significant long-term sequelae. HGGs are instead associated with very grim outcomes and no innovative treatment so far has been able to change this poor prognosis. New treatment approaches, such as immunotherapy, are therefore needed for these patients. Gliomas, as all solid tumors, are characterized by a high structural complexity and a strongly immunosuppressive microenvironment, both responsible for the frequent failure of immunotherapeutic approaches. Such complexity is difficult to reproduce with common bidimensional (2D) systems, making the conventional tumor models unable to predict the real efficacy of these treatments. In order to overcome such hurdles and obtain more reliable tumor models, we developed an innovative fibrin-based hydrogel 3D model and tested it as platform to establish primary cultures of pediatric LGGs and HGGs. In particular, LGGs are otherwise extremely difficult to maintain in culture owing to the well-known activation of senescence pathways. To date, 37 samples of LGG were cultured in both 2D and 3D platforms, showing that the 3D-culture enables the stabilization of LGG. Cell lines identity was confirmed by short tandem repeats (STRs) and the immunohistochemical characterization (structure, H&E, Ki67, tumor and differentiation markers) in 3D cultures revealed phenotype and cellular organization closer to those observed in the onset sample, as compared to 2D. The 3D-cultured tumor cells showed a significantly (p =0,008) lower
cultured and established as well. We therefore evaluated the antitumor activity of an innovative immunotherapeutic approach based on the use of γδ-T cells. These cells display properties of both the innate and the adaptive compartment, have a powerful cytotoxic activity, are able to recognize antigens independently from the HLA and display a negligible alloreactivity, resulting extremely attractive for clinical translation in particular for the establishment of an allogeneic “third-party T-cell bank” for ready for use off-the-shelf adoptive T-cell product. The clinical exploitation is limited, however, by the low percentage of circulating γδ-T cells and the lack, to date, of effective culture systems to expand them.We have developed a protocol to expand a clinically relevant number of polyclonal memory γδ-T cells. Artificial antigen presenting cells (aAPC) expressing CD86/4-1BBL/CD40L and cytomegalovirus-pp65 antigen were used to induce γδ-T cell expansion and activation. For increase the safety of our approach aAPCs has been further stable gene-modified with a suicide gene, inducible caspase 9, and then single cell cloned. The γδ-T cells expanded and expressed markers of activation and memory, maintaining a polyclonal phenotype (with a predominantly Vδ1 well known memory infiltrating population), negligible alloreactivity and potent antitumor capacity versus a broad range of malignancies.Lastly, we characterized the antitumor activity of expanded γδ-T cells, as well as of more conventional approaches (such as radiotherapy and chemotherapy), in 2D and in 3D-cultured tumors, showing that the first are significantly more sensitive to treatment. Expanded γδ-T cells showed a relevant antitumor activity in both 2D and 3D, the latter requiring longer cultures to obtain an antitumor control. These data suggest a more realistic estimation of the efficacy of such treatment by the 3D-platform, confirming it as a better model for biological and therapeutic studies.
TABLE OF CONTEST
ABSTRACT ... 3 List of abbreviations ... 8 Legend of figures ... 9 Legend of table ... 10 INTRODUCTION ... 11 1.1 Brain Tumors ... 111.1. Treatment of Low-Grade Gliomas ... 14
1.2. Immunotherapy: a new frontier for cancer treatment ... 15
1.3. Universal adoptive T cell therapy approach: γδ-T cells ... 15
1.4. Cell culture models ... 19
1.5. 2D Culture ... 21
1.6. 3D Culture ... 22
1.7.3D model as a platform for preclinical studies ... 23
AIMS OF THE PRESENT STUDY ... 25
MATERIALS AND METHODS ... 26
2.1. Patients and generation of 2D and 3D primary Low-Grade Glioma lines. ... 26
2.2. Cell lines ... 26
2.3. Vector design and transient transfection. ... 27
2.4. Preparation of PEG-fibrin hydrogel components and cell retrieval ... 27
2.5. Immunofluorescence staining ... 28
2.6. Immunohistochemistry staining ... 30
2.8. Phenotypic analysis ... 30
2.9. Cytokine profile ... 31
2.10. Ex-vivo isolation and expansion of polyclonal αβ- and γδ-T cells ... 31
2.11. Co-culture assay ... 32
2.12. Senescence associated Galactosidase (SA-β-gal) Activity Assay ... 32
2.13. Cell Proliferation and MTT Assay ... 33
2.14. Irradiation of immortalized and primary 2D and 3D cultures ... 33
2.15. Treatment of immortalized and primary 2D and 3D cultures with vincristine ... 34
2.16. Statistical Analysis ... 34
RESULTS ... 35
3.1. Sophisticated qualitative and quantitative monitoring of glioma tumor growth with the 3D hydrogel platform. ... 35
3.2. The 3D platform allows the establishment of primary cell lines of LGGs displaying more complex structures and more regular growth rate, as compared to conventional 2D cultures. ... 37
3.3. Primary LGG lines show morphology, structural organization and histopathology closely resembling the tumor of origin in the 3D organoids. ... 41
3.4. Differently from the conventional 2D cultures, 3D-cultured LGGs cell lines have a lower rate of activation of senescence. ... 44
3.5. The 3D-cultured LGG cell lines display a kinetic of response to conventional treatment that more closely predicts the clinical response than the 2D cell lines ... 47
3.6. Development and validation of a universal ready-to-use immunotherapeutic approach for the treatment of cancer based on the expanded and activated polyclonal γδ memory T cells. ... 49
3.7. Potent ex vivo γδ-T-cell expansion is driven by the combination of CD86/41BBL with CD40L and pp65 CMV costimulation. ... 50
3.8. CD40L/pp65 and pp65 aAPCs induce the expansion of polyclonal γδ-T cells with
predominant Vδ1 phenotype. ... 54
3.9. CD40L/pp65 costimulation of γδ-T cells maintains the memory phenotype without inducing overexpression of exhaustion markers. ... 56
3.10. Expanded γδ-T cells can penetrate into the hydrogel and reach the tumor organoids. ... 57
DISCUSSION ... 60
Work limitation ... 65
List of abbreviations
LGG: Low Grade Glioma; HGG: High grade Glioma; IDH: Isocitrate dehydrogenase;TPCV: Thioguanine, Procarbazine, Lomustine, and Vincristine; NK: Natural Killer;
TCR: T-Cell Receptor;
MHC: Major Histocompatibility Complex;
ADCC: AntibodyDependent Cellular Cytotoxicity; HSCT: Hematopoietic stem cell transplantation; HLA: Human Leucocyte Antigen;
PB: Peripheral Blood;
aAPC: Artificial Antigen-Presenting Cell; CMV: Cytomegalovirus;
PBS: Phosphate-Buffer Saline; FBS: Fetal Bovine Serum;
GFP: Green Fluorescence Protein; FFLuc: FireFly-Luciferase;
BSA: Bovine Serum Albumine, iC9: Inducible Caspase 9;
PBMC: Peripheral blood mononuclear cells; BC: Buffi Coats;
HD: Healthy donors;
Legend of figures
Figure 1: Schematic representation of normal glial cells Figure 2: Classification of gliomas in types and WHO grades.
Figure 3.: Spatiotemporal association of mutations in pediatric high-grade glioma.
Figure 4: Different cell organization in 2D and 3D cultures.
Figure 5: Correlation between bioluminescence signal and number of cells in the Hydrogel.
Figure 6: Confocal microscope images of 3D cultures of U87
Figure 7: Generation and expansion of primary cultures from pediatric brain tumors.
Figure 8: Difference of tumour engraftment rate in 3D and 2D culture.
Figure 9: Characterization by IHC and IF of 2D and 3D cultures derived from samples of LGGs.
Figure 10: Evaluation of senescence level in 2D and 3D cultured cells. Figure 11: expression of p53, p16 and ki-67 in primary LGG cultures.
Figure 12: Evaluation of the response of 2D and 3D cultures to conventional treatments.
Figure 13: Schematic representation of the viral vectors used in the study. Figure 14: Purity on γδ-T cells recovery after selection from healthy donors. Figure 15: Fold expansion of γδ-T cells from healthy donors after stimulation with aAPCs.
Figure 16: Identity of the expanded γδ-T cell products.
Figure 17: Phenotype of freshly isolated and expanded γδ-T cells stimulated with aAPCs/pp65 and CD40L/pp65.
Figure 18: Phenotype of expanded γδ-T cells.
Figure 19: Anti-tumour activity of expanded αβ-T and γδ-T cells in long-term in vitro assays in 2D and 3D models.
Legend of table
Table 1: Comparison of 2D and 3D cell culture methods.
Table 2: Details of the histology of the LGGs and HGGs samples cultured in 2D and 3D platforms.
Table 3: Results of STR evaluation of the sample of one representative patient and of the relative 2D and 3D cultures.
INTRODUCTION
1.1 Brain Tumors
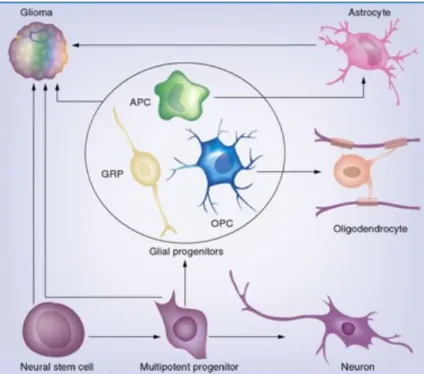
Central nervous system tumors are the most common solid tumors of childhood, and gliomas comprise the majority of central nervous system tumors. The term glioma describes central nervous system tumors that arise from glial cells, in either the brain or the spine (Figure 1). As with most central nervous system tumors, gliomas were first described and classified by Harvey Cushing and Percival Bailey in the first few decades of the 20th
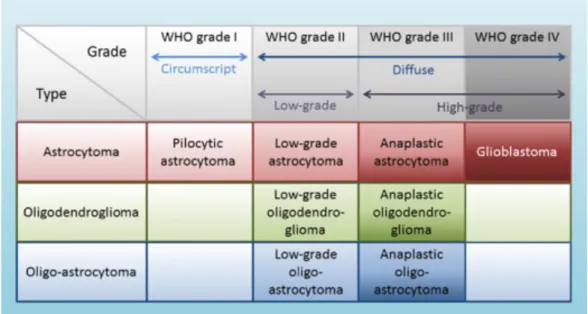
century. The clinical presentation of childhood gliomas is extremely heterogeneous and is highly dependent on the localization of the lesion. This heterogeneous group of tumors has been classified and graded by the World Health Organization based on their histological and molecular features (Figure 2).
Figure 1: Schematic representation of normal glial cells from which gliomas derived. Modified from The Cellular Origin for Malignant Glioma and Prospects for Clinical
Figure 2: Classification of gliomas in types and WHO grades. Modified fromTaal W.r & Bromberg JEC & Bent M. (2015). Chemotherapy in glioma. CNS oncology. 4. 1-14. DOI:10.2217/cns.15.2.
As shown in figure 2, it includes astrocytomas, which are graded low grade gliomas (LGGs) (grades I and II astrocytomas) and high-grade gliomas
(HGGs), such as anaplastic astrocytomas (grade III) and glioblastomas
(grade IV) [1-2]. Today, gliomas of all grades account for up to 50% of pediatric central nervous system tumors [3]. Pediatric LGG constitute almost 40% of pediatric brain tumors and are composed mainly of WHO grade I pilocytic astrocytoma, which accounts for 20% of brain tumors in patients under the age of 20 years, alone. The morphological features of pilocytic astrocytomas are distinctive and characterized by extensive vascular proliferation, biphasic architecture, Rosenthal fibers, eosinophilic granular bodies, and occasionally, regions of limited calcification. Gangliogliomas are another LGG (grade I) of mixed neuronal-glial subtype, also characterized by granular bodies and regions of calcification, and also exhibit binucleated neurons and cystic degeneration. Other LGG of childhood include subependymal giant-cell astrocytoma (WHO grade I), fibrillary/diffuse astrocytoma (grade II), pilomyxoid astrocytoma (grade II),
and oligoastrocytomas (grade II). In recent years, advances in genomics and molecular diagnostics have revolutionized the classification of pediatric gliomas. Indeed, one effect of this has been to shift the focus away solely from a purely morphological classification to a more molecular based stratification, which not only provides a more robust risk stratification, but also offers the possibility of new and novel targets for therapy [2]. Low-grade gliomas typically have a protracted clinical course while high-Low-grade tumors usually have a more acute presentation with rapid progression of symptoms. The number of genetic alterations commonly found in pediatric LGG is fairly limited and in the case of pilocytic astrocytomas is predominantly a 1-pathway disease. Indeed, the majority of pilocytic astrocytomas harbor lesions in the MAPK pathway [4]. In addition, mutations in the tumor suppressor gene TP53 [5], metabolic genes, IDH1 and IDH2 [6] and point mutations or gene fusion in in BRAFV600E [7] are also
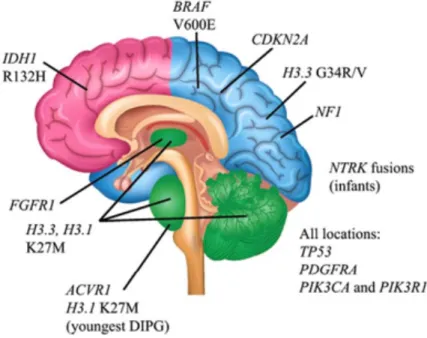
common in adult LGG but exceedingly rare in childhood LGG [8-9]. However other mutations have been described in gliomas and a representative schema of these are shown in figure 3.
Figure 3.: Spatiotemporal association of mutations in pediatric high-grade glioma. Modified from Pediatric gliomas as neurodevelopmental disorders Suzanne J. Baker, David W.Ellison, David H. Gutmann.06 december 2015.Glia.
1.1. Treatment of Low-Grade Gliomas
Patients with low-grade gliomas are primarily treated by surgical resection of the tumor. Patients with complete tumor resection typically do not require any adjuvant therapy. However, complete tumor resection can be challenging or impossible, and is highly dependent on the location of the tumor. Consequently, surgical management of low-grade gliomas patients is aimed at maximal safe surgical resection [10-11]. In the case of recurrence, additional therapeutic approaches, such as radiation therapy and chemotherapy, can be utilized. Three adjuvant therapies are currently available for progressive and unresectable low-grade gliomas; external beam irradiation, conventional chemotherapy and targeted therapies. There are several first line approaches for conventional chemotherapy for LGGs
including carboplatin and vincristine, TPCV (thioguanine, procarbazine, lomustine, and vincristine) and weekly vinblastine monotherapy [12-13]. All these approaches are well tolerated have been shown to stabilize disease progression in up to 50% of patients. However, in many instances, treatment needs to be repeated 2 or 3 times prior to complete disease stabilization. External beam irradiation in low-grade gliomas, although effective is reserved for older children and for cases where chemotherapy options have been exhausted. The majority of children with low-grade gliomas survive long-term and as such, the side effects of radiation therapy particularly cognitive side effects, vasculopathies and hormonal imbalances outweigh its benefits. It would be important to identify new therapeutic approaches, such as immunotherapy or target therapy, especially for those LGGs that require adjuvant therapies, and also because, as mentioned above, often the therapies can have severe side effects.
1.2. Immunotherapy: a new frontier for cancer
treatment
The principal biological role of the immune system is to maintain the integrity of “self”. This integrity is maintained principally by eliminating and destroying diseased and infected cells, while ensuring that healthy cells and tissues are not targeted. Several evidences exist to document that the immune system plays a role in controlling the growth of tumour cells. Hence, in the past few years, the rapidly advancing field of cancer immunology has produced several new methods of treating cancer, called immunotherapies, which increase the strength of immune responses against tumours. Immunotherapies either stimulate the activities of specific components of the immune system or counteract signals produced by cancer cells that suppress immune responses. Such immunotherapeutic strategies include a plethora of vaccine-based methods to trigger anti-tumor cellular and humoral immunity, antibody strategies to mediate complement and NK-dependent anti-tumor cytolytic activity, block inhibitory receptors, or modulate the tumor microenvironment, oncolytic virus and adoptive cell transfer strategies [14]. A number of immunotherapy drugs are already used in cancer treatment and even more await the results of the latest clinical tests.
1.3. Universal adoptive T cell therapy approach: γδ-T
cells
Although in the last decades remarkable progress has been made in the outcome of patients affected by oncological malignancies, many of them still suffer from either relevant toxicities or have relapsed/refractory
disease. Innovative and less toxic treatment strategies are therefore urgently needed [15-16]. Emerging evidences highlight the possibility to strengthen the ability of the immune system to identify, seek out and destroy malignant cells. Due to their well-known intrinsic immunosurveillance properties, components of the innate immune system might represent promising platforms for innovative immunotherapy approaches. γδ T cells represent one of the major components of the innate immune system with distinct T cell receptor (TCR) γ and δ chains on their surface, which account for 0.5– 5% of all T-lymphocytes. This small subset of cells was first described in 1987, after the accidental discovery of a third chain of the TCR (γ chain) in 1984 [17-18]. In contrast, most of the T cells in the healthy human instead are T cells (65–70%) with a TCR composed of two glycoprotein chains called α and β TCR chains. Although, γδ T cells are much less frequent than αβ T cells; they are at their highest abundance in the gut mucosa, within a population of lymphocytes known as intraepithelial lymphocytes [18-19]. Their features include non-MHC restricted antigen recognition and an abundant cytokine secretion capacity. These attractive features have raised expectations for their application in cancer adoptive immunotherapy [20]. Similar to αβ T cells, their polyclonality has been demonstrated crucial for exerting a potent cytotoxic activity against bacteria, viruses and distinct types of cancer and they have high capacity to physiologically infiltrate the microenvironment of solid tumours [21]. Therefore, focusing also on their function as professional antigen presenting cells (APC), several studies underline the role of γδ-T cells in boosting the response of the immune system [22]. Then, based on their biological function, γδ T cells can also be divided into two distinct subsets: effector γδ T cells and regulatory γδ T cells. When γδ T cells are activated by a stimulus, the cells, that play an antitumor role by secreting cytokines, act through antibody dependent cellular cytotoxicity (ADCC) effects, as well as other processes, and
therefore are referred to as effector γδ T cells. These cells migrate to the local tumor environment and have the capacity to lyse cancer cells through the perforin-granzyme pathway [23]. For example, in renal cancer, γδ T cells have shown to display a selective lytic potential towards autologous primary renal cancer cells, but not against normal renal cells, an effect mediated mainly depending on the TCR and the NKG2D receptor [24]. Several clinical trials emphasized the therapeutic potential [25-26]. For example, long-term remission of leukaemia amongst allogeneic haematopoietic stem cell transplantation (HSCT) recipients transplanted from a human leucocyte antigen (HLA)-disparate donor correlates with increased engraftment frequency of donor-derived γδ-T cells [27]. A potent ex-vivo anti-tumour activity of isolated γδ-T cells has also been clearly shown in patients after HLA-haploidentical αβ-T-cell depleted HSCT [28]. In this heterogeneous population, the γδ T cells expressing a TCR containing γ-chain variable region 9 (Vγ9) and δ-chain variable region 2 (Vδ2), known as Vγ9/Vδ2 T cells, showed in numerous pre-clinical and clinical studies a potent anti-tumor activity, inhibit cancer cell proliferation, angiogenesis, lymphangiogenesis, and increase cancer cell apoptosis [29-30]. Vγ9/Vδ2 T cells can recognize phosphorylated antigens that accumulate in cancer cells, interact with the F1-ATPase expressed on the cancer cell surface, and recognize stress-induced molecules, such as the MHC class I chain-related molecules A and B (MICA and MICB), as well as UL16-binding proteins [31]. In contrast, Vδ1 and Vδ3 γδ T cells comprise only a minor subset of this population. In particular, Vδ1 γδ T cells showed activity against glioblastoma and are found in normal human epithelia, dermis, spleen and liver, as well as in the peripheral blood of patients with chronic viral infections and patients with leukemia correlating with their complete response[32-33-34].This population has also been associated with clinical benefits due to its more naïve memory phenotype [35] the reduced
susceptibility to activation-induced cell death [36] and its natural residency in tissues. Little is known on Vδ1negVδ2negVδ3neg population, and it has been suggested that this subset has a role in both anti-viral and anti-tumor immunity [37-38]. Moreover, as mentioned above γδ-T cells have the peculiar ability of recognizing antigens in an MHC independent manner [39] and are capable to activate macrophages and dendritic cells [40-41]. Their negligible alloreactivity makes them optimal candidates for the generation of a third-party, off-the-shelf and ready-to-use, T-cell bank. Although these characteristics render γδ-T cells extremely attractive as platform for immunotherapies, their low frequency in peripheral blood (PB) poses a relevant limitation for their clinical exploitation [35]. Expansion protocols conventionally used to propagate αβ-T cells fail at initiating and sustaining γδ-T-cell growth [42-43]. To date, large-scale ex vivo γδ-T cell expansion is limited to the Vδ2+ population, particularly Vγ9Vδ2, which can
be expanded through the administration of Zoledronic Acid [44-45]. The adoptive transfer of these cells showed clinical responses in the treatment of both solid and hematological malignancies [45-46]. Other studies demonstrated the expansion of γδ-T cells using either plant-derived T-cell mitogens [47-48] or artificial antigen-presenting cells (aAPC) engineered to express costimulatory ligands [49]. However, all these protocols were incapable of inducing the expansion of sufficient numbers of Vδ1 tissue-infiltrating/virus-specific γδ-T cells; moreover, a safety mechanism to eliminate aAPCs in vivo was not included.
1.4. Cell culture models
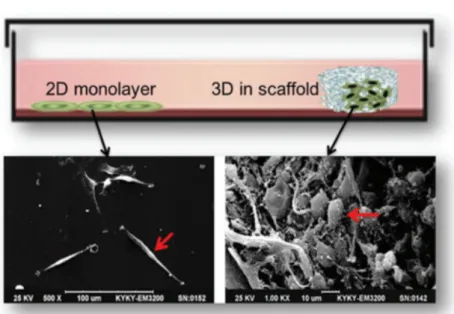
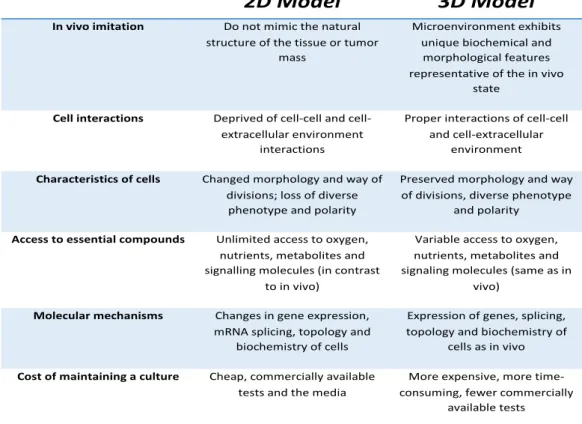
Studies on the mechanisms underlying the formation, function and pathology of tissues and organs are manageable largely due to the use of cell culture systems and animal models [50].Nowadays, experiments can be conducted using primary cells isolated directly from the donors’ biopsies or using established cultures deposited in cell banks [51]. Characteristic features of primary cells are difficulties with isolation and short life span. On the other hand, they closely mimic the in vivo genetic features of tumors and thus make it possible to perform some functional experiments. Cell cultures make it possible to understand cell biology, tissue morphology, mechanisms of diseases, drug action, protein production and the development of tissue engineering [52]. They are often used in the preclinical research of many drugs, in cancer research, and in studies on gene function [51]. The choice of the most appropriate cell culture methods in the area of cancer research may al-low us to better understand tumor biology, and hence to optimize radio- and chemotherapy, or even to find new treatment strategies [53]. The most commonly used type of cell culture is the 2D model, but recently the 3D culture method has been gaining in popularity because has proved to be particularly promising for studying cellular behavior respecting the microenvironment and cellular organization (figure 4) [54]. Depending on the type of culture chosen, cell behavior in fact differs in many aspects [52].
Figure 4: Different cell organization in 2D and 3D cultures. Comparison of tumor
cells morphology between 2D and 3D scaffold culture. U87 cells in 2D (left) and 3D scaffold (right) in a scanning electron microscope image. Modified from:
Three-dimensional cell culture: A powerful tool in tumor research and drug
discovery (Review).Donglai LV et al. Oncology letters July 27, 2017.
1.5. 2D Culture
In adherent 2D cultures, cells grow as a single layer attached to a plastic or glass surface [55]. 2D crops have the advantage of being easy to make and cheap. 2D cultures also have numerous disadvantages. Since the cells are distributed on a cellular monolayer, they cannot imitate the structure and organization assumed by the cells in their natural environment. In this culture method, interactions with the microenvironment and cell-cell extracellular cells are limited compared to those in vivo. These interactions are responsible for cell differentiation, proliferation, vitality, gene and protein expression, stimulus reactivity, drug metabolism and other cellular functions [54-56-57]. Furthermore, the cell morphology and the proliferative rate are also altered. The different organization and morphology of cells in 2D cultures can influence their function [58-59]. Furthermore, cells growing in plates forming a cellular monolayer lose their polarity [60], this modifies the response of cells to different phenomena, such as apoptosis [61-62]. Another notable difference that cells in 2D cultures present with respect to the in vivo situation is the availability of oxygen, nutrients, metabolites and signal molecules. In fact, in vivo, the availability of these factors is extremely variable due to the architecture of the cells within the tumor mass [54], while in 2D cultures all cells are equivalent and have easy access to nutrients and oxygen. Furthermore, several studies underline how the 2D grown is able to modify the gene profile of the cells []. Moreover, in 2D cultures not only the maintenance of cellular architecture is lacking but above all the microenvironment, fundamental for tumor development. Because of these disadvantages, it was necessary to find alternative models, able to imitate the cellular organization and the tumor microenvironment, such as the use of 3D culture systems (Table 1).
Table 1: Comparison of 2D and 3D cell culture methods. Modified from: 2D and 3D cell cultures a comparison of different types of cancer cell cultures M. Kapałczyńska et al.
1.6. 3D Culture
Tumor cells grown in 3D platforms form multicellular tumor spheroids or organoids. Organoids are aggregates of tumor cells grown in suspension or incorporated in gel using 3D culture methods. One of the first three-dimensional crops was made in a soft agar solution and was made from Hamburg and Salmon in the 1970s [65]. Since then, new methods and materials have been used. There are different methods used to create 3D models, each has advantages and disadvantages, that can be divided into: cultures in suspension on non-adherent plates, cultures in concentrated medium or in gelatinous substance and cultures on a scaffold. 3D cultures can be created with donor cells, these are grown in three-dimensional
2D Model 3D Model
In vivo imitation Do not mimic the natural structure of the tissue or tumor
mass
Microenvironment exhibits unique biochemical and
morphological features representative of the in vivo
state
Cell interactions Deprived of cell and cell-extracellular environment
interactions
Proper interactions of cell-cell and cell-extracellular
environment
Characteristics of cells Changed morphology and way of divisions; loss of diverse phenotype and polarity
Preserved morphology and way of divisions, diverse phenotype
and polarity
Access to essential compounds Unlimited access to oxygen, nutrients, metabolites and signalling molecules (in contrast
to in vivo)
Variable access to oxygen, nutrients, metabolites and signaling molecules (same as in
vivo)
Molecular mechanisms Changes in gene expression, mRNA splicing, topology and
biochemistry of cells
Expression of genes, splicing, topology and biochemistry of
cells as in vivo
Cost of maintaining a culture Cheap, commercially available tests and the media
More expensive, more time-consuming, fewer commercially
structures, mimicking the architecture of the derivation tissue more accurately than is possible in 2D models [66]. This characteristic of 3D models is the result of cell-cell and environment interactions, created to imitate the structure of the tissue. Furthermore, cells can receive stimuli from local invasion, as happens in vivo [67-68]. In 3D cultures, the morphology and polarity of cells are maintained contrary to what happens in 2D [69-70]. In 3D cultures there is a difference in the proliferation dependent on the localization of the cells in the organoid, this is greater in the peripheral part of the 3D structures [71-72]. Another important feature of 3D cultures are that they exhibit gene expression, signaling and metabolism similar to the in vivo situation [73-74]. All these features make it possible for the 3D model to be used as a specific platform to study cancer cells in a context that recapitulates invasion and metastatic processes as well as escape mechanisms.
1.7.3D model as a platform for preclinical studies
Tumorigenesis is a complex and largely unknown process, dependent on multiple mechanisms, including the 3D architectural structure and the interaction between malignant and stromal cells in the tumor microenvironment [75-76]. Conventional 2D cell culture systems in which the specific tissue architecture, cell-cell and cell-matrix interactions and signaling between cellular residence within distinct niches are absent can’t summarize this interactivity [77]. In vitro altered biology of tumor cells and support of stroma impact on the pharmacological responses observed in vitro, reducing the predictive power of preclinical tests [78]. This limitation is particularly evident when complex therapies such as the use of immunotherapeutic approaches are tested. Cells cultured in 3D scaffolds
better recapitulate the in vivo architecture of tumors and display similar gene expression [79]. By increasing the correspondence between ex vivo cell culture and in vivo tumor growth, 3D cultures can improve the relevance of ex vivo studies and increase the predictive power of in vitro drug testing [80]. In our study, we use pegylated fibrin-based hydrogels, which solve various limitations that other models present, in fact they are quick to realize, it is possible to vary the concentration of fibrinogen by adapting the system to different cultures and varying the mechanical properties of gel of fibrin. Also, they are transparent and can be followed over time. It is a highly biocompatible and versatile system for a series of in vitro studies ranging from immunohistochemistry to live analysis. Moreover, thanks to its plasticity it can also be easily degraded allowing the whole recovery of the entire tumor heterogeneity without cell damage or alteration of surface molecules. All these features make this model optimal for realizing primary cultures and studying characteristics of the tumor and its biology.
AIMS OF THE PRESENT STUDY
- Establishment of primary pediatric brain tumor cultures
- Development of a new platform for the pre-clinical evaluation of immunotherapeutic approaches.
- method to efficiently expand polyclonally-activated γδ-T cells using aAPCs expressing costimulatory molecules, the CMV-pp65 antigen and an inducible safety switch in order to generate an off-the-shelf, stand-alone treatment or as bridging therapy to more targeted immunotherapeutic approaches.
MATERIALS AND METHODS
2.1. Patients and generation of 2D and 3D primary
Low-Grade Glioma lines.
We collected data from 40 consecutive pediatric patients diagnosed with Low Grade Glioma (LGG) in our Institution, from 1st January 2016 to 31st
July 2019. Diagnosis was based on clinical, radiological criteria and immunopathological evaluation. Samples were mechanically processed, washed twice with phosphate-buffered saline (PBS) (1200rpm for 10 minutes) and re-suspended in a GBM complete media [DMEM (Thermo Scientific-Rome, Italy) supplemented with 10% Fetal Bovine Serum (Thermo Scientific), 1% L-glutamine (EuroClone, Milan - Italy), 1% penicillin/streptomycin (EuroClone), 1% sodium pyruvate 100mM (EuroClone), 1% MEM non-essential amino acids (EuroClone) and 2% of sodium bicarbonate solution (Sigma Aldrich, St Louis, MO - USA)] in order to obtain a cell suspension. Cells were then seeded in 24 well plates to create 2D and 3D primary cultures. All samples were obtained after the approval of the institutional review board of Bambino Gesù Children’s Hospital.
2.2. Cell lines
All tumour cell lines were purchased from ATCC or DSMZ. K562 were cultured in RPMI1640 (Thermo Scientific) supplemented with 10% FBS and 2 mM GlutaMax (Thermo Scientific, Pittsburgh, PA, USA). The glioblastoma cell lines U87 and U373 were cultured in DMEM supplemented with 10% FBS and 2 mM GlutaMax. The 293T cell lines were
cultured in IMDM (Thermo Scientific), supplemented with 10% FBS and 2 mM GlutaMax. Cells were maintained in a humidified atmosphere containing 5% CO2 at 37°C. All cell lines were routinely tested for
mycoplasma infection and authenticated by short tandem repeat analysis (Eurofins Genomic, Ebersberg, Germany).
2.3. Vector design and transient transfection.
Retroviral and lentiviral vectors were generated to stably transduce K562, an immortalized leukaemia cell line. The retroviral vector was designed to encode the cDNA of CD86, 41BBL and the inducible caspase-9 (iC9) suicide gene using SFG retroviral backbone [81], while the lentiviral vectors encode the cDNA for CMV-pp65 with or without the costimulatory molecule CD40L. An additional retroviral vector encoding eGFP-Firefly-Luciferase (eGFP-FFLuc) was used to label tumour cells for in-vitro studies, as previously described [82-83-84].
2.4. Preparation of PEG-fibrin hydrogel components
and cell retrieval
Fibrin/PEG-based hydrogels were prepared as previously described [88]. Human fibrinogen (Sigma Aldrich,) was solubilized in PBS at a concentration of 80 mg/mL. After 2h of incubation at 37°C, the solution was filtered using a 0.20 mm SteriFlipfilter (EMD Millipore, Billerica, MA - USA). Succinimidyl-glutarate-modified bifunctional polyethylene glycol [3.4 kDa SG-PEG-SG (PEG); NOF America Corporation, White Plains, NY - USA] was dissolved in PBS at 8 mg/mL and filtered with a 0.2 mm syringe. Fibrinogen and PEG solutions were combined in a 1:1 volume ratio, mixed
thoroughly, and incubated at 37°C. PEGylated fibrinogen was then mixed at a 1:1 volume ratio with the cell solutions (1,2e5 cells/mL of U373 eGFP-FFLuc and U87 eGFP-eGFP-FFLuc; or processed cell suspensions of samples from pediatric LGG). Human thrombin (Sigma Aldrich) was diluted to 25 U/mL in sterile 40 mM CaCl2 (CalBiochem, La Jolla, CA - USA) and incubated at
37°C before use. To retrieve cells from the hydrogel, a fibrinolytic solution was prepared by dissolving 75 mg/mL (fibrin degradation units) of nattokinase (NSK-SD; Japan BioScience Laboratory Co., Ltd) in PBS containing 1 mM EDTA. The hydrogels were subsequently dissolved by adding 1 ml of the fibrinolytic solution and incubating at 37°C for 20 minutes [85].
2.5. Immunofluorescence staining
Primary cell lines were grown in complete media for at least 5 days in 24 multi-well glass plates. When 2D and 3D primary cell lines reach 80% of confluence, medium was removed, and the cells were washed with PBS (300uL/well 2 times for 1 minute). Cells were fixed with Paraformaldehyde 4% in PBS (CYTOFIX, BD Biosciences, San Jose, CA, USA) (300uL/wells 10 minutes at room temperature (RT)) and then washed with PBS (300uL/wells 2 times from 5 minutes). Then, cells were washed with IFF buffer (PBS 1X + 5% FBS + 2% Bovine Serum Albumine SIGMA-aldrich, St.Louis,USA) (300uL/well for 5 minutes) and permeabilized with 0,5% Triton for 10 minutes at RT and finally washed 2 times with PBS and 2 times with IFF for 5 minutes. After a fixation and permeabilization, the cultures were blocked with 10% normal goat serum (SIGMA-aldrich, St.Louis,USA), in PBS 300 ul/well for 1h at RT while shaking. Following the unspecific site block, cells were incubated with primary antibodies [polyclonal rabbit anti-human glial
fibrillary acid protein (DAKO, L’Aquila, Italy); polyclonal rabbit anti-human XOlig-2 (Millipore); monoclonal mouse anti-anti-human Synaptophysin (Dako); polyclonal chicken anti-human Ki-67 (Immunological sciences, Gainesville Florida, USA); polyclonal rabbit anti-human anti-p16 (Immunological sciences); monoclonal mouse anti-human p53 (Immunological sciences) with at least 200 ul/well, overnight for 2D cultures and for two days in the dark at 4°C for 3D cultures . Cells were then washed twice with PBS (300ul/well) and with IFF buffer (300ul/well) and incubated with the secondary antibodies resuspended in IFF buffer, 200ul/well [goat anti-rabbit Alexa Fluor 555F(ab*)IgG(H+L) (Thermo Fisher Scientific, Vanallen Way, Carlsbad, USA; 1:1000); goat anti-mouse Alexa Fluor 488 (Thermo Fisher Scientific; 1:1000); donkey anti-chicken Alexa Fluor 488 IgY (IgG)(H+L) ( Immunological sciences; 1:1000) for 2h in the dark for 2D cultures and 2 days in the dark for 3D cultures while shaking. After incubation cells were washed with PBS (300ul/well) for 5 minutes and incubated with Hoechst dye (Hoechst 33342 trihydrocloride trihydrate, Invitrogen, Monza, Italy) for nuclear staining for 30 minutes in the dark at 4°C. Finally, cells were washed twice with PBS followed by 50% glycerol in PBS (300ul/ well) and stored at 4°C. Fluorescence signals were detected using confocal microscopy (Leica DMi8, Leica, Rome, Italy). All acquisitions were performed in non-saturated single z-confocal planes and images were captured from randomly selected fields of view.
2.6. Immunohistochemistry staining
Hydrogels were collected and fixed in 4% formaldehyde for 24h at RT
for paraffin embedding and haematoxylin/eosin or
immunohistochemistry staining. Human GFAP (Glial Fibrillary Acid Protein) and Olig-2 immunodetection was performed by incubating paraffin-embedded hydrogel sections with a primary polyclonal rabbit GFAP antibody (Dako, 1:50) or a polyclonal rabbit anti-Olig-2 antibody (Millipore, 1:200). For detection Dako LSAB + System-HRP (Dako) was used. Stained sections were scored in a blinded manner by a pathologist F. Diomedi Camassei.
2.7. Artificial Antigen Presenting Cell (aAPC)
generation
aAPCs were generated using the K562 cell line. The cells were first transduced with lentiviral vectors encoding either human pp65/eGFP or CD40L/pp65 [82]. Then cells were additionally transduced with a retrovirus vector encoding human CD86, 4-1BBL and iC9. After transduction, single cell clones were generated.
2.8. Phenotypic analysis
Expression of cell surface molecules was determined by flow-cytometry using standard methodology. Anti-human monoclonal antibodies were purchased from BD Biosciences, Miltenyi and eBiosciences. Samples were
software (BD Biosciences). For each sample, a minimum of 20,000 events were acquired.
2.9. Cytokine profile
Supernatants collected after 24h of co-culture were analysed using immunoassays incorporating magnetic microsphere technology (Millipore), according to the manufacturer’s instructions, as previously described [86].
2.10. Ex-vivo isolation and expansion of polyclonal αβ-
and γδ-T cells
Peripheral blood mononuclear cells (PBMC) were isolated from buffy coats (BC) obtained from healthy donors (HD) at Bambino Gesù Children’s Hospital after written informed consent was signed, in accordance with the rules set by the Institutional Review Board (N°969/2015 prot. N° 669LB), using LymphoprepTM density gradient medium (Eurobio, Courtaboeuf,
France). αβ-T lymphocytes were activated with immobilized OKT3 (1 µg/ml, e-Bioscience, San Diego, CA, USA) and anti-CD28 (1 µg/ml, BD Biosciences, Franklin Lakes, NJ, USA) monoclonal antibodies, while γδ-T cells were isolated using the γδ isolation kit (Miltenyi, Bergisch-Gladbach, Germany) and stimulated weekly with irradiated aAPCs. T cells were expanded in medium containing 45% RPMI1640 and 45% Click’s medium (Sigma-Aldrich), supplemented with 10% FBS and 2 mM GlutaMAX in a humidified atmosphere in the presence of IL2 (2.1x10⁴ U/ml, R&D,
Minneapolis, MN, USA) for αβ-T lymphocytes; for γδ-T cells IL2 (2.1x10⁴ U/ml), IL12 (4.5x10⁵ U/ml, Miltenyi), IL15 (3x10⁶ U/ml, R&D), and
IL21 (2x10⁴ U/ml) (Miltenyi) were used for the first stimulation, while IL2
and IL15 for the following 3-4 weekly stimulations.
2.11. Co-culture assay
For co-culture experiments, αβ- or γδ-T cells were plated at the indicated Effector:Target (E:T) ratios with or without supplementation of IL2/IL15 in the presence of eGFP-FFLuc tumor cells. Bioluminescence signals of 2D and 3D cultures were evaluated overtime adding 20 ug/ml of D-Luciferin K+ salt
(Perkin Elmer,Waltham,MA, US). At days +6 and +14 of co-culture, cells were collected, and residual tumour evaluated by flow-cytometry [81-87].
2.12. Senescence associated Galactosidase (SA-
β
-gal)
Activity Assay
To assess senescence, we used the Senescence β-Galactosidase Staining Kit (Cell Signaling Technology, Danvers, MA, USA). Primary 2D and 3D cell lines were cultured in 6 well plates until 70% of confluence. Cells were washed twice with 2mL of PBS followed by 1 ml/well of a fixative solution. for 10-15 minutes at RT. Then, the cells were rinsed twice with PBS and successively incubated with 1 ml/well of the β-Galactosidase Staining Solution. Plates were sealed in order to avoid evaporation and incubated at 37°C O/N in a dry incubator. Nucleic staining was performed with DAPI. The analysis was performed by fluorescence microscopy (LEICA DMC4500 LEICA Microsystem, Buccinasco ; ITALY).
2.13. Cell Proliferation and MTT Assay
To evaluate cell proliferation after several treatments, we used CellTiter 96 AQueous one solution Cell Proliferation Assay (MTT Assay) (Promega, Milan, Italy). Immortalized as well as 2D and 3D primary cell lines were cultured for 2 days and 5 days, respectively, in 48 multi-well plates, and then treated with ionizing radiation, administration of vincristine or infection with oncolytic adenovirus. After 7 or 14 days of treatment, the medium was removed from 2D and 3D cultures and the hydrogels dissolved by the fibrinolytic solution. Then 40 ul/well of MTT was added into each well containing the samples in 200ul of PBS. The plate was subsequently incubated at 37°C for 2 hours in a humidified, 5% CO2
atmosphere. Viability was assessed by measuring the absorbance at 492 nm with a plate reader (SYNERGY H1 microplate reader, BioTeK, Winooski, VT-USA).
2.14. Irradiation of immortalized and primary 2D and
3D cultures
Cells were seeded at a density of 7x10³ cells/well in 24 well plates and
maintained under appropriate culture conditions. The following day for the 2D model and at day +4 for the 3D model, the cells were irradiated with 80 Gy and 160 Gy using a (RADGIL2, GILARDONI s.p.a ,IRA01A1).The plates were placed in the incubator at 37°C. After 7 days of culture the cell viability was evaluated by MTT assay.
2.15. Treatment of immortalized and primary 2D and
3D cultures with vincristine
Cells were seeded at a density of 7x10³ cells/well and maintained under
appropriate culture conditions. The following day for the 2D model and at day +4 for the 3D model, the medium was removed, and the cells treated with increasing concentrations of vincristine (SIGMA Aldrich): 1x10⁻⁴ M,
1x10⁻² M, 1x10⁻¹ M and 0 M in 1mL of complete culture media. The plates
were placed in the incubator at 37°C. After 7 days of culture the cell viability was evaluated by MTT assay.
2.16. Statistical Analysis
Unless otherwise noted, data is summarised as average ± standard deviation (SD) from at least three independent experiments. Statistical significance was measured using a paired Student's T test, assuming a two-tailed distribution, one-way and two-way analysis of variance (ANOVA) followed by Tukey’s post hoc test. Graph generation and statistical analyses were performed using Prism version 6.0d software (GraphPad, USA).
RESULTS
3.1. Sophisticated qualitative and quantitative
monitoring of glioma tumor growth with the 3D
hydrogel platform.
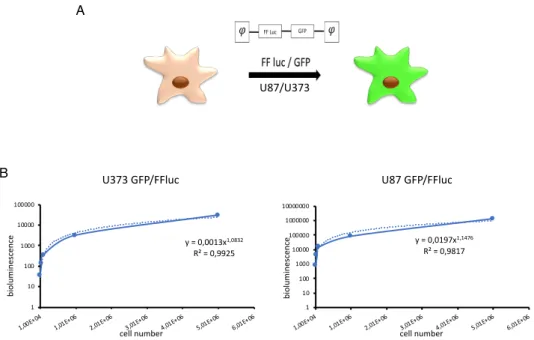
U87 and U373 immortalized cell lines were first used to set up the 3D conditions. After genetically modifying the glioma cells with a retroviral vector encoding the Green Fluorescent Protein (GFP) in tandem with the FireFly-Luciferase (FF/Luc) (Figure 5A), they were plated in the pegylated fibrin (PEG-fibrin) hydrogel 3D scaffold, as previously described [88].
y = 0,0013x1,0832 R² = 0,9925 1 10 100 1000 10000 100000 1,00E+ 04 1,01E+ 06 2,01E+ 06 3,01E+ 06 4,01E+ 06 5,01E+ 06 6,01E+ 06 biolum ine sc enc e cell number y = 0,0197x1,1476 R² = 0,9817 1 10 100 1000 10000 100000 1000000 10000000 1,00E+ 04 1,01E+ 06 2,01E+ 06 3,01E+ 06 4,01E+ 06 5,01E+ 06 6,01E+ 06 biolum ine sc enc e cell number
U373 GFP/FFluc U87 GFP/FFluc
U87/U373
A
B
Figure 5: Correlation between bioluminescence signal and number of cells in the Hydrogel. Schematic representation of the retroviral vector encoding GFP and FF/Luc
used to transduce tumour cell lines U87/U373 (A). Quantitative correlation between the number of GFP/FFluc-U373 (graph on the left) and GFP/FFluc-U87 (on the right) and the bioluminescence signal(B)
In order to monitor the cell growth, the bioluminescence signal was acquired and correlated with the number of seeded cells. We were then able to draw a curve correlating reliably the bioluminescence signal and the cell number in the hydrogels. This allowed us to obtain a quantitative measurement of the cellular growth without disrupting the system (figure 5B). Moreover, we recapitulated the 3D architecture and organization of the cells in the hydrogel through a confocal microscopy reconstruction of the GFP+ tumor cells,
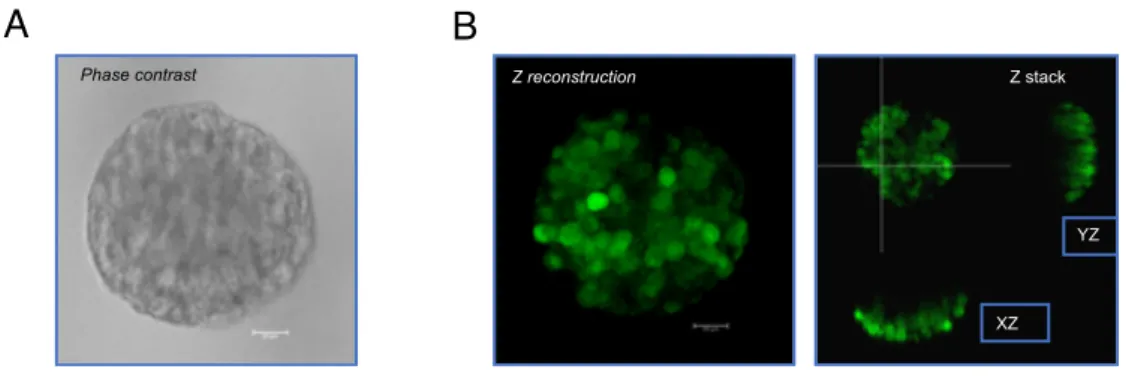
performed acquiring images on the x, y and z axes. As shown in figure 6A-B, the U87 cells self-assemble in the tridimensional area, organizing into complex organoid structures.
Figure 6: Confocal microscope images of 3D cultures of U87. Image of an organoid in bright
field (60x) (A). Cell morphology of GFP+ cells analyzed through confocal microscopy and the
reconstruction along three axes x, y and z (60x) (B). Phase contrast Z reconstruction
XZ YZ Z stack
3.2. The 3D platform allows the establishment of
primary cell lines of LGGs displaying more complex
structures and more regular growth rate, as compared
to conventional 2D cultures.
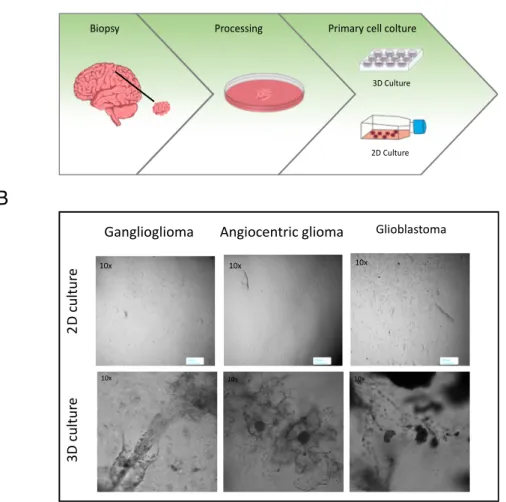
After establishing the ability of the PEG-fibrin hydrogel to sustain the growth of glioma cell lines into complex 3D structures, we proceeded into a more complex system by culturing primary cell lines derived from pediatric brain tumors samples. In particular, upon approval from the IRB, brain tumor samples were received by the Neurosurgery and Neuro-oncology Unit of the Ospedale Pediatrico Bambino Gesù (OPBG), on the day of the surgery. Each sample was readily processed and subsequently cultured in both conventional two-dimensional (2D) and three-two-dimensional (3D) platforms simultaneously, as shown in the cartoon of the figure 7A. All the samples of gliomas, from grade I (WHO) to grade IV (WHO) received was cultured upon receipt. However, we focused particularly on the establishment of cultures of LGGs, considering the well-known early in vitro activation of senescence pathways in these tumor cells. This phenomenon leads to a substantial impossibility of maintaining and expanding LGGs cells in culture and therefore to a lack of a reliable in vitro cellular model for these tumors. Moreover, in order to avoid the selection of any subpopulation in the culture, we did not include any growth factor or special additive in the culture media. Up to date, 45 LGG samples and 6 HGG samples have been collected and cultured. The histological diagnosis of the tumors are shown in details in Table 2. Table 2 also shows
that the engraftment capacity of the 3D scaffold structure is greater than the same sample grown in 2D, showing how this model is better at maintaining primary cultures of LGG.
Table 2: Details of the histology of the LGGs and HGGs samples cultured in 2D and 3D platforms. The overall number of samples cultured after surgery is shown as total; the
relative cultures stably established in 2D and 3D are shown in each column, for each histology.
The cultures were then followed overtime and growth monitored by conventional microscopy. As shown in Figure 7B, when cultured in the 3D platform, the cells derived from the tumor samples self-organize into complex 3D structures, with multiple and differentiated compartments, suggesting an interplay between different cell types. On the contrary, 2D cultures display a simple, more homogeneous, monolayer distribution (figure 7B). Histology TOT 2D 3D LGG 45 Astrocytomas 19 11 18 Gangliogliomas 18 5 14 Other histology 8 4 6 HGG 6 Anaplastic astrocytomas 3 1 3
Diffuse intrinsic pontine glioma 2 1 2
Figure 7: Generation and expansion of primary cultures from pediatric brain tumors. Schematic representation of the processing of brain tumor samples to set
up primary 2D and 3D cultures (A). BF pictures of 2D (upper panel) and 3D (lower
panel) primary cultures of paediatric brain tumours (10X). (B).
When the primary cell cultures reached a confluence of 70-80%, either in the 2D or in the 3D conditions, we subcultured the cells for continued growth and to stimulate further proliferation, obtaining secondary cell cultures. The analysis of the secondary cell cultures obtained and maintained overtime in 2D, and 3D is shown in figure 8A. In both the platforms, ganglioglioma and low grade astrocytomas represent the more frequent histology, reflecting the epidemiology of LGGs in the patient population. We did not observe any advantage of establishment and growth for any histology. We further
Biopsy
2D Culture 3D Culture
Processing Primary cell colture
Glioblastoma
Ganglioglioma Angiocentric glioma
B A 2D cu ltu re 3D c ul tur e 10x Angiocentric glioma 10x Glioblastoma 10x Ganglioglioma 10x 10x 10x
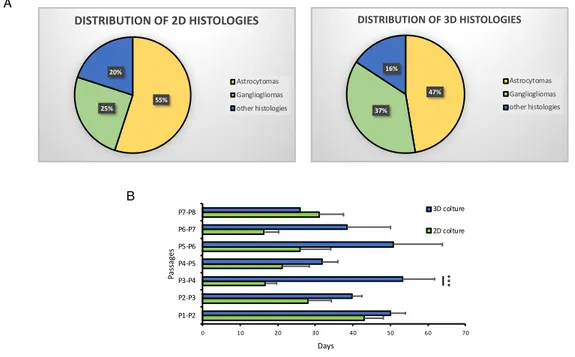
analyzing the average days of cultures between each passage, focusing on the first 7-8 passages. As shown in the figure 8B, the average culture days of each passage is comparable between the 2 platforms at the first passage and becomes progressively shorter in the 2D cultured tumors, as compared to the 3D, up to step 3-4 where we have a significant difference (p = 0.0005187) between the two models, reaching a stability at passage 5-6. reaching a stability at passage 5-6. On the contrary, the average days between passages of the 3D cultured cells maintained longer than the 2D cultured cells and more regular between every passage. The lower rate of growth observed in the 3D tumors is more representative of the real growth kinetic of these tumors, in humans, known to develop over several months or even years. On the other hand, the increasingly rapid growth of the 2D cultures may suggest the selection of transformed cells.
Figure 8: Difference of tumour engraftment rate in 3D and 2D culture. The average
duration of each culture passage, expressed in days, in the 2D and 3D model (N=from 30 to 2) (B). The pie chart shows the percentage distribution of LGG in 3D and 2D culture (A)
B A 47% 37% 16% DISTRIBUTION OF 3D HISTOLOGIES Astrocytomas Gangliogliomas other histologies 55% 25% 20% DISTRIBUTION OF 2D HISTOLOGIES Astrocytomas Gangliogliomas other histologies 0 10 20 30 40 50 60 70 P1-P2 P2-P3 P3-P4 P4-P5 P5-P6 P6-P7 P7-P8 Days Passag es 3D colture 2D colture ***
3.3. Primary LGG lines show morphology, structural
organization and histopathology closely resembling
the tumor of origin in the 3D organoids.
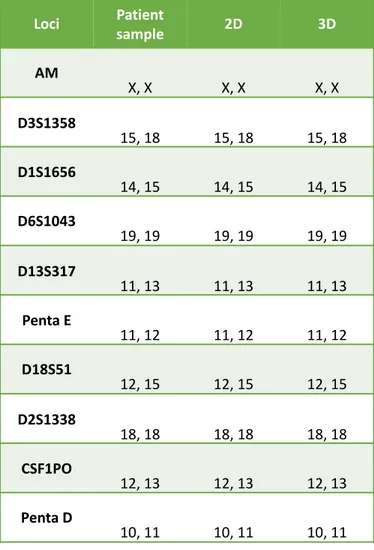
After obtaining subcultured LGGs cell lines, we characterized both the 2D cultured and the 3D cultured cells. At first, we authenticated the cells to confirm the origin by performing short tandem repeat (STR) profiling, the recommended method for the purpose of authentication [89]. As shown in table 3, identity between the patient sample and the cultures was confirmed.
Table 3: Results of STR evaluation of the sample of one representative patient and of
Loci Patientsample 2D 3D
AM X, X X, X X, X D3S1358 15, 18 15, 18 15, 18 D1S1656 14, 15 14, 15 14, 15 D6S1043 19, 19 19, 19 19, 19 D13S317 11, 13 11, 13 11, 13 Penta E 11, 12 11, 12 11, 12 D18S51 12, 15 12, 15 12, 15 D2S1338 18, 18 18, 18 18, 18 CSF1PO 12, 13 12, 13 12, 13 Penta D 10, 11 10, 11 10, 11
Subsequently, we characterized the nature of the subcultured cells, for histopathologic confirmation, by evaluating the organoids morphology and the expression of specific tumor markers. In details, we processed the hydrogels by paraffin embedding and obtained sections that were then stained by either hematoxylin and eosin (H&E), immunofluorescence (IF) or immunohistochemistry (IHC). once stained, the 3D organoids were compared with the tumor sample at onset (representative sample in figure 9A). As shown in the figure 9A, in the 3D organoid the cells acquire a spindle shape and organize in tumor aggregate with a complex organization that closely resembles the tumor of origin. Beside the morphological organization of the tumor, as shown in figure 9A, the 3D organoid displays a positivity at IHC for the glial fibrillary acidic protein (GFAP) and a negativity for Olig-2, corresponding to the IHC signature of the tumor of origin (Figure 9A). These results confirm that not only the 3D culture has grown and organized as the tumor of origin, but also that it maintains its histological characteristics. The 2D cultured cells could not be analyzed for these features, since they lack by definition a structural organization.
Therefore, to further characterize the histopathology of both the 2D and 3D cultured cells, all the primary cultures were analyzed by IF. Figure 9B shows the staining of 2 representative 3D and 2D cultured cell lines derived from 2 distinct LGGs samples. In the 3D culture the cells are morphologically heterogeneous. Two large central cells can be distinguished, showing an elevated expression of GFAP and Synaptophysin; other smaller cells show a weak colocalization of the two markers. Lastly, Olig-2 is expressed homogeneously by all the cells (figure 9B). In the classical two-dimensional culture, the histopathology of the cell line is confirmed as well but the cells appear more homogeneous in size and
for the expression of the 3 markers analyzed. These results suggest that the 3D platform is more suitable than conventional bidimensional systems for growing primary LGG cell lines that better recapitulate the morphology, the organization and the heterogeneity of the tumor of origin.
Figure 9: Characterization by IHC and IF of 2D and 3D cultures derived from samples of LGGs. Sections of a sample of angiocentric glioma at diagnosis and a 3D expanded
primary culture from the same tumor were compared by H&E and IHC for GFAP and Olig-2 (20X) (A). Image acquired by confocal microscopy of 2 primary cultures of LGGs, stained for GFAP (red), synaptophysin (green) and olig-2 (red); nuclei are marked by Hoechst (blue). The upper panel shows a 3D culture, the lower panel a 2D culture (20X) (B). Histology at diagnosis 3D culture An gi oce nt ric Gl io m a Ol ig -2 H& E GF AP 20x 20x 20x 20x 20x 20x B 3D -cu ltu re d LG G ce lls GFAP Synaptophysin Hoechst Olig-2 Hoechst GFAP Synaptophysin Hoechst Olig-2 Hoechst 2D -cu ltu re d LG G ce lls A
3.4. Differently from the conventional 2D cultures,
3D-cultured LGGs cell lines have a lower rate of activation
of senescence.
After establishing the cultures, confirming their authentication and assessing the histopathology and phenotypic closer similarity to the tumor of origin in the 3D-culture, we evaluated whether the same platform could also recapitulate more realistically key biological functions of the cells. In particular, we focused first on the activation of the senescence pathway. In fact, the early activation of this pathway represents a well-known limitation to the possibility of maintaining LGG cells in conventional culture. The establishment of stable cell lines that can be used to evaluate cellular behavior in response to different treatments is therefore difficult to obtain. We observed that the cells grown in 2D cultures exhibited phenotypic changes that resembled those observed in cells undergoing senescence, including a flattened cell morphology with enlarged cell size. In contrast, the cell lines grown in the 3D platform maintained a regular morphology overtime. We next examined the senescence by combining the 2 most established methods: the evaluation of the endogenous SA-β-gal activity
(pH 6.0) and the staining for the markers of senescence (p53, p16 and Ki-67). As shown in a representative patient in figure 10A, a stronger SA-β-gal
Figure 10: Evaluation of senescence level in 2D and 3D cultured cells. Images acquired
by confocal microscopy of the nuclei, stained in blue with Hoechst (on the top), and of the β-Galactosidase staining at ph 6.0 in BF (at the bottom), on U373 (Negative control, CTRL), 2D and 3D primary cultures derived from the same representative patient (A). Cumulative analysis of the percentage of senescent cells of primary 2D and 3D cultured cells deriving from LGGs (n=4), data are expressed as average ± SEM. **p<0.01 (B).
In order to quantify the activity, the percentage of senescent cells was quantified in 4 patients, cultured in both 2D and 3D conditions, at the same timepoint of culture. As shown in Figure 10B, the percentage of senescent cells in 2D cultures is significantly greater than the 3D cultures (p = 0.007). In primary cells, premature senescence involves the overexpression of the tumor suppressors, such as p53 and p16, associated with a low proliferation index, expressed by the low/absent positivity for the nuclear Ki-67.
10X 0 20 40 60 80 100 2D colture 3D colture % se ne sce nce ** 10X 10X BF DAPI U373 CTRL-10X 10X 2D CULTURE 10X 10X 3D CULTURE Ganglioglioma
B
A
Figure 11: expression of p53, p16 and ki-67 in primary LGG cultures. Two representative
2D and 3D primary cultures derived from the same LGG tumor sample, were stained by IF and acquired through confocal microscopy (20X). The nuclei are stained in blue with Hoechst, the ki-67 in green, p16 in red and p53 in green (A). Analysis of the percentage of Ki-67, p16 and p53 positive cells in 3 primary cultures, both 2D and 3D (for each patient, 6 different fields were evaluated); data are expressed as average ± SEM. *p<0.05 (B).
We therefore evaluated the expression of these 3 markers by IF on 3 primary LGGs 2D and 3D cultures. In the Figure 11A, the expression of these markers on 2D and 3D primary cultures derived from a Polymorphous low grade neuroepithelial tumor of the young (PLNTY) is shown in detail. In the 2D culture, a greater expression of p16 with a remarkable decrease of the expression of ki-67 is observed, as compared to the 3D culture (figure 11A). The percentage of p16, p53 and Ki-67 positive cells in 3 2D and 3 3D primary cultures of LGGs was then evaluated, as shown in figure 11B. The cell lines cultured in 2D have a significantly higher percentage of p16 positive cells than the 3D-cultured cells (p = 0,025).At the same time, in the
p16 0 10 20 30 40 50 60 70 80 90 100 p53 p16 Ki-67 (%) p er ce ntag e o f p osi tiv e ce lls 2D Culture 3D Culture 20X 20X 20X 20X 20X 20X 20X 20X 20X 20X 20X 20X 20X 20X 20X 20X 20X 20X
Polymorphous low-grade neuroepithelial tumor of the young (PLNTY)
2D CULTURE 3D CULTURE p53 Ki-67 * * B A Ki-67 Ki-67 P-53 P-53 P-16 P-16 Hoescht Hoescht Hoescht Hoescht Hoescht Hoescht Merge Merge Merge Merge Merge Merge
clearly shown by the significantly higher percentage of positive Ki-67 cells (p=0.02) (figure 11B). The positivity of p53 remains comparable in the 2 models. These data clearly show that in the 3D model there is a lower activation of the senescence pathways, allowing the development of primary LGGs cultures.
3.5. The 3D-cultured LGG cell lines display a kinetic of
response to conventional treatment that more closely
predicts the clinical response than the 2D cell lines
After verifying that the morphologic and biological behaviour, in terms of growth and senescence, of the 3D-cultured LGGs primary cell lines was more realistically representative of the tumor of origin, we wanted to verify whether this could translate into a more realistic prediction of the response to treatments, therefore ultimately offering a more reliable platform for screening the activity of innovative approaches. Therefore, we first compared the response to the two conventional approaches used to treat this kind of tumor: radiotherapy and chemotherapy (vincristine). Several primary LGG 2D-cultured and 3D-cultured cells were treated with increasing doses of ionizing radiation (0 Gy, 80 Gy and 160 Gy) (Figure 12A) or with different concentrations of the chemotherapy agent vincristine (0M, 1X10⁻⁴M, 1X10⁻²M, 1X10⁻¹M) (Figure 12B). Seven days after irradiation or
after treatment with vincristine, we evaluated the cell viability through MTT assay. As shown in Figure 12, for both the approaches, the cells in 2D cultures have a greater sensitivity to both the treatments, shown by the reduced vitality as compared to the 3D cultures.
Figure 12: Evaluation of the response of 2D and 3D cultures to conventional treatments.
Cell viability of cells in 2D and 3D cultures was tested by MTT assay 7 days after irradiation with 0 Gy, 80 Gy or 160 Gy (A) or after the administration of different vincristine doses:
0M, 1X10⁻⁴M, 1X10⁻²M, 1X10⁻¹M (B). Data summarized as average ± SEM of 3 2D and 3D
cultures. *p<0.05.
Differently from the response observed in the 2D cultures, the kinetic of the 3D cell lines is more coherent with that observed in the treatment of pediatric LGG: these tumors are, in fact, sensitive to radiotherapy, although the response is generally slow, and obtain a substantial stabilization of disease with the chemotherapy treatment. These results suggest that the 3D hydrogel provides a better model to predict response to treatment, offering an innovative tool for more detailed therapeutic studies.
0 0,1 0,2 0,3 0,4 0,5 0,6 0,7 0,8 0,9 1 NT 1x10⁻⁴M 1x10⁻²M 1X10⁻¹M Ce ll v ital ity (A sso rb an ce 490 n m) Vincristine
Day+7 2D Day+7 3D Day+14 3D
0 0,1 0,2 0,3 0,4 0,5 0,6 0,7 0,8 0,9 1 NI 80 Gy 160 Gy Ce ll v ital ity (A sso rb an ce 490 n m) Irradiation Day+7 2D Day+7 3D
3.6. Development and validation of a universal
ready-to-use immunotherapeutic approach for the treatment
of cancer based on the expanded and activated
polyclonal γδ memory T cells.
We therefore aimed at exploiting this well-established platform for studying more advanced immunotherapeutic approaches. At our laboratory, we developed a strong expertise in the use of adoptive therapies, especially for genetically modified T-cells expressing either a transgenic αβ T-cell receptor (TCR) or a chimeric antigen
receptor (CAR), to redirect the cytotoxic potential of αβ T cells against tumor cells.
Despite the extraordinary efficacy observed in the treatment of Acute Lymphoblastic Leukemia (ALL) with a CAR redirected against the CD19 antigen
(PMID: 25317870), similar results have not been yet reached in the treatment of solid
tumors where the results are still suboptimal. Innovative approaches are therefore required for these patients. As explained in paragraph “1.3”, innate T-cells are a heterogeneous population expressing a TCR composed of γ- and δ-chains and exerting a cytotoxic activity against bacteria, viruses and tumors. These cells have a very good ability to infiltrate into tissues, the peculiar capacity of recognizing antigens in a major histocompatibility complex independent fashion [90] and are capable of producing cytokines, not only directly but also indirectly, by stimulating macrophages and dendritic [40-41]. Their negligible alloreactivity makes them optimal candidates for the generation of a third-party, off the shelf and ready-to-use, T-cell bank. All these characteristics make γδ-T cells extremely attractive as platform for immunotherapies but their low frequency in peripheral blood poses a relevant limitation for their clinical exploitation [35]. In vitro expansion is therefore needed. For this reason, we decided to focus our attention on the generation of a protocol to expand polyclonal and activated γδ-T cells for their clinical application.