DIMEG – Dottorato di Ricerca in Ingegneria Meccanica
Claudia Varrese
Dipartimento di Ingegneria Meccanica, Energetica e Gestionale
Università della Calabria - 87036 Rende (CS) Italia
ANALISI DI SOSTENIBILITA’ AMBIENTALE DEI PROCESSI
INDUSTRIALI
Abstract
Il lavoro di questa tesi si propone come introduttore e suggeritore di una serie di tecniche, strumenti e pratiche di monitoraggio e controllo degli aspetti ambientali legati al ciclo aziendale. Lo strumento attualmente in uso oggi nelle imprese, che funge da guida nella ristrutturazione in ottica ambientale delle proprie attività è l’LCA, sul quale si basa l’approccio delle 6R e le strategie di sviluppo suggerite: REDUCE, REMANUFACTURING, REUSE, RECOVER, RECYCLE, REDESIGN. L’obiettivo di
fornire alle imprese strumenti utili in ottica sostenibile viene affrontato inquadrando le diverse analisi condotte nella tesi all’interno di due linee guida fondamentali: controllo dei costi e valutazione dell’impatto ambientale allo stesso tempo. Dunque, l’obiettivo è duplice e complesso: il solo
Introduction ... 1
Chapter 1 Sustainability: the secret ingredient of the new millenium ... 6
1.1. Sustainability and its promoter: UN ... 7
1.2. Sustainability in industrial context ... 11
1.3. Strategies for Sustainable Industrial Development ... 13
Chapter 2 Green and competitive: a macroeconomic point of view ... 20
2.1. Macroeconomic analysis: Environmental Management Accounting ... 21
2.2.1. Environmental Management Accounting ... 21
THE CASE STUDY ... 23
Chapter 3 Green and competitive: a microeconomic point of view ... 38
3.1. Microeconomic analysis: a model for estimating the environmental costs in a production system ... 39
3.1.1. The micoeconomic model ... 42
THE MODEL FOR FULL INDUSTRIAL COST ... 44
THE MODEL FOR FULL ENVIRONMENTAL COST ... 49
CASE STUDY A: an environmental analysis of ISPF ... 50
CASE STUDY B: an environmental analysis of bearings production by SKF .. 60
Chapter 4 Additive Manufacturing: the real breakthrough ... 67
4.1. Redesign and Remanufacture: two activities closely linked ... 68
4.2. Remanufacturing: traditional and innovative processes in comparison ... 69
THE CASE STUDY ... 78
4.2.2. Incremental Sheet Forming and Stamping processes ... 89
THE CASE STUDY ... 90
Chapter 5 The reuse of aluminium production swarfs: a new challenge ... 93
5.1. Aluminum recycling, the state of art ... 94
5.2. The direct conversion methods: compaction and extrusion ... 96
5.3. Primary aluminum or recylced one: the Alupack LTD case study ... 98
Conclusion ... 105
Figures’ index
Figure 1.1: Economy, Social and Environmental Sustainability ... 8
Figure 1.2: Sustainable Development Goals ... 11
Figure 1.3: Life Cycle Assessment ... 14
Figure 1.4: 6R Approach ... 15
Figure 1.5: 6R Approach between Cost and Environmental Impact Assessment ... 17
Figure 1.6: : Microeconomic and macroeconomic level of analysis ... 18
Figure 2.1: Environmental expenditure/costs and revenue/earnings ... 22
Figure 2.2: Italian manufacturing plants ... 24
Figure 2.3: Environmental company situation ... 31
Figure 2.4: I1, I2 and I3 distribution ... 34
Figure 2.5: , I4 and I5 distribution ... 36
Figure 3.1: Microeconomic and macroeconomic level of analysis ... 39
Figure 3.2: Qualitative decomposition of full industrial cost in cost items ... 42
Figure 3.3: Full industrial cost breakdown structure ... 43
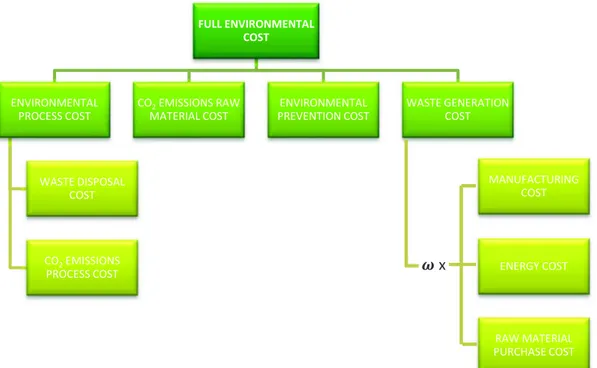
Figure 3.4: Full Environmental Cost breakdown structure ... 50
Figure 3.5:Incremental Sheet Forming equipment ... 50
Figure 3.6: Full industrial cost for ISPF process (percentage composition) ... 57
Figure 3.7: Full industrial cost vs Full Environmental cost changing 3D profile (feed rate = 3 m/min, depth step = 1 mm) ... 59
Figure 3.8: Full industrial cost vs Full environmental cost for changing feed rate (frustum of pyramid, depth step=1mm) ... 59
Figure 3.9: Full industrial cost vs Full environmental cost for changing depth step (frustum of pyramid, feed rate = 3m/min) ... 60
Figure 3.10: Example of SKF bearing ... 62
Figure 3.12: Environmental cost incidence on Full industrial cost ... 64
Figure 3.13: CPRODUCTION trend for the three analyzed dimensions ... 65
Figure 3.14: CRM DIRECT trend for the three analyzed dimensions ... 65
Figure 4.1: 6R Approach ... 68
Figure 4.2: Redesign and Remanufacture link ... 69
Figure 4.3: Additive manufacturing process ... 75
Figure 4.4: Power levels during the productive modes of an EOSINT P700 Selective Laser Sintering machine tool ... 77
Figure 4.5: Power profile of a turning process ... 78
Figure 4.6: Traditional design of a support for pivoting legs ... 78
Figure 4.7: Optimized design of a support for pivoting legs ... 78
Figure 4.8: Mazak Nexus 410 ... 80
Figure 4.9: EFERGY e2 ... 81
Figure 4.10: Machining working power ... 82
Figure 4.11: Working steps incidence on total time ... 82
Figure 4.12: Formiga P110 ... 83
Figure 4.13: Work temperature setting ... 83
Figure 4.14: Additive manufacturing working power ... 84
Figure 4.15: AM steps time distribution ... 85
Figure 4.16: Energy consumption for Machining and AM processes ... 86
Figure 4.17: Machining and AM energy consumption ... 86
Figure 4.18: Stamping process ... 90
Figure 4.19: Environmental cost incidence on Full industrial cost for Stamping and SPIF ... 91
Figure 5.3: Material recovery percentage for the two techniques ... 96
Figure 5.4: Cold compaction result in Alupack LTD ... 99
Figure 5.5: Cold compaction at DIMEG ... 100
Figure 5.6: Cold compaction result at DIMEG ... 100
Figure 5.7: Porthole process ... 101
Figure 5.8: Extruded profile ... 101
Figure 5.9: Tensile test ... 102
Tables’ index
Tables 2.1: Environmental expenditure/costs and revenue/earnings for the case study 24
Tables 2.2: Index 1 ... 33
Tables 2.3: Index 2 ... 33
Tables 2.4: Index 3 ... 34
Tables 2.5: Index 4 ... 35
Tables 2.6: Index 5 ... 35
Tables 3.1: Setup cost, unproductive cost, manufacturing cost ... 51
Tables 3.2: Indirect raw materials cost ... 52
Tables 3.3: Total tool cost ... 52
Tables 3.4: Energy cost ... 53
Tables 3.5: Process environmental cost ... 53
Tables 3.6: Production process cost ... 54
Tables 3.7: Direct raw material unit cost ... 55
Tables 3.8: Environmetal prevention cost ... 55
Tables 3.9: Full industrial cost ... 56
Tables 3.10: Environmental cost of waste generation ... 56
Tables 3.11: Full environmental cost ... 56
Tables 3.12: Experimental plane ... 58
Tables 3.13: Bearings diameters analyzed ... 63
Tables 3.14: Sensitivity analysis (diameter changing) ... 64
Tables 4.1: AM processes and Manufacturing in comparison ... 76
Tables 4.2: PA2200 characteristics ... 79
Tables 4.3: Machining and Additive Manufacturing machine steps ... 80
Tables 4.6: Energy consumption for the two processes ... 85
Tables 4.7: CO2 aliquots hypothesis ... 87
Tables 4.8: Machining and AM CO2 emissions compare ... 88
Tables 4.9: Experimental plane SPIF vs Stamping ... 90
Tables 5.1: Cold compaction process in Alupack ... 99
Tables 5.2: Alupack Economic Analysis ... 103
“Industry” is synonymous with one of the essential components of the process of civilization, and therefore indicates a phenomenon whose beginning can be traced back to about ten thousand years ago. “Industrialization” is considered a key component of the industrial revolution that is, a phenomenon that began to manifest itself at the most three centuries ago and from which descends the present world.
On the other hand, the industry has not yet emancipated from a double terrible finality that accompanied his birth: the first products industry were at once weapons and tools. Flints of the Early Pleistocene roughly machined served, in all probability, either to kill or to tear the animals; since then the same craftsman, the same worker, the same lab, the same workshop produced, separately or together, weapons and tools, swords and plows, tanks and tractors, missiles and space crafts. Moreover, often the weapon preceded the instrument. Recently, the production of work tools and consumer goods, for the volume that reached, has come to transform the industrial waste in dangerous poisons for humans and the environment. In addition, more or less short time away looms the danger of seeing the rapid development of industry land to paralysis due to the scarcity of natural resources [1].
It is of human the ability, the experience and the knowledge to limit the environmental damage caused by this important and fundamental industrialization process, so that the humanity can continue innovating, progressing and discovering, but also “living”. Hence, the growing and urgent attention to the worldview of sustainability in its three dimensions social, economic and environmental. The “industry” is the factor that most influences the sustainable balance of the world: on one side, it causes civilization, culture, knowledge. Development of skills and innovation with all that implies as better education, specificities of educational paths aimed at an easier and directed entry into the working world. Aggregation of the old villages in towns, cities, metropolis. All these implications and many others have been and will be directed by the industrialization phenomenon that has seen changing the world in a very short time. On the other hand, industrialization has led the world in a truly critical environmental situation. Therefore, the man had the ability to upset the world, both negatively and positively. However, it is necessary a global disaster to understand when react and addresses the progress in the right direction. It is what is happening from an environmental perspective. In particular, the industrial sector plays an important role in
the global economy (Energy Sectorial Consumption: 52% industrial, 14% residential, 7% commercial, 27% transport) [2]. So it becomes important monitoring its environment impact which increases from year to year and which is one of the most relevant percentage that determines the global pollution.
In this work, the problem of industrial processes sustainability is addressed from different points of view employing several case studies, experimental and real ones. The taken approach will give theoretical explanations related to research carried out so far in this area and, at the same time, will prove empirically what are the steps to take to address the production activities towards sustainability.
Therefore, in the first chapter the sustainability issue will be widely exposed, explaining the beginnings of the terminology and the first activities undertaken from this point of view. The discussion will focus on the organs that have the task to monitor this issue and the established global targets by the Nations. Finally, ample space to the issue of sustainability in industries will be given: how companies seek to transform their production in a sustainable direction and what are the macro strategies and activities undertaken for this purpose.
The second chapter will expose widely the macroeconomic aspect of the environmental choices made by companies. It is true, in fact, that a company has interest in monetization of all its activities. Therefore, it is necessary to show that converting the production in a sustainable direction is suitable not only under an environmental point of view but also in an economic one. As evidence of this, this paper offers several empirical tools available to draw conclusions. In the second chapter, the company's macro-economic aspect will address. An evaluation model of environmental costs already known in the literature will be considered, the Environmental Management Accounting (EMA). It will be applied to a real business case related to a manufacturing company, leader in the world in mechanical material production (SKF). The results provided by such a model are not exhaustive in practice for companies. Therefore, a serious of performance indexes will be added in order to give information that is more accurate to the companies that decide to take the way of environmental sustainability. In the third chapter, the issue of sustainability in business is dealt from a microeconomic point of view. In fact, if the macroeconomic side is important to understand how the
human resources, research & development, production plant size. On the other hand, it is essential to analyze the processes from below. Therefore, it is important to understand whether a production process generates too much production waste going to significantly raise the level of pollution; or if there is an excessive use of lubricants or if the machines are obsolete and so the energy consumption are excessive. All these factors become part of a detailed cost model that quantifies the emissions of CO2
generated by the finished products production, monetizing them. The model is comprehensiveness and universality and this is a fundamental aspect for a company. It is independent from where the company is located. It can consider m raw materials to realize n output product. Therefore, this model goes beyond all theoretical model known in literature, incorporating in it all possible aspects interesting for a company. This model is applied to two case studies: an experimental case and a real one. The first is conducted at the technical laboratories of Mechanical, Energy and Management Engineering Department (DIMEG) of University of Calabria. It provides for the calculation of the industrial full cost for an aluminum profile achieved through the innovative Incremental Sheet Forming Process (SPIF). The second case is referred to the production of industrial bearings for the company SKF. For both outputs will be carried on a sensitivity analysis in order to better understand which factors most affect the increase of environmental costs.
In the fourth chapter, the focus is on the comparison between traditional and innovative production processes. Often it is convinced that new technologies bring only benefits. In reality it is not always so. Therefore, a chapter that enters in the details of the new manufacturing process for 3D molding, which goes to replace old processes for chip removal or molding with die. It will be widely exposed the new production process in its various forms. Finally, it will be considered the production of a piece with traditional molding and with Additive Manufacturing. It will be assumed an optimum amount of production and analyzed the results. The second study case considered regards the comparison between Incremental Forming and Stamping of sheet metal. In addition, here, a sensitivity analysis will be conducted to better understand what are the influential factors from the environmental costs point of view.
Finally, in the fifth chapter, the recycling issue is dealt with. In the production chain, in fact, the last step, waste disposal, is today one of the most urgent factors for today's
population. The pollution has now reached exaggerated level and the waste produced by manufacturing firms contribute significantly to this factor. It has been noticed, however, that in many cases it is possible to recover the discarded material in different ways. Indeed, it is often cheaper to produce from recycled materials and not turn to the extractive industries. In this chapter, a case of this type will be presented, taking into consideration a food containers aluminum manufacturer.
Sustainability: the secret ingredient of the new
millennium
“Sustainability” is the ability to be maintained at a certain rate or level [3].
“Sustainable development” is development that meets the needs of the present without
compromising the ability of future generations to meet their own needs [4].
The principle of “The Three Pillars of Sustainability” says that for solving the complete sustainability problem all three pillars of sustainability must be sustainable. The pillars are social, environmental, and economic sustainability [5].
The previous lines contain the key official definitions related with the sustainability concepts and, consequently, with the sustainable activities worldwide.
In the following chapter, sustainability definition is going to be more thoroughly exposed. From the birth of the concept of sustainability to date, we will retrace the milestones of sustainable development throughout the world, focusing on the industrial sector, of our interest. We will try to understand how the sustainability concept has gradually transformed the companies’ behavior and as it often coincides with the inexpensiveness one for them.
1.1. Sustainability and its promoter: UN
The first time that attention was drawn to the need to preserve natural habitats to produce a sustained improvement in living conditions for all was in the UN Conference on the Human Environment in Stockolm in 1972.
The United Nations (UN) is the principal initiator and driver of sustainable development at the international level. It is an intergovernmental organization established on 24 October 1945 with the aime to promote international co-operation. Its objectives include: maintaining international peace and security, promoting human rights, fostering social and economic development, protecting the environment, and providing humanitarian aid in cases of famine, natural disaster, and armed conflict. UN established various specialized agencies to fulfill its duties. Some best-known agencies are the International Atomic Energy Agency (IAEA), the Food and Agriculture Organization (FAO), the United Nations Educational, Scientific and Cultural Organization, (UNESCO), the United Nations Children's Emergency Fund (UNICEF). A number of UN agencies and programmes are active in one or more areas of sustainable development, such as the UN Environment Programme (UNEP), the International Labour Organization (ILO), the World Health Organization (WHO) and the UN Development Programme (UNDP). Furthermore, it exists the High Level Political Forum on sustainable development (HLPF) with the aim to implement the sustainable development and strengthen the international governance.
But what is meant by sustainable development?
The official definition of <<sustainable development>>was published in 1987 with the
Brundtland Report by UN. Really, first of all, the sustainability problem born some time before from issues such as deforestation and natural landscape changing. In addition, the oil crises in 1970s and the following energy one stimulate to reflect on the excessive dependence on fossil fuels of the world economy and the need of having to turn to other forms of energy sources. Since this moment, expressions as <<ecology>> and <<energy
saving>> start to enter the common vocabulary. In 1972, the Club of Rome published its
report on «The Limits to Growth», which attracted enormous attention in the climate of the Stockholm Conference. It is now that in the international debate the issue of unsustainability of a development model that considers the planet as an inexhaustible
mine of resources at our disposal enters with force. Exactly in this year, 1972, the first UN conference on sustainability issues.
The UN milestones in sustainable development are the following [6]: - 1972: UN Conference on the Human Environment, Stockholm; - 1987: Brundtland Report;
- 1992: UN Conference on Environment and Development, Rio de Janeiro; - 1997: Rio+5 Conference, New York;
- 2002: UN World Summit on Sustainable Development, Johannesburg; - 2012: Conference on Sustainable Development Rio+20.
In 1992, 172 nations met in Rio de Janeiro at the United Nations Conference on Environment and Development (UNCED), to seek solutions to issues such as poverty, the growing gap between industrialized and developing countries, and growing environmental, economic and social problems. Here, Environmental conservation and social and economic development were all accorded equal weight.
Fig. 1.1: Economy, Social and Environmental Sustainability [7]
The participating countries signed three agreements and two conventions. Among theese, the Agenda 21, a global action plan for the 21st Century, divided into four sections: Social
and economic dimension, Conservation and management of resources for development, Strengthening the role of major groups and Means of implementation.
The Rio+5 Conference was the first comprehensive status review of work to implement the UNCED's agreements. This Conference aimed to revive and strengthen commitment to sustainable development, ascertain failures and identify the reasons in each case, recognize achievements, set priorities and determine problems that had not been addressed sufficiently in Rio.
The objective of the World Summit on Sustainable Development (WSSD) was to examine the implementation of resolutions made at the conference in Rio, with a particular focus on Agenda21. Problems such as social justice, dialogue between cultures, health and development were given greater weight than at the previous summits in Stockholm (1972) and Rio de Janeiro (1992). Furthermore, a clearer link was drawn between poverty and the state of the environment.
The international community wished to renew its political commitment to sustainable development, assess the progress to date and the gaps remaining in the implementation of the decisions made during previous conferences, and identify solutions to new challenges. The outcomes of the conference are recorded in the final fifty-page document entitled "The Future We Want”. The main outcomes are the following:
- a landmark decision has been taken in order to launch a process to define the sustainable development goals;
- the Rio document urges states to implement a green economy as an integral part of their sustainable development policy;
- a high-level political forum for sustainable development will be launched, replacing the current Commission on Sustainable Development;
- the United Nations Environment Programme (UNEP) will be strengthened. By the UN Conferences of 1992, 2002 and 2012, the 2030 Agenda was established on 25 September 2015, in order to end poverty, protect the planet, and ensure prosperity for all as part of a new sustainable development agenda was adopted. Each goal has specific targets to be achieved over the next 15 years. In the 2030 Agenda are defined the 17 sustainable development goals to transform the world [8]:
⋅ G2: End hunger, achieve food security and improved nutrition and promote sustainable agriculture.
⋅ G3: Ensure healthy lives and promote well-being for all at all ages.
⋅ G4: Ensure inclusive and equitable quality education and promote lifelong learning opportunities for all.
⋅ G5: Achieve gender equality and empower all women and girls.
⋅ G6: Ensure availability and sustainable management of water and sanitation for all.
⋅ G7: Ensure access to affordable, reliable, sustainable and modern energy for all. ⋅ G8: Promote sustained, inclusive and sustainable economic growth, full and
productive employment and decent work for all.
⋅ G9: Build resilient infrastructure, promote inclusive and sustainable industrialization and foster innovation.
⋅ G10: Reduce inequality within and among countries.
⋅ G11: Make cities and human settlements inclusive, safe, resilient and sustainable. ⋅ G12: Ensure sustainable consumption and production patterns.
⋅ G13: Take urgent action to combat climate change and its impacts.
⋅ G14: Conserve and sustainably use the oceans, seas and marine resources for sustainable development.
⋅ G15: Protect, restore and promote sustainable use of terrestrial ecosystems, sustainably manage forests, combat desertification, and halt and reverse land degradation and halt biodiversity loss.
⋅ G16: Promote peaceful and inclusive societies for sustainable development, provide access to justice for all and build effective, accountable and inclusive institutions at all levels.
⋅ G17: Strengthen the means of implementation and revitalize the Global Partnership for Sustainable Development.
Fig. 1.2: Sustainable Development Goals [8]
1.2. Sustainability in industrial context
Industry is central to the economies of modern societies and an indispensable motor of growth. It is essential to developing countries, to widen their development base and meet growing needs. Many essential human needs can be met only through goods and services provided by industry. The production of food requires increasing amounts of agrochemicals and machinery. Beyond this, the products of industry form the material basis of contemporary standards of living. Thus all nations require and rightly aspire to efficient industrial bases to meet changing needs. Industry extracts materials from the natural resource base and inserts both products and pollution into the human environment. It has the power to enhance or degrade the environment; it invariably does both.
Observing historical trend of industrial sector, there is a high grow of manufacturing sector production until 1973 with slight slowdown in the next ten years: especially manufacturing industry is more subject to this surge, followed by mining one, with the consequent increase of the environmental pollution. In subsequent years, this trend is reversed simultaneously with the more attention on environemtal impact: the industries start to produce more with less while the light industry takes greater importance [9]. In the light of the studies conducted on the pollution level of the planet, which is too high
reduce, control, and prevent industrial pollution will need to be greatly strengthened. If they are not, pollution damage to human health could become intolerable in certain cities and threats to property and ecosystems will continue to grow. Fortunately, the past two decades of environmental action have provided governments and industry with the policy experience and the technological means to achieve more sustainable patterns of industrial development. At the beginning of the 1970s, both governments and industry were deeply worried about the costs of proposed environmental measures. Some felt that they would depress investment, growth, jobs, competitiveness, and trade, while driving up inflation. Such fears proved misplaced. A 1984 survey by OECD (Organisation for Economic Co-operation and Development) of assessments undertaken in a number of industrial countries concluded that expenditures on environmental measures over the past two decades had a positive short term effect on growth and employment as the increased demand they generated raised the output of economies operating at less than full capacity. The benefits, including health, property, and ecosystem damages avoided, have been significant. More important, these benefits have generally exceeded costs.
However, to develop more sustainable societies, industries need to better understand how to respond to environmental, economic and social challenges and transform industrial behavior. The industrial world should follow a more environmentally and economically sustainable future for all manufacturing with a resilient industrial sector adapting to uncertain future conditions and operating their businesses in ways that do not compromise the needs of future generations. So it becomes important carrying out effective interdisciplinary research that delivers ideas, knowledge and solutions in management practice, technology and policy to create lasting impact for the whole manufacturing sector. To make this, some fundamental steps could be the following:
- Understanding factory performance and developing tools to drive effective reductions in the use of resources;
- Providing the systems and tools to design and manage the next generation of factories;
- Providing frameworks for sustainable business models;
- Enabling and driving sustainable industrial policy development.
Firms involved in food processing, iron and steel, non-ferrous metals, automobiles, pulp and paper, chemicals, and electric power generation - all major polluters have borne a
high proportion of the total pollution control investment by industry. Such costs provided a strong incentive for many of these industries to develop a broad range of new processes and cleaner and more efficient products and technologies. In fact, some firms that a decade ago established teams to research and develop innovative technologies to meet new environmental standards are today among the most competitive in their fields, nationally and internationally. Waste recycling and reuse have become accepted practices in many industrial sectors. Innovative products and process technologies are also currently under development that promise energy- and resource-efficient modes of production, reducing pollution and minimizing risks of health hazards and accidents. Not only have these industries become more efficient and competitive, but many have also found new opportunities for investment, sales, and exports. Looking to the future, a growing market for pollution control systems, equipment, and services is expected in practically all industrialized countries.
1.3. Strategies for Sustainable Industrial Development
Industrial growth is widely seen as inevitably accompanied by corresponding increases in energy and raw material consumption. In the past two decades, however, this pattern appears to have fundamentally changed. As growth has continued in the developed market economies, the demand for many basic materials, including energy and water, has levelled off; in some cases, it has actually declined in absolute terms. All this has been possible thanks to the sustainable development strategies undertaken by companies in order to limit pollution from the analysis of the entire life cycle of the product/service. In fact, industry and its products have an impact on the natural resource base of civilization through the entire cycle of raw materials exploration and extraction, transformation into products, energy consumption, waste generation, and the use and disposal of products by consumers. These impacts may be positive, enhancing the quality of a resource or extending its uses. Or they may be negative, as a result of process and product pollution and of depletion or degradation of resources.
Fig. 1.3: Life Cycle Assessment
LCA is a systematic set of procedures for compiling and examining the inputs and outputs of materials and energy and the associated environmental impacts directly attributable to the functioning of a product or service system throughout its life cycle. It is a technique for assessing the potential environmental aspects and potential aspects associated with a product (or service), by [10]:
- compiling an inventory of relevant inputs and outputs,
- evaluating the potential environmental impacts associated with those inputs and
outputs,
- interpreting the results of the inventory and impact phases in relation to the
objectives of the study.
Life-cycle assessment has emerged as a valuable decision-support tool for both policy makers and industry in assessing the cradle-to-grave impacts of a product or process. Three forces are driving this evolution. First, government regulations are moving in the direction of "life-cycle accountability;" the notion that a manufacturer is responsible not only for direct production impacts, but also for impacts associated with product inputs, use, transport, and disposal. Second, business is participating in voluntary initiatives which contain LCA and product stewardship components. Third, environmental "preferability" has emerged as a criterion in both consumer markets and government
procurement guidelines. Together these developments have placed LCA in a central role as a tool for identifying cradle-to-grave impacts both of products and the materials from which they are made.
Summarizing, LCA is today the basis of the company’s business restructuring in a sustainable direction: it suggests at what stage of a product/service life cycle must act in order to pursue the corporate goal of “sustainability”.
The next step is to understand which strategy to undertake on the basis of the results obtained from LCA analysis, with the help of 6R’s approach (fig. 1.4) [11]:
Fig. 1.4: 6R Approach
Six the activities which could change, if applied, the pollution history of the world:
- REDUCE: The first and most effective component of the waste hierarchy is reducing the waste created. Consumers are encouraged to reduce their waste by purchasing in bulk, buying items with less packaging and switching to reusable instead of single-use items. Businesses can adopt manufacturing methods that require fewer resources and generate less waste. In addition to benefiting the
environment, these efforts often offer consumers and businesses the financial incentive of lower expenses in purchases.
- REMANUFACTURING: The production process should adapt to the new sustainable trends, creating more streamlined and reusable products, resulting from the redesign and reuse activities. Therefore, the new production chains must be able to work recycled and recyclable raw material, not use indirect raw material with a high environmental impact and consume less energy.
- REUSE: Despite efforts to reduce the amount of waste generated, consumers and
businesses still create substantial waste. The U.S. Environmental Protection Agency (EPA) estimates that in 2013, Americans generated about 254 million tons of trash [12]. Much of this waste can immediately be reused to minimize the strain on the environment and municipal waste management. For example, consumers can refill a purchased bottle of water with water from home to minimize the number of plastic bottles being discarded. Consumers have a financial incentive here as well, as municipal water is far cheaper than bottled water.
- RECOVER: If it is not possible use the decommissioned product as it is discarded, a suitable alternative is to use its parts to realize something else.
- RECYCLE: When waste is eventually discarded, segregating items for recycling from other waste is important. Recyclables include glass, newspaper, aluminum, cardboard and a surprising array of other materials. Lead, for example, has one of the highest recycling rates because of laws requiring the recycling of lead-acid batteries.
- REDESIGN: It is foundamental re-design the good or service in a more sustainable way, considering the recyclable materials that could be used to make the product and the need to reduce the amount of raw material used in production (in order to facilitate the next reduce activity).
The six activities described are linked by a cyclic relation.
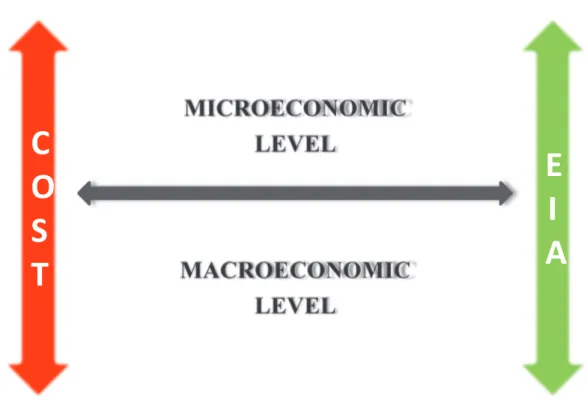
To define the strategy which a company have to pursue to become more sustainable, it is imprortant to choose basing on two main aspects togheter: costs and environmental impact (fig. 1.5).
The core of the 6R approach is to consider all the six “R” activities under the dual profile of costs and environmental impact. In fact, for companies, it is essential to quantify and monetize all the aspects concerning it: only in that way it can do the appropriate considerations for own business. To make this, two are the cost levels considered in a company: macroeconomic and microeconomic ones.
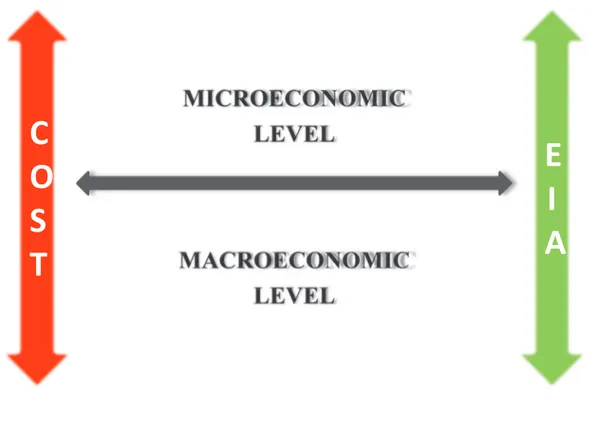
In a company, macroeconomic considerations are the study of the behavior of the whole (aggregate) enterprise with its different economic activities. It is concerned primarily with the forecasting of company income, through the analysis of major economic factors that show predictable patterns and trends. These factors include taxes, depreciation for equipment, human resource, research and development investments and other aspects. At microeconomic level, the considerations are different and become more varied and complex as the level of detail lowers. Therefore, the study is referred to individual units of an enterprise (such as a human resource, a product, or a factory line) and not of the aggregate business ones (which is the domain of macroeconomic level). It is primarily
concerned with the single factors as the various cost rates of a goods, how the single rates could influence the total product cost and so what actions the decision makers must take. In the light of the above, the economic and environmental analysis, at enterprise level, must be conducted in two respects: microeconomic and macroeconomic ones (fig. 1.6).
The two different approach will first be dealt at a theoretical level and then be presented by a real case.
The macroeconomic analysis will be conducted through the Environmental Management Accounting (EMA) method, devised by Christine Jasch, who wrote about it in 2003 [13], enriching it with a set of performance indexes appropriately formulated.for this method, a case study will be introduced in order to better understand the method application end the suggestions proposed.
Moreover, the problem will be discussed through a microeconomic model to calculate the environmental cost. This model has been formulated by the research group of Mechanical, Energy and Management Engineering Dipartment (DIMEG) research. For this important tool to, two cases of study will be implemented and analysed.
The macroeconomic point of view will be presented in the chapter 2. Information about microeconomic analysis will be explained in chapter 3 of this thesis.
Green and Competitive:
the macroeconomic point of view
“The need for regulation to protect environment gets widespread but grudging approval: widespread because everyone wants a livable planet, grudging because of the lingering belief that environmental regulations erode competitiveness”.
Corporate social responsibility has evolved through the years. Much more than doing charity work, most companies are now implementing green measures because they just have to do: it improves corporate image, shows they care and it is what customers demand. Companies believe that “it is their responsibility to do so”. The companies have undertaken many eco-works: improve energy efficiency, making products and services more sustainable, calculate their carbon footprint, and, very important, the increase in companies reporting on sustainability. The reasons for going green are not a one-way thing: companies are not adapting sustainability practices just because they are concerned about the environment but because it benefits them too, and in a great way.
Several tools are used for this purpose: environmental accounting systems, performance indexes, cost evaluation models. This chapter and the next will proposed methods to monitor the companies’ sustainability level.
2.1. Macroeconomic analysis: Environmental Management Accounting
To obtain the whole perception of the enterprise environmental situation, several authors designed important methods to monitor sustainability enterprise issues and many companies adopted important actions in order to improve their sustainability performances; the last actions, in particular, were performed for economic returns [14], but also for imagine coming back and for consumer perception purposes [15]. At macroeconomic level, environmental cost models were introduced in conjunction with environmental certification systems. The ISO 14001 standard contemplates procedures for managing and reducing environmental impacts through the Environmental Management Systems (EMSs), which can be implemented in every country in the world [16]. The Eco-Management and Audit Scheme (EMAS) technique, similar to ISO method, is designed to obtain changes in relation with environmental performance and it is available, furthermore, in Europe [15]. The GRI Sustainability Reporting Guidelines offers Reporting Principles, Standard Disclosures and an Implementation Manual for the preparation of sustainability reports by organizations. In 2001, the United Division for Sustainable Development published the Environmental Management Accounting Procedures and Principles, together with guide and checklists for its applications, in order to present the concepts of EMA method. Christine Jasch wrote about this innovative method in 2003 [13]: it represents an approach that provides for the transition of data from financial accounting, cost accounting and mass balance in order to improve the environmental corporation situation.
2.1.1. Environmental Management Accounting
As the author suggests, the EMA method considers the material flow as a money flow. Accordingly, it is important not only to monitor the financial situation of the enterprise, but also to understand the intrinsic mechanisms of the enterprise, like material and machine use, energy consumption and/or other important characteristics. To do this, a complete scheme like the one reported in fig. 2.1, can be used. All dimensions involved in environmental accounting are included. The model is a matrix where the lines are the cost/revenue items, incurred by the firm, and the columns represent the origin of them.
Fig. 2.1: Environmental expenditure/costs and revenue/earnings [17]
Accordingly, with the previous table, the difference between the total environmental expenditures and the total environmental revenues gives the final measurement of the enterprise sustainability. The result is a delta , which indicates how much sustainable is the analyzed company:
(1) The model so implemented produces a measurement ( ), which does not provide useful information to understand the weaknesses. Several studies were carried out about the direct link between EMA implementation and the improvement of environmental corporate characteristics [18] [19] [20]. All case studies confirmed the goodness of EMA method, as presented in the state of the art. However, the information provided by the EMA method is a good starting point to obtain more detailed and useful data for business economic purposes. In order to highlight the aspects that need to be improved, a relation between the EMA result ( ) and other quantitative parameters has to be created. Consequently, the proposed work aims to overcome this important limit, giving some guidelines oriented to get useful the information generated from EMA model. As widely known from the literature [21], there are not absolute key performance indexes for evaluating enterprise behaviour. Since each firm consists of different conditions and characteristics, a universal form for the performance measurement can not be defined. Before designing the right KPIs, which have to be used, the context and the available information need to be evaluated. Starting from the basic and the well-known performance indexes, the appropriate ones will be created.
According to that, in the present work the Environmental Management Account will be applied to a complex case study characterised by a multi-site reality; subsequently, some performance considerations, based on original indexes, will be customised in order to analyse the multi-plant company in a more homogeneous way. The proposed approach is not related to the case study, but can be applied to analyse and understand how the environmental issues are performed in multi-plant and multi country companies.
THE CASE STUDY
To proceed with the analysis, an industrial leader company, operating in bearings and seals manufacturing, mechatronics, services and lubrication systems, is considered. A multi plants structure, with plants, warehouses, business units and sells channels placed all over the world characterizes it. To simplify the analysis and better focus on the method, only the Italian bearings manufacturing plants are studied. For these plants, the balance data sheets are available and they contain all information useful to implement the EMA method.
Fig. 2.2 reports the Italian sites of the company; the dimension of each plant is different and is proportional with the dimension of the icons on the map.
Many balance information and data sheet about the company and about its units are available (for the year 2014) even if it is often necessary to introduce some hypotheses in order to implement the method chosen for the analysis in the correct way.
For sake of simplicity, in the case study here analysed, the distinction among the possible cost/revenue item origins is not considered. There will be only one column in the matrix, the total one. For each Italian plant (considering a numeration going from the biggest plant to the smallest one), the model is applied providing the results summarised in Table 2.1.
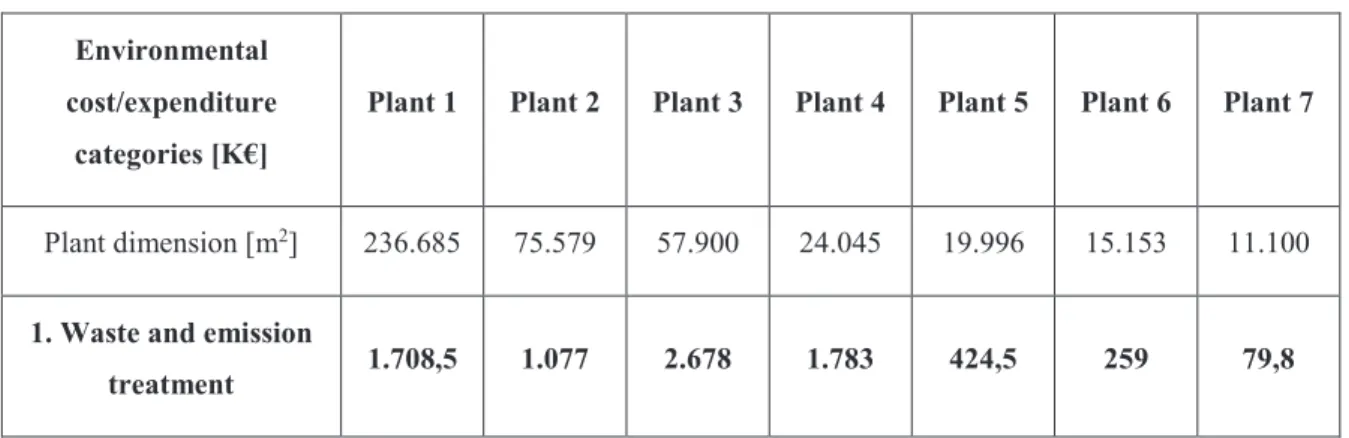
Table 2.1: Environmental expenditure/costs and revenue/earnings for the case study
Environmental cost/expenditure
categories [K€]
Plant 1 Plant 2 Plant 3 Plant 4 Plant 5 Plant 6 Plant 7
Plant dimension [m2] 236.685 75.579 57.900 24.045 19.996 15.153 11.100
1. Waste and emission
treatment 1.708,5 1.077 2.678 1.783 424,5 259 79,8
1.1. Depreciation for
related equipment 384,7 105,3 82,8 34,4 29,2 22,7 17,1 1.2. Maintenance and
operating materials and services
76,93 21,06 16,55 6,87 5,83 4,53 3,41
1.3. Related personnel 775 575 1.650 1.275 150 75 25 1.4. Fees, taxes, charges 322,49 164,12 356,2 113,05 113,04 57,08 8,41 1.5. Fines and penalties - - - - 1.6. Insurance for
environmental liabilities 73,39 198,2 572,66 308,62 126,4 99,97 25,87 1.7. Provisions for
clean-up costs, remediation 66 13,4 0 45,4 0 0 0
2. Prevention and environmental management
8.758,5 3.043 3.045 3.044 3.042 3.042 3.042
2.1. External services for environmental management 1,457 1,081 3,102 2,397 0,282 0,140 0,001 2.2. Personnel for general environmental management activities 214 214 214 214 214 214 214 2.3. Research and development 8.543 2.828 2.828 2.828 2.828 2.828 2.828 2.4. Extra expenditure
for cleaner technologies - - - - 2.5. Other environmental
3. Material purchase value of non-product output 39.312 46.408 27.177 11.005 3.125,5 5.075 1.845 3.1. Raw materials 18.128 14.001 16.960 6.101 2.173 4.398 375 3.2. Packaging 0 0 0 0 4,862 0 0 3.3. Auxiliary materials 812 386 197 0 817 182 0,870 3.4. Operating materials 641 0 1.355 0 55,38 0 7,2 3.5. Energy 17.977 8.752 8.624 4.886 1.293 638 1.455 3.6. Water 1.754 65 41 18 74 21 3 4. Processing costs of non-product output 31.013 15.232 30.653 6.689 6.683 4.819 40,82 Environmental expenditure 80.792 65.760 63.550 6.689 10.462 13.195 5.007 5. Environmental revenues (-) 114.264 15.085 21.554 4.858 2.453 1.566 357 5.1. Subsidies, awards - - - - 5.2. Other earnings 114.264 15.085 21.554 4.858 2.453 1.566 357 Environmental revenues 114.264 15.085 21.554 4.858 2.453 1.566 357 - 33.472 50.674 41.996 17.663 8.009 25.002 4.650
Below, the detailed explanation of all highlighted lines in Table 2.1, according with the available explicit information about the company and the assumption or inferences made.
a. Waste and emission treatment a.1 Depreciation for related equipment
In the “related equipment” are included the cost of the useful tools installed by the company in the last years with the aim of becoming more sustainable. Specifically the installation aims to monitor, to automate, to control and to reduce CO2
emissions. The main tools are:
- Permanent and mobile CO2 emissions monitoring tools (one each 100 m2);
- Infrared thermograph tool for each plant; intelligent lightings (one each 10 m2);
- Automatic ignition tool in presence of a transportation trolley (one each 10 m2);
- High energy efficiency trolley battery (one each 100 m2);
- Pressure controllers for the power of the elevators (one each 100 m2);
- Methane system replacement with a new technology (only for plant 2); - Compressed air activation and illumination automation (one each 100 m2);
- Compressed air tool replacement with a new technology (only for plant 3). These investments belong to the under “general and particular equipment” item in the company report: so the depreciation rate is 10%.
a.2 Maintenance and operating materials and services
Also for this item, a percentage of the investment made for waste and emission treatment equipment is considered. It is equal to 2% of the total amount.
a.3 Related personnel
The available data does not give this value so it has been estimated as the ratio between the raw material waste and the annual work salary.
a.4 Fees, taxes, charges
As required by law, it is necessary to have two environmental supervisors to monitor the correct environmental behavior of the company. The related cost is equal to 50.000 € for each unit and allocated to each plant based on the percentage of the produced waste. Moreover, the rate related with certifications, obtained to ensure an efficient behavior of the company, is included here. This rate changes according with the plant dimension and its performances.
a.5 Fines and penalties
The company is very performing in environmental area; thus, the value of this item is null, as inferable from its reports.
a.6 Insurance for environmental liabilities
These costs include the company funds for environmental risk, equal to 1.406.000€ for the Italian sites. Based on the ratio between solid waste produced and raw material introduced, this amount is allocated to each plant
a.7 Provisions for cleanup costs, remediation
In this area, the asbestos disposal costs for plant 1, 2 and 4 are included. b. Prevention and environmental management
b.1 External services for environmental management
This item is composed of the training costs for the “related personnel”. It includes also the cost of the no-working time because of the training.
b.2 Personnel for general environmental management activities
For each plant there are two persons related with environmental activities: the Energy Manager and the Sustainable Manager. Moreover, in each country, where manufacturing plants are settled, as in Italy, an Environmental Health and Safety (EHS) Country Coordinator works. In each plant, a number of 2,14 persons is allocated with a unitary salary equal to 100.000€.
b.3 Research and development
This item is not expressed in the available company reports, but has been calculated considering that in the biggest plant, 5 on 70 R&D employees are full-time engaged on sustainability aspects. More in particular, for each plant, the 0,2% of personnel is committed in environment R&D area and its cost is elaborated allocating the total R&D cost based on person’s distribution.
b.4 Extra expenditure for cleaner technologies
This item should include those environmental expenditures, which have not been included before, but which the company pays for.
b.5 Other environmental management costs Equal to zero for the investigated case study. c. Material purchase value of non-product output
The selected enterprise is very careful to environment issues. Accordingly, in this area it is possible to compare the percentages of material recycled on the total one (in “material” all the following 3.x items are included). Here, the costs attributable to that part of the output, which is scrap and not product, is summarized. c.1 Raw materials
Among the different outputs of the production process (grinding scarfs, production metal scraps, turning chips and other metal scraps), only the first one is not very recycled. To quantify this value, the purchase cost of the metal used to manufacture the output (steel 52100) is considered.
c.2 Packaging
The plants totally recycle the packaging, which includes “paper, carton, and plastic container”. Plant 5 is the only exception since it does not recycle the plastic container.
c.3 Auxiliary materials
Among auxiliary materials there are the oils used as lubricant during the production. These could not be recycled and their cost is estimated according to their purchase cost.
c.4 Operating materials
In this area, there are “electrical and electronic equipment”, “used oils” and “tools”. For each one and for each plant there are different recycling percentages, all of them valued at their own purchase cost.
c.5 Energy
The energy consumed in each plant is not renewable. Therefore, its cost has to be totally considered according to the energy purchase cost.
d. Processing costs of non-product output
To estimate the process costs for non-output product, a double allocation is made. According to the company balance sheet, related with the considered working year, the total production cost for Italian plants is firstly subdivided among the plants, according with the total raw material quantity purchased by them. Subsequently, for each plant, only a percentage of the production cost is added: the rate between the waste quantities on raw material one.
e. Environmental revenues e.1 Subsides, awards
This amount is null because the Italian plants do not collect any monetary award. e.2 Other earnings
The earnings obtained by the company are based on the commercialization of its waste with a sell price equal to the 50% of the purchase cost. Among the non-product output sold there are grinding scarfs, non-production metal scraps, other metal scraps, turning chips, paper and carton, plastic container, electrical and electronic equipment, used oils and buildings material, in different quantity for each plant. Below, a complete overview to understand what the environmental situation of the company is.
As shown in Fig. 2.3, the first plant is the better one: its has a negative value. This indicates that the revenues from environmental activities give a gain bigger than the expenditures. This is an important result since it means that the plant is efficient and it benefits from the adoption of a sustainability behavior.
For the other plants, observing the presented values on the table is not enough; in fact, it could seem that the plant 7 is the best one, among the last six in the table, but it is also the smallest plant and this explains why the value is low. This observation leads to understand that this simple balance, given by value, is not adequate to give a right and appropriate evaluation of the environmental situation of a multi-plant company. For this reason, the company should provide a set of performance indexes in order to go over the first level analysis, by considering the same from the network point of view.
PERFORMANCE INDEXES AND RESULTS
As announced in the second section, in a company an excellent management system does not exist since the optimization of one objective is often in opposition with other important company issues. In that case, a trade-off could be defined in order to obtain the best solution in relation with the company purpose.
Accordingly, a set of appropriate indexes is here provided, with the aim of giving the possibility to evaluate contemporary more aspects of the company behavior. In the following analysis, there is not the observation on Plant 1 because of its already high level of performance.
First, the presented work proposes three simple key performance indexes: I1, I2 and I3.
They are formulated considering already known measurement of performance:
- Productivity measured on the number of employees working in production area; - Plant dimension in term of square meter;
- Input quantity of raw material entered into the production cycle. All of those were considered in relation with the EMA application output ( ).
Index 1:
Table 2.2: Index 1
Plant 2 Plant 3 Plant 4 Plant 5 Plant 6 Plant 7
Number of employees 354 347 502 143 88 178
50.674 41.996 17.663 8.009 25.002 4.650
I1 143,15 121,03 35,19 56,01 284,11 26,13
The value expresses the company losses. Dividing this value for the number of employees is an expression of the quantification of their individual loss. Looking at Table 2, Plant 7 seems to be the better. Anyway, in this plant, the quantity of raw material in input (as company report suggests) is smaller than the other; therefore, the I1 indicator
does not allow getting a good perception of the plant performances.
Index 2: $
!% & '( #( (3)
Table 2.3: Index 2
Plant 2 Plant 3 Plant 4 Plant 5 Plant 6 Plant 7
Plant dimension [m2] 75.579 57.900 24.045 19.996 15.153 11.100
50.674 41.996 17.663 8.009 25.002 4.650
I2 0,67 0,73 0,73 0,40 1,65 0,42
In this case, the rate represents the loss for each square meter of the plant. Thus, Plant 5 gets the best performance. In addition, here, it is not possible to give an absolute evaluation, because of the other plant characteristics.
Table 2.4: Index 3
Plant 2 Plant 3 Plant 4 Plant 5 Plant 6 Plant 7
Input Raw Material [ton] 5.771 3.988 1.614 3.945 3.592 117
50.674 41.996 17.663 8.009 25.002 4.650
I3 8,78 10,53 10,94 2,03 6,96 39,75
With the third index, Plant 5 provides the best performance. On the contrary, the Plant 7, which had a good position for I2 (the second), is here the worst.
The following histogram summarizes all the three indexes.
Fig. 2.4: I1, I2 and I3 distribution
It is clear that the indicators here presented are not adequate to give a complete and plausible explanation of the company situation. Each one gives a different plant picture and it is not possible to establish which the plant with the best performances is. In conclusion, the simple key performance indicators, as productivity in its different expressions, are is not sufficient to give a real judgment for a multi plants enterprise, because they do not link the performance evaluations to each other.
Accordingly, more complex and complete indexes have to be customized. # .# . # # # .
The next two indexes, I4and I5, involve the parameter trying to consider all the factors
influencing the firm environmental performances, as suggested by Christine Jasch.
Index 4: + ( & %* %& (%!
! " #
, (5)
Table 2.5: Index 4
Plant 2 Plant 3 Plant 4 Plant 5 Plant 6 Plant 7
Input Raw Material [ton] 5.771 3.988 1.614 3.945 3.592 117
Number of employees 354 347 502 143 88 178
50.674 41.996 17.663 8.009 25.002 4.650
I4 3.109,5 3.655 5.494 289,6 612,5 7.075
With I4, the enterprise dimension is quantified through the rate between the input raw
material and the number of employees, without considering the plant dimension, in terms of square meters.
Index 5: - . /01234 52647 83094 :25 ;247:821, < (6)
Table 2.6: Index 5
Plant 2 Plant 3 Plant 4 Plant 5 Plant 6 Plant 7
Input Raw Material [ton] 5.771 3.988 1.614 3.945 3.592 117
Plant Waste [ton] 378,14 755,17 164,72 165,37 118,74 1
50.674 41.996 17.663 8.009 25.002 4.650
This index expresses an efficiency measurement for each plant, based on the quantity of waste generated in proportion to the input of raw material.
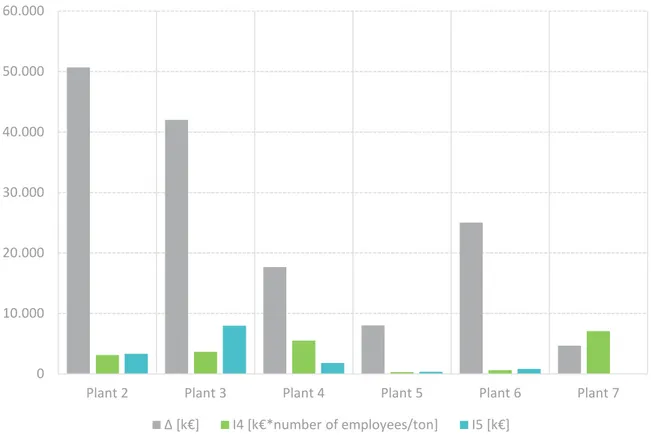
The following figure summarized results:
Fig. 2.5: , I4 and I5 distribution
These values could be considered more objective than the previous indexes, because consider all that parameters which characterize the enterprise, as the number of employees or the quantity of raw materials processed or the level of produced waste.
Based on the previous histogram, it is evident how the delta indications are often very different from the KPIs. From a comparison between Plant 2 and Plant 7, the following considerations: Plant 2 has a very high delta and this could suggest, according to EMA method, that it is less powerful than Plant 7 which has a delta very small. Actually, I4
indicates the Plant 7 has a disproportionate relationship between labor and raw material processed: the number of employees is too high compared to the incoming raw materials. This demonstrates that just the delta is not able to provide an objective and totally correct interpretation of the business situation.
Finally, the result is that Plant 5 provides the best performances, in relation with the features considered, while Plant 3 is the worst one. Plant 5 has the size factor (I4) and the
# .# ### # ### # ### # ### # ### # ### !
production efficiency (I5) values lower than the others. Moreover, Plant 3 has high value
of both and customized KPIs. Naturally, the proposed method allows performing a sort of classification among the different plants, but at the corporate level, each company should specify its environmental targets determining an appropriate trade-off according to its needs and skills.
Green and Competitive:
the microeconomic point of view
“Microeconomics is the social science that studies the implications of individual human action, specifically about how those decisions affect the utilization and distribution of scarce resources.” [22]
In this chapter, this generic concept will be referred to the company reality. In fact, nowadays industries are submit to new legislation and regulations requests imposing more efficiency of the production processes; this means think to the process in a sustainable way. In this context, it becomes very important to estimate additional environmental costs to bear. At the same time, the need to define a global, unique and integrated model, which is independent from the process types, and from the production country is more pressing. With this perspective, here a microeconomic model, product, process and country independent, which includes the environmental rate into the product unit cost, will be presented. It gives the firms an accurate instrument allowing them to estimate the environmental costs connected with their production in a simple and correct way, so to have a realistic view of the true total environmental internal costs. Two kind of cases study will be presented in order to better understand the method’s utilization.
3.1. Microeconomic analysis: a model for estimating the environmental costs in a production system
In the first chapter of this work, the difference between the two types of approaches used to address the problem of industrial processes sustainability has been extensively dealt. In this chapter, the attention will be focused on microeconomic considerations.
The need to define a global, unique and integrated model, which is independent from the process types and from the production country, is more pressing in a social and business context in which the knowledge and the monetization of environmental expenditure that companies held up assumes a strategic relevance. In literature, different are the formulations or partial models, which propose a solution for the evaluation of production and environmental costs, associated with an output product. However, a worldwide recognized index, which allows having a standard and complete measurement of all costs included the environmental ones, does not exists. In fact, strong simplification or the focus on specific case study characterize the preliminary attempts already proposed (Duflou et al., 2012 [23], Branker et al., 2011 [24], Gutowski et al., 2006 [25]). In this study, the idea behind the model is to create a cost function, which overcomes the
limitation of a single process or of a specific product configuration, making it available to every type of product, production and country.
In literature, there are many models for the evaluation of environmental costs for a production process but for all of them there are initial hypothesis or they are limited to investigate specific cost sources. Below, the explanation of the already known studies conducted, useful for the new model.
Energy consumption and GHG emissions are the most investigated factors from the
scientific community and five studies are particularly worth of note.
Rajemi et al. (2010) [26] estimated the energy consumption for a machining process.
Their model estimates the total energy consumed during manufacturing as the sum of five rates of energy cost:
where is the setup energy, is the energy absorbed during the process, is the energy consumed during the tool change, and are the energy used for tools and raw materials production respectively.
Anderberg et al. (2010) [27], who divided the process energy in direct and indirect rates, proposed another important distinction in energy classification. Rahimifard et al. (2010) [28], instead, considered direct energy as the sum of theoretical energy and supporting auxiliary energy. Finally, Abele et al. (2005) [29] estimated the total energy demand during the process equal to:
h h
Where is the theoretical needed energy, which represents the minimum energy demand of the production process, and and ! " !# stand for the additional energy demands of the machine tool and peripherals respectively.
One of the most used method for the evaluation of GHG emissions is the Carbon Emission Signature (CES) one, proposed by Jeswiet and Kara (2008) [30]. It directly connects the process energy with carbon emissions and allows quantifying carbon emissions during the manufacturing phase through the product of energy consumption and $ % factor. The last quantifies carbon emission considering the weighted sum of used primary sources (coal, natural gas, oil). As regards the GHG emissions during the machine tool lifecycle
![Fig. 1.2: Sustainable Development Goals [8]](https://thumb-eu.123doks.com/thumbv2/123dokorg/2873067.9560/21.892.210.760.136.480/fig-sustainable-development-goals.webp)
![Fig. 2.1: Environmental expenditure/costs and revenue/earnings [17]](https://thumb-eu.123doks.com/thumbv2/123dokorg/2873067.9560/32.892.183.750.137.938/fig-environmental-expenditure-costs-and-revenue-earnings.webp)