2019
Publication Year
2020-12-23T16:57:35Z
Acceptance in OA@INAF
3C 294 revisited: Deep Large Binocular Telescope AO NIR images and optical
spectroscopy
Title
Heidt, J.; Quirrenbach, A.; Hoyer, N.; Thompson, D.; Pramskiy, A.; et al.
Authors
10.1051/0004-6361/201935892
DOI
http://hdl.handle.net/20.500.12386/29183
Handle
ASTRONOMY & ASTROPHYSICS
Journal
628
Number
https://doi.org/10.1051/0004-6361/201935892 c ESO 2019
Astronomy
&
Astrophysics
3C 294 revisited: Deep Large Binocular Telescope AO NIR images
and optical spectroscopy
?
,
??
J. Heidt
1, A. Quirrenbach
1, N. Hoyer
1, D. Thompson
2, A. Pramskiy
1, G. Agapito
3, S. Esposito
3, R. Gredel
4,
D. Miller
2, E. Pinna
3, A. Puglisi
3, F. Rossi
3, W. Seifert
1, and G. Taylor
31 Landessternwarte, Zentrum für Astronomie der Universität Heidelberg, Königstuhl 12, 69117 Heidelberg, Germany e-mail: [email protected]
2 LBT Observatory, University of Arizona, 933 N. Cherry Ave, Tucson, USA 3 Arcetri Astrophysical Observatory, Largo E. Fermi 5, 50125 Firence, Italy 4 Max-Planck-Institut für Astronomie, Königstuhl 17, 69117 Heidelberg, Germany
Received 15 May 2019/ Accepted 18 June 2019
ABSTRACT
Context. High redshift radio galaxies are among the most massive galaxies at their redshift, are often found at the center of protoclus-ters of galaxies, and are expected to evolve into the present day massive central cluster galaxies. Thus they are a useful tool to explore structure formation in the young Universe.
Aims. 3C 294 is a powerful FR II type radio galaxy at z= 1.786. Past studies have identified a clumpy structure, possibly indicative of a merging system, as well as tentative evidence that 3C 294 hosts a dual active galactic nucleus (AGN). Due to its proximity to a bright star, it has been subject to various adaptive optics imaging studies.
Methods. In order to distinguish between the various scenarios for 3C 294, we performed deep, high-resolution adaptive optics near-infrared imaging and optical spectroscopy of 3C 294 with the Large Binocular Telescope.
Results. We resolve the 3C 294 system into three distinct components separated by a few tenths of an arcsecond on our images. One is compact, the other two are extended, and all appear to be non-stellar. The nature of each component is unclear. The two extended components could be a galaxy with an internal absorption feature, a galaxy merger, or two galaxies at different redshifts. We can now uniquely associate the radio source of 3C 294 with one of the extended components. Based on our spectroscopy, we determined a redshift of z= 1.784 ± 0.001, which is similar to the one previously cited. In addition we found a previously unreported emission line at λ6749.4 Å in our spectra. It is not clear that it originates from 3C 294. It could be the Ne [IV] doublet λ2424/2426 Å at z = 1.783, or belong to the compact component at a redshift of z ∼ 4.56. We thus cannot unambiguously determine whether 3C 294 hosts a dual AGN or a projected pair of AGNs.
Key words. instrumentation: adaptive optics – galaxies: active – galaxies: high-redshift – quasars: emission lines – quasars: individual: 3C 294
1. Introduction
Within the standard unified scheme for active galactic nuclei (AGN), radio galaxies are seen at relatively large inclination angles between the observer and the jet axis (Urry & Padovani 1995). Since most of the optical emission from the central engine is shielded by the dusty torus, they can be used to study their host galaxies and immediate environment in better detail than their low-inclination counterparts. This is particularly important for powerful radio galaxies at high redshifts, which are among the most massive galaxies at their redshift (Overzier et al. 2009). ? The reduced AO J,H, and K s-images and optical spectra shown in Fig. 3 and 4 are only available at the CDS via anonymous ftp
tocdsarc.u-strasbg.fr(130.79.128.5) or viahttp://cdsarc.
u-strasbg.fr/viz-bin/qcat?J/A+A/628/A28
??
The LBT is an international collaboration among institutions in the United States, Italy, and Germany. LBT Corporation partners are: The University of Arizona on behalf of the Arizona Board of Regents; Istituto Nazionale di Astrofisica, Italy; LBT Beteiligungsgesellschaft, Germany, representing the Max-Planck Society, The Leibniz Institute for Astrophysics Potsdam, and Heidelberg University; The Ohio State University, and The Research Corporation, on behalf of The University of Notre Dame, University of Minnesota, and University of Virginia.
They are expected to evolve to present day massive central clus-ter galaxies and are often found at the cenclus-ter of (proto)clusclus-ters (seeMiley & De Breuck 2008for a review). Recently, even a radio galaxy at z= 5.72 close to the presumed end of the epoch of reionization has been found by Saxena et al. (2018). Thus studies of these species allow us to investigate the early forma-tion of massive structures in the young Universe.
3C 294 is a powerful Fanaroff-Riley type II (FRII) radio source at z= 1.786. It shows a z-shaped morphology at λ6 cm, has extended Lyα-emission, which is roughly aligned with the radio jet axis (McCarthy et al. 1990), is embedded in extended diffuse X-ray emission indicative of a high-density plasma region (Fabian et al. 2003), and is surrounded by an apparent overdensity of faint red galaxies (Toft et al. 2003).
Due to its proximity to a bright star useful for adaptive optics (AO) imaging, 3C 294 has been intensively studied using the Keck, Subaru, and Canada France Hawaii (CFHT) tele-scopes. High-resolution H and K images of the 3C 294 system have been presented and discussed by Stockton et al. (1999),
Quirrenbach et al.(2001), andSteinbring et al.(2002). There is common agreement across all studies that the 3C 294 morphol-ogy can best be described by two or three components separated by ≤100, indicative of a merging system. It is unclear, however,
A&A 628, A28 (2019) which of the components coincides with the location of the radio
source, mostly due to the uncertain position of the reference star used for the astrometry. In addition, some of the components are compact, others extended, adding more uncertainty to a unique assignment of the counterpart to the radio source. The situation became even more complex after an analysis of archival Chandra data of 3C 294 byStockton et al.(2004), who found the central X-ray emission to be better represented by two point sources. They argued that 3C 294 hosts a dual AGN, one unabsorbed tem associated with a compact component and one absorbed sys-tem associated with one of the extended components.
Small separation (a few kiloparsec) bound dual AGN are pre-dicted to be rare in general (seeRosas-Guevara et al. 2019). On the other hand, as discussed inKoss et al.(2012), the percentage of dual AGN can be up to 10%, but they are difficult to detect in particular at high redshift due to their small projected sep-aration. In fact, only a few high-redshift (z > 0.5) dual AGN are known (Husemann et al. 2018, and references therein). If 3C 294 were to evolve to a present day massive central clus-ter galaxy, one would assume that its mass would grow mostly via major mergers in the hierarchical Universe. Since supermas-sive black holes seems to reside at the centers of all massupermas-sive galaxies (Kormendy & Ho 2013), one could expect that 3C 294 hosts a dual AGN. Thus a confirmation would be an important detection.
To unambiguously determine the properties of the 3C 294 system and in particular to test whether it is a dual AGN or an AGN pair, we carried out high-resolution adaptive optics (AO) supported imaging in the near-infrared (NIR) zJHK s bands, as well as deep optical low-resolution spectroscopy using the Large Binocular Telescope (LBT), the results of which are presented here. We note that the AO data discussed above were taken about 15 years ago. Since then adaptive optics AO systems and NIR detectors have become much more mature and efficient. The only spectroscopic investigation of 3C 294, byMcCarthy et al.
(1990), dates back more than 25 years and was carried out using the Shane 3 m reflector. Thus a revisiting of the 3C 294 system should give a clear answer.
Throughout the paper, we assume a flatΛ cold dark matter (ΛCDM) cosmology with H0= 70 km s−1Mpc−1andΩM= 0.3.
Using this cosmology, the angular scale is 8.45 kpc per arcsec-ond at z= 1.786.
2. Observations and data reduction 2.1. NIR AO imaging data
High-resolution FLAO (first light adaptive optics,Esposito et al.
(2012)) supported data of 3C 294 were recorded in the zJHKs filters with the NIR imager and spectrographs LUCI1 and LUCI2 at PA = 135◦ during a commissioning run on March 20, 2016 and during a regular science run on March 20, 25, and 29, 2017. In both LUCI instruments, we used the N30-camera, which is optimized for AO observations. With a scale of 0.0150 ± 0.000200pixel−1, the field of view (FoV) offered was
3000× 3000. The observing conditions were very good during all of the nights, with clear skies and ambient seeing of 100 or
less.
The LUCI instruments are attached to the front bent Grego-rian focal stations of the LBT. The LBT offers a wide range of instruments and observing modes. It can be operated in monoc-ular mode (using one instrument and mirror only), binocmonoc-ular mode (using identical instruments on both mirrors), or interfer-ometric mode (light from both telescopes combined in phase).
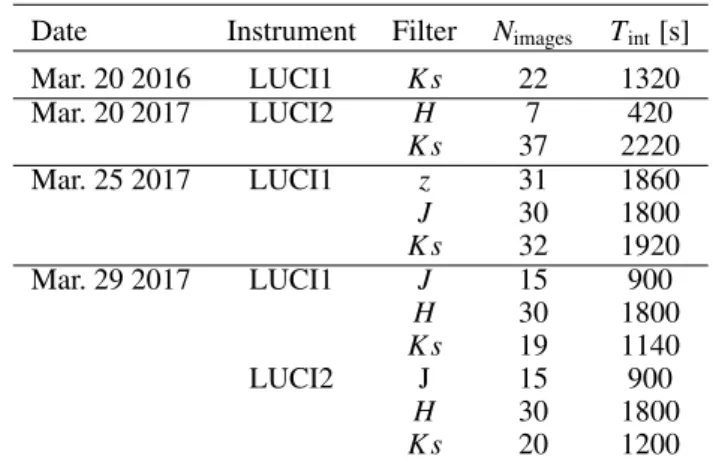
Table 1. Breakdown of the observations by date, instrument, and filter.
Date Instrument Filter Nimages Tint[s]
Mar. 20 2016 LUCI1 K s 22 1320 Mar. 20 2017 LUCI2 H 7 420 K s 37 2220 Mar. 25 2017 LUCI1 z 31 1860 J 30 1800 K s 32 1920 Mar. 29 2017 LUCI1 J 15 900 H 30 1800 K s 19 1140 LUCI2 J 15 900 H 30 1800 K s 20 1200
A complete description of the current instrument suite at the LBT and its operating mode can be found in Rothberg et al.
(2018). The data obtained on March 20, 2016 and March 20 and 25, 2017 were taken in monocular mode, while the data from March 29, 2017 were taken in binocular mode. For the latter, the integrations and offsets were done strictly in parallel.
The FLAO system senses the atmospheric turbulence by means of a pyramid-based wavefront sensor, which samples the pupil on a grid of 30 × 30 subapertures. A corrected wavefront is obtained through an adaptive secondary mirror controlled by 672 actuators at a frequency of up to 1 kHz. As a reference star we used the 12th mag star U1200–07227692 from the United States Naval Observatory (USNO) catalog USNO-A2.0 (Monet 1998), which is just 1000southwest of 3C 294. Given its brightness, the
FLAO system corrected 153 modes with a frequency of 625 Hz. At this distance of the target from the reference star and with this FLAO configuration, a Strehl ratio of about 30–40% is expected in H and Ks bands (Heidt et al. 2018). U1200–07227692 is a binary star with 0.13500separation and a brightness ratio of 1:1.6
(Quirrenbach et al. 2001), but this did not affect the performance of the FLAO system.
Individual LUCI exposures were one minute each, consist-ing of six images of 10 s that were summed before savconsist-ing. On any given night, integrations between 7 and 37 min in total were taken in one filter before moving to the next. Table1 gives a log of the observations. Between each one-minute exposure the telescope was shifted randomly within a 200 by 200 box to com-pensate for bad pixels. Since the bright reference star is the only object in the field present in one-minute integrations, larger o ff-sets would not have made any difference as the detector is par-ticularly prone to persistence. The small offsets made sure that none of the images of 3C 294 fell on a region on the detector affected by persistence from the bright reference star. In Table2
a breakdown of the total integration times by filter and instru-ment is given.
The data were first corrected for non-linearity using the pre-scription given in the LUCI user manual, then sky-subtracted and flat-fielded. Sky-subtraction was achieved by forming a median-combined two-dimensional sky image out of all data in one filter set, then subtracting a scaled version from each individual expo-sure. Given the fine sampling of 000. 015 pixel−1 scale, we saw
only about 10 counts s−1in the H and K s bands. With such low backgrounds there would have been no benefit in using a running mean or a boxcar for the sky subtraction. Flatfields were created out of sets of higher and lower background twilight images taken at zenith, which were separately median-combined after scaling A28, page 2 of9
Table 2. Total integration times per filter and instrument and for both instruments combined.
Filter LUCI1 [s] LUCI2 [s] Ttotal[s]
z 1860 – 1860
J 2700 900 3600
H 1800 2220 4020
Ks 4380 3420 7800
Notes. Combined exposure times range from 31 min to over 2 h.
Fig. 1.Left: image and channel crosstalk images of the reference star
U1200−07227692. The center of the reference star is indicated as source. These crosstalk images have separations of exactly 64 pixels, the width of each of the 32 parallel amplifier channels of the LUCI HAWAII2-RG detector. The well-separated images of the individual components of the reference star are remarkable. Right: logarithmic image of the center of the reference star to show the two components separated by 000.135. The Ks-band image is taken at PA = 135◦
.
them, subtracted from each other, and normalized. Finally, the images were corrected for bad pixels by linear interpolation. A bad pixel mask was created out of the highly exposed flatfields to identify cold pixels and dark images to identify hot pixels.
The most difficult part of the data reduction was the stack-ing of the images. Except for the saturated AO reference star and the barely visible radio galaxy, no further objects are present on the reduced images that could be used for the alignment of the images. We thus explored three alternative possibilities for the alignment: (a) to use the world coordinate system (WCS) infor-mation given in the image headers; (b) to use a two-dimensional fit to the centers of both saturated components of the reference star after masking the saturated pixel at their centers; and (c) to take advantage of the channel crosstalk shown by the detec-tor, which leaves a non-saturated imprint of the reference star in every channel of the detector on the frame (see Fig.1).
The simple approach using the WCS information failed, likely because of residual flexure within LUCI, resulting in a visibly “smeared” image of the reference star. We thus did not pursue this approach further. Each of the two alternative methods has its advantages and disadvantages. Determining a centroid of a sat-urated core leaves some uncertainty but it benefits from a high signal-to-noise ratio (S/N) in its outer parts. The individual chan-nel crosstalk images have a lower S/N, but combining 10–15 of them from adjacent channels increases the signal consider-ably. We tested both methods using a data set taken in the Ks filter. The resulting offsets agree within 1/10 of a pixel. Given that we opted for integer pixel shift before combining the images, both methods delivered equally good results for our purposes. In the end we decided to use the offsets derived from the centroids to the cores of the two components of the reference star.
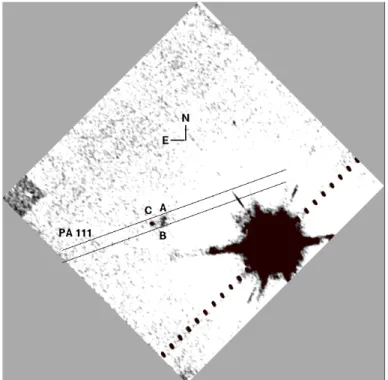
Fig. 2.Orientation of the slit with respect to the 3C 294 system for the
MODS spectroscopy.
The aligned images were first combined per filter, instru-ment, and night, then per filter and telescope, and finally per fil-ter. The relative orientation of the detector on the sky between the two instruments differs by less than one degree. In addi-tion, the pixel scale between the N30 cameras in LUCI1 and LUCI2 differs by less then 10−4. Thus no rotation or rebinning was applied before combining the data sets from the different instruments.
2.2. Optical spectroscopy
Optical longslit spectra of the 3C 294 system were taken on the night of May 11–12, 2016 using the multi-object double CCD spectrographs MODS1 and MODS2 (Pogge et al. 2010) in homogeneous binocular mode. The MODS instruments are attached to the direct Gregorian foci at the LBT. The target was observed at PA = 111◦ in order (a) to have all components of the 3C 294 system in the slit, (b) to see whether components a, b, and c are at the same redshift, and (c) to minimize the impact of the nearby bright star on the data quality (see Fig.2for the configuration of MODS1/2 and Fig.3 for more details on the components). To do so, we performed a blind offset from the bright reference star, with the offset determined from the AO K-band image. The expected accuracy of the positioning is ∼000. 1. We used a 100 slit and the gratings G400L for the blue
and G670L for the red channel, giving a spectral resolution of about 1000 across the entire optical band. Integration times were 3 × 1200 s. Observing conditions were not photometric with variable cirrus, but excellent seeing (∼000. 7 full width at half
maximum (FWHM)).
The basic data reduction (bias subtraction and flatfield-ing) was carried out using the modsCCDRED-package devel-oped by the MODS team (Pogge 2019). The extraction of one-dimensional spectra was carried out using the standard image reduction and analysis facility (IRAF) apall task. As the spectra of 3C 294 did not show any continuum (Fig.4) and were
A&A 628, A28 (2019)
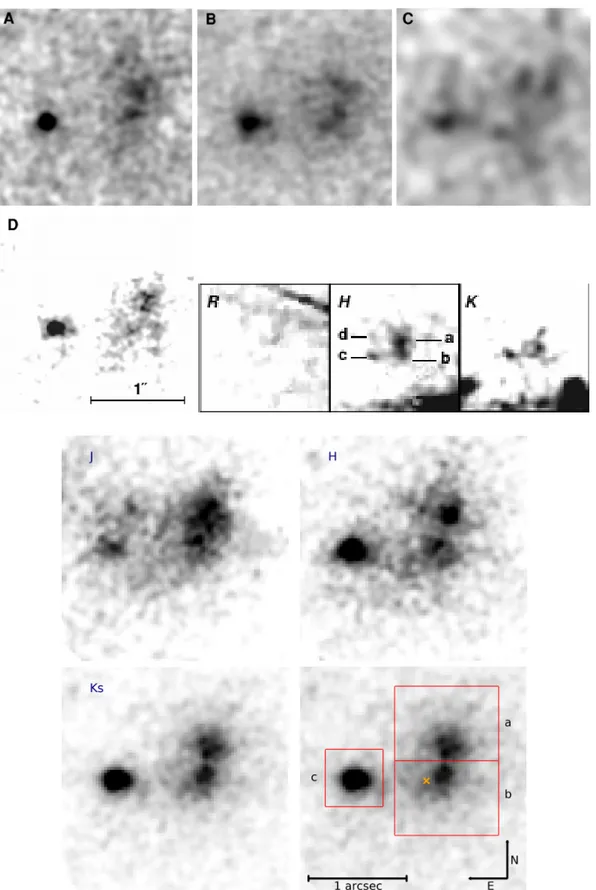
Fig. 3.Two uppermost rows: AO NIR images of 3C 294 from earlier publications. Panel A: Keck II NIRSPEC K0
image fromStockton et al.
(2004), Panel B: Subaru IRCS K0
image also fromStockton et al.(2004), Panel C: CFHT Hokupa K0
image fromStockton et al.(1999), and Panel D: Keck II SCam H-band image fromQuirrenbach et al.(2001). The images A-D are adapted fromStockton et al.(2004). The three images right of image D show R (HST), H, and K CFHT PUEO data fromSteinbring et al.(2002). Two lowest rows: our LBT FLAO and LUCI JHK s-images of 3C 294. The fourth image shows the scale, orientation, and apertures for the components used for the photometric analysis. They are 36 × 26 pixel (000.54 × 000.39) for components a and b and 20 × 20 pixel (000.3 × 000.3) for component c. The labeling followsSteinbring et al.(2002). The cross marks the position of the radio core, its size reflects its positional error.
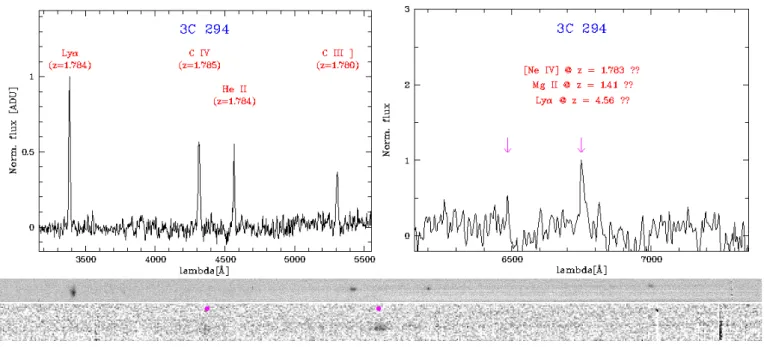
Fig. 4.Top panel: our one-dimensional MODS spectra of the 3C 294 system in the blue (left) and (red) channel with the line identifications. The positions of the two emission features at λ6485 and λ6749.4 Å discussed in the text are indicated by arrows. Bottom panel: our two-dimensional MODS spectrum of the 3C 294 system in the blue channel (upper panel) showing the four emission lines as well as an excerpt of the two-dimensional spectrum in the red channel (lower panel) showing the emission line detected at λ6749.4 Å. The blue spectrum is shown across its full spectral range, the red spectrum with an identical width then the one-dimensional spectrum centered on the line at λ6749.4 Å. The two emission features are labeled by magenta dots.
taken through variable cirrus, we did not carry out a spectropho-tometric flux calibration. Wavelength calibration was done using spectral images from calibration lamps and verified using the night sky emission lines. The resulting accuracy was ∼0.1 Å rms. The resulting spectra were first averaged per telescope and chan-nel and then combined per chanchan-nel.
3. Results
3.1. AO NIR images of 3C 294
The final AO J-, H-, and K s-band images are shown in the lower part of Fig. 3. They have been binned by a factor of two to emphasize structures more clearly.
As discussed in Quirrenbach et al. (2001) and Steinbring et al. (2002), 3C 294 can be separated into two main compo-nents separated by about 100: a compact core-like structure to the
east and a structure elongated north–south to the west. The elon-gated structure seems to consist of two knotty components also separated by roughly 100. No emission from 3C 294 was detected in the z-band image. This is probably due to the shallow depth of the image, the much lower Strehl ratio, and/or the increasing extinction compared to the redder bands. We note that 3C 294 has only barely been detected in optical broadband images with the Hubble Space Telescope (HST) (mR = 23.4 ± 0.8,Steinbring
et al. 2002).
Contrary to earlier observations, the two components of the western component are clearly separated. A comparison of ear-lier H- and K-band images with our data is shown in Fig.3.
We do not see a clear separation of the western structures in the J band. The reason for that is not clear. It cannot be due to extinction by dust as the H and Ks bands would be less affected by that (K s band probes the rest-frame wavelength at ∼7700 Å and J band probes the rest-frame wavelength at ∼4400 Å). It is more likely due to the lower Strehl ratio, which is expected to
drop by 10–20% between the H band and the J band. We do not detect the component d north of component c discussed in
Steinbring et al.(2002) in any of our images. We should have detected it in the H band as both components have a similar brightness in this filter according to Steinbring et al. (2002). Thus, feature d is either a transient phenomenon or is not phys-ical, that is, it is a statistical noise fluctuation. There may, how-ever, be some (very blue?) emission northwest of component c in the J-band image, which is not at the same location as component d.
The core-like component c appears slightly extended in an east–west direction on the images. This can also be seen in data from other telescopes shown in Fig.3. Its measured FWHM is 000. 31 × 000. 20 in the H band and 000. 23 × 000. 17 in the Ks band.
If component c were a pure point source, we would expect a FWHM of about 000. 08 at 1000 from a 12th mag reference star
(Heidt et al. 2018). Interestingly, the major axis of the elonga-tion is perpendicular to the one seen for the reference star in Fig. 1. The latter is most likely due to vibrations of the tele-scope (Miller, priv. comm.) and present on some of the indi-vidual images. The former could be due to tilt anisoplanatism as it is along the axis joining the reference star and compo-nent c.Olivier & Gavel(1994) derived a formalism to estimate the tilt anisoplanatism for the Keck telescope. Using their esti-mates and scaling them to the LBT (8.4 m) and wavelength (K s, 2.15 µm), we would expect a tilt anisoplanatism of 000. 022 and
000. 019 in x and y-direction, respectively. We would thus expect
the FWHM of component c to be on the order of 000. 10–000. 12
with an axis ratio of ∼1.2. This is much smaller then what we measure. We thus believe that component c is most likely not stellar.
This is in contrast to Quirrenbach et al.(2001) who found component c to be unresolved. Unfortunately, due to the small separation of the two components of the reference star (000. 135)
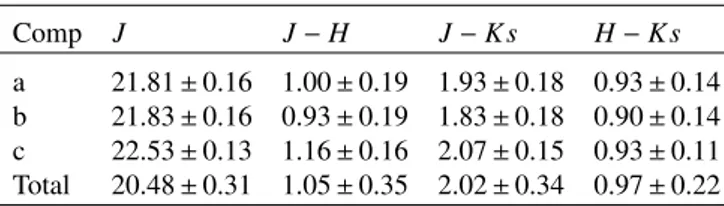
A&A 628, A28 (2019) Table 3. JHK s photometry of 3C 294 and its components.
Comp J J − H J − K s H − K s
a 21.81 ± 0.16 1.00 ± 0.19 1.93 ± 0.18 0.93 ± 0.14 b 21.83 ± 0.16 0.93 ± 0.19 1.83 ± 0.18 0.90 ± 0.14 c 22.53 ± 0.13 1.16 ± 0.16 2.07 ± 0.15 0.93 ± 0.11 Total 20.48 ± 0.31 1.05 ± 0.35 2.02 ± 0.34 0.97 ± 0.22
comparison. A formal Gaussian fit to each of the two compo-nents of the reference star ignoring the central saturated pixels (22 pixels for the brighter and 11 pixels for the fainter compo-nent) results in a FWHM of ∼000. 08.
Judging from the images, component c seems to be redder than components a and b. To verify this we performed aperture photometry on the individual components using the apertures indicated in Fig.3. Calibration was done using star P272–D from
Persson et al. (1998); the data have been corrected for galactic extinction followingSchlafly & Finkbeiner(2011). It is ≤0.01 mag in all bands.
The results shown in Table3indicate that components a and b have similar brightnesses and colors, while component c is about 0.7 mag fainter and about 0.2 mag redder. Photometry of the entire system has been presented byMcCarthy et al.(1990),Stockton et al.(1999),Quirrenbach et al.(2001),Steinbring et al.(2002), and Toft et al.(2003). A comparison to our data is shown in Table4. There is a wide spread in the photometry, with di ffer-ences of up to ∼1 mag in particular toToft et al.(2003). It is not clear where the differences in the photometry come from. Unfor-tunately, the size of the aperture used is not always given.
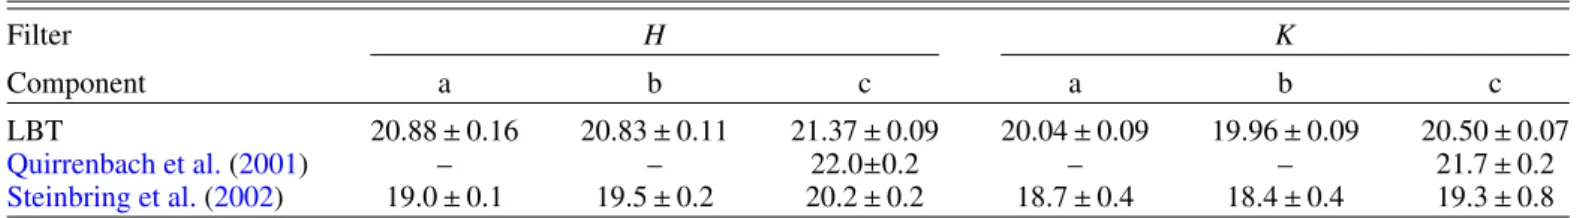
Photometry of individual components have been derived by
Quirrenbach et al.(2001) andSteinbring et al.(2002). A com-parison to our data is shown in Table5. The difference between theQuirrenbach et al.(2001) andSteinbring et al.(2002) data is large, approximately two magnitudes, while our measurements are somewhere in between. Again, the size of the aperture used is not given for either the Keck-data or CFHT-data.
We also created J − H, H − K s, and J − K s color maps for 3C 294 to search for any evidence of spatially-dependent extinction in the three components. No obvious feature was detected.
3.2. Optical spectra of the 3C 294 system
The one-dimensional and two-dimensional spectra of the 3C 294 system are shown in Fig. 4. Despite our 2 h integration time, we do not detect any obvious continuum. When rebinning the spectra in spectral and spatial direction by a factor of five, a hint of continuum can be glimpsed in the red channel. However, with this rebinning, the potential continuum of components a, b, and c would overlap, preventing us from distinguishing between the two components (see below). We detected the Lyα λ1215 Å, C IV λ1550 Å, He II λ1640 Å, and C III] λ1907/1909 Å lines in the blue channel. The C III] line is blue-shifted with respect to the other lines. This is not unusual in AGN (e.g.,Barrows et al. 2012) and may be a result of the increased intensity of the tran-sition at λ1907 Å relative to the one at λ1909 Å at low densities (Ferland 1981).
Only one emission line at λ6749.4 Å can be detected in the red channel. It is faintly present in the individual spectra from both MODS instruments and is not an artifact of the data reduc-tion. Under the assumption that it originates from the same source as the emission lines in the blue channel, we identify this
line with the Ne [IV] doublet λ2424/2426 Å at z = 1.783. Sim-ilarly to our C III] λ1907/1909 Å line in the blue channel we would not be able to separate the double lines individually given an instrumental resolution of ∼5 Å. If the identification is cor-rect, we may even associate the very faint emission at λ ∼ 6485 Å with C II] λ2326 Å at z ∼ 1.788. The position of this line coin-cides with a forest of night-sky emission lines, however, so this detection is tentative. To our surprise, we do not detect Mg II λ2798 Å in our spectra, which we would expect at λ ∼ 7790 Å. However, Mg II is relatively weak in radio galaxies (McCarthy 1993) and line ratios can vary strongly in high-redshift radio galaxies (Humphrey et al. 2008).
Ignoring the redshift determination for the C III] λ1907/ 1909 Å line and the uncertain identification of the C II] λ2326 Å line, our redshift for 3C 294 is z= 1.784 ± 0.001. This is some-what lower then the redshift z= 1.786 quoted byMcCarthy et al.
(1990), who did not quote errors. With their instrumental resolu-tion of ∼12–15 Å, an error for their redshift δz of at least 0.001 is a fair assumption. Thus our redshifts for 3C 294 agree within the errors. We will use z = 1.784 as the redshift for 3C 294 for the remainder of the paper.
Similarly to McCarthy et al. (1990), we see a spatially extended (600) Lyα line. Unfortunately, since the spectra of com-ponents a and b overlap in dispersion direction, we cannot probe any dynamics using this line.
The absence of a continuum poses the problem of a unique assignment of the emission line at λ6749.4 Å to one of the com-ponents of 3C 294. To derive this, we did the following: we first fitted a slope through the centers of the emission lines in the blue channel except for the spatially extended Lyα line. We then did the same through the trace in both channels of a well-exposed star observed on the same night to infer the spatial offset. Afterwards we determined the spatial offset between the trace of the star in the blue and the red channels to finally estimate the expected position of the trace of either component in the red channel at λ6749.4 Å. It turned out that the line emission at λ6749.4 Å is about 4 ± 2 pixels above the expected trace of components a and b and about 3 ± 2 pixels below the expected position of component c. Thus we cannot unambiguously tell whether the line at λ6749.4 Å originates from the same source as the other UV lines and thus assign it to components a and/or b or c.
4. Discussion
4.1. Which component is associated with the radio source? There has been no common agreement as to which of the com-ponents of the 3C 294 system is indeed the NIR counterpart of the radio source. Using a position of the radio source of α, δ = 14h06m44s.074 ± 0.005, +34s ◦2504000. 00 ± 000. 05 (2000) based on
McCarthy et al.(1990),Stockton et al.(2004) found it practically coincident with component b. On the contrary,Quirrenbach et al.
(2001) associated the radio source with component c. Their posi-tions of the radio core and the reference stars differed by +000. 07
and+000. 5 from the ones used byStockton et al.(2004),
respec-tively. The main difference for the position of the reference star comes from the sources used (HST FGS observation byStockton et al. 2004and the USNO–A2.0 catalog byQuirrenbach et al. 2001). It is surprising thatQuirrenbach et al.(2001) associated the radio source with component c although they found a smaller separation between the reference star and the radio source than
Stockton et al.(2004). As can be seen from Fig.2, component b is closer to the reference star than component c.
Table 4. Comparison of JHK photometry of the entire 3C 294 system. Filter J H K0 K s K LBT 20.48 ± 0.31 19.43 ± 0.17 – 18.56 ± 0.14 – McCarthy et al.(1990) – – – – 18.0 ± 0.3 Stockton et al.(1999) – – 18.3 ± 0.3 – – Quirrenbach et al.(2001) – 19.4 ± 0.2 18.2 ± 0.2 – – Steinbring et al.(2002) – 18.2 ± 0.3 – – 17.76 ± 1.0 Toft et al.(2003) 19.53 ± 0.30 18.64 ± 0.27 – 17.78 ± 0.07 – Notes. To derive the magnitudes fromSteinbring et al.(2002), the fluxes from components a, b, and c have been summed.
Table 5. Comparison of HK photometry of components a, b, and c of the 3C 294 system.
Filter H K
Component a b c a b c
LBT 20.88 ± 0.16 20.83 ± 0.11 21.37 ± 0.09 20.04 ± 0.09 19.96 ± 0.09 20.50 ± 0.07
Quirrenbach et al.(2001) – – 22.0±0.2 – – 21.7 ± 0.2
Steinbring et al.(2002) 19.0 ± 0.1 19.5 ± 0.2 20.2 ± 0.2 18.7 ± 0.4 18.4 ± 0.4 19.3 ± 0.8 Notes. The K images have been taken through different filters (see Table4) but the differences are small and did not affect the large differences seen between the individual measurements.
The most accurate position for the reference star comes from the Gaia Data Release 2 (DR2) (Prusti 2016; Brown 2018), which gives α, δ = 14h06m43s.356, +34◦1102300. 273 (2000) with
an error of about 0.05 mas for α and δ each. The proper motion is α, δ= +8.80, 1.66 mas yr−1. Since the spatial resolution of the
GaiaDR2 is about 000. 4, the binary star is not resolved and we can
assume that the position given above refers to the center of light. This position is in very good agreement with the one determined byStockton et al.(2004).
Using the coordinates of the reference star from the Gaia DR2 and the radio coordinates of 3C 294 fromStockton et al.
(2004), we can now predict the position of the radio core of 3C 294 on our AO NIR images. We used the crosstalk images of the reference star to predict the position of the center of light of the binary star with an accuracy of ±1 pixel (±000. 015). The
result is shown in Fig.3. As inStockton et al.(2004), our result indicates that the NIR counterpart to the 3C 294 radio source is component b. The overall error budget (accuracy of center of light for the reference star in our images, errors of the positions for the reference star and the radio source) does not exceed 000. 1,
meaning that component c can be ruled out as the NIR counter-part with high confidence.
4.2. Nature of the NIR counterpart of 3C 294
We are now convinced that (at least) component b is the NIR counterpart to the radio source. We also know that extended redshifted Lyα emission centered on the radio core has been detected (McCarthy et al. 1990). In addition, since our spec-troscopic results agree well with McCarthy et al. (1990), the redshift of z = 1.784 for 3C 294 is now solid. There is agree-ment that components a and b show a non-stellar morphology. These components are clearly separated in our H- and K s-band data. Given our spatial resolution and the distance of 3C 294, we cannot decide whether components a and b represent two galaxies in the process of merging, whether they correspond to a single galaxy with an absorption feature along the line of sight, or whether they are two galaxies at different redshifts.
Surprisingly, both components have similar brightnesses and colors. At z = 1.784, our JHKs images correspond roughly to rest-frame BVI-data. With B−V ∼ 1.0, components a and b seem to be dominated by late stars of type K and M. If we assume that components a and b are galaxies, we obtain MK ∼ −25.3
from their K s-band magnitudes of ∼20.0. This includes a lower limit for the K-band correction of K= −0.5 (which is between K = 0 and −0.5 depending on galaxy type; Poggianti 1997;
Mannucci et al. 2001) at z = 1.784. No evolutionary correc-tion has been applied. We note that this is an upper limit for the host galaxy of 3C 294 as we do not know the contribution of the active nucleus to the total flux. If 90/50/10% of the flux from component b is from the host galaxy, we would derive MK ∼ −25.2/−24.6/−22.8. This is between 2 mag brighter and
0.4 mag fainter than a M∗
K galaxy (Mortlock et al. 2017).
4.3. Nature of component c
What is the nature of component c?Stockton et al.(2004) dis-cussed the intriguing possibility that 3C 294 hosts two active nuclei. This idea stems from an analysis of archival Chandra data, where the X-ray emission from 3C 294 could better be described by a superposition of two point sources. Based on the X-ray/optical flux ratio, they argued that component c is unlikely to be a foreground galactic star but could well host a second active nucleus. We found component c about 0.8 mag brighter thanQuirrenbach et al.(2001), but even then its X-ray/optical flux ratio of ∼1.1 indicates that the source is rather an AGN then a star using the arguments ofStockton et al.(2004). If it is a star, it could be a carbon star. These stars are often found in symbi-otic X-ray binaries (e.g.,Hynes et al. 2014) and have very red V − Kand H − K colors similarly to what we found (Ducati et al. 2001). However, with V − K ∼ 5, and MV ∼ −2.5 typical for
carbon stars (Alksnis et al. 1998), the distance modulus would place our “star” well outside our Galaxy. In addition, compo-nent c appears extended in our data supporting an extragalactic origin.
A&A 628, A28 (2019) Unfortunately, the results from our spectroscopy are of little
help. We now know that the radio core coincides with compo-nent b. It is thus reasonable to assume that the UV lines detected in the blue channel, which have also be seen byMcCarthy et al.
(1990), originate from that region. We note that (McCarthy et al. 1990) used a 200wide slit at PA = 200◦, which means that their spectra of components a, b, and c overlapped in spectral direc-tion. As discussed in Sect.3.2, we cannot unambiguously assign the emission line at λ6749.4 Å to component b or c based on its spatial location. Given its spectral position one can reasonably assume that this line originates from the same region as all the other UV lines, namely from component b. If this is the case, the nature of component c remains a mystery.
Although speculative, we briefly discuss the consequences if the emission line at λ6749.4 Å belongs to component c. One exciting alternative would be that the line originates from the Ne [IV] doublet λ2424/2426 Å at z = 1.783 from this compo-nent. This would make 3C 294 indeed a dual, perhaps bound AGN separated by a few kiloparsec as discussed by Stockton et al. (2004). However, they speculated that the AGN coinci-dent with component c is less powerful but does not suffer so much from extinction. In that case one would expect to see the UV lines (in particular Lyα, which is typically a factor of ∼60 stronger than Ne [IV] λ2424/2426 Å in radio galaxiesMcCarthy 1993) in the blue channel, unless they are unusually weak. An inspection of the two-dimensional spectrum in the blue channel did not reveal any second component in spatial direction. Thus we do not have strong support for the dual AGN scenario based on our spectroscopy.
If not at the same redshift, component c could be at a di ffer-ent redshift. Given the faintness of the optical counterpart and emission line, and showing X-ray emission, it most likely origi-nates from an AGN. Judging from the composite AGN spectrum of Vanden Berk et al.(2001), the most prominent lines in the optical are Hα, Hβ, the [O II, O III] lines, and Mg II. Out of these, it cannot be Hα at z= 0.029, because its NIR luminosity would be much too low unless it suffers from extreme absorp-tion. It also cannot be Hβ at z= 0.38 because then we should have seen Hα at λ9054 Å, which is normally much stronger, and/or the [O II] or [O III] lines at λ3727 and λ5007 Å, respectively. The same argument applies for the [O III] line at z= 0.35. The [O II] line at z= 0.81 would be an interesting possibility. The typically much stronger Hβ and O [III] lines would be shifted towards λ9000 Å, where there is a strong forest of night-sky emission lines. However, one would then easily see Mg II λ2798 Å, which is normally also stronger then [O II]. Thus, Mg II λ2798 Å, which would be at z= 1.41, remains as the most reasonable line identification. All optical emission lines redward of Mg II are redshifted beyond λ9000 Å and are thus hard to detect or are out of the optical range. Only the C IV and C III] UV lines remain. These would be redshifted to λ3735 and λ4600 Å, respectively, but are not present in our spectra. These lines are often faint or not present in type II quasi stellar object (QSO) candidates at high redshift (Alexandroff et al. 2013), so it would not be surprising. One caveat of all of the options discussed above is that even at z= 1.41 the host galaxy of an AGN must substan-tially absorb the emission from 3C 294. This has not been seen. Thus, even the most reasonable option (Mg II at z= 1.41) is not convincing.
Alternatively, the emission line in component c could derive from a redshifted UV line. The strongest UV lines in a QSO spectrum are Lyα λ1215 Å, C IV λ1549 Å, and C III] λ1909 Å (Vanden Berk et al. 2001). This would move the AGN to
redshifts beyond z= 2.5, with 3C 294 then being along the line of sight to component c. Its redshift would then be z = 2.54 (C III]), 3.36 (C IV), or 4.56 (Lyα), respectively. If this is the case, the UV lines should be absorbed to some extent by 3C 294. There are eight QSO at z > 2.5, up to z = 5.2, in the ChandraDeep Field North (CDFN,Brandt et al. 2001;Barger et al. 2002). These eight sources all share the same properties with component c. Their soft X-ray flux in the 0.5−2.0 keV band is between 0.3 and 6 × 1e−15ergs cm−2s−1, their K magnitudes
are ∼21, their V magnitudes are ∼24, and their spectroscopic sig-natures include strong, broad Lyα, sometimes also accompanied by strong C+IV and C III]. Given the faintness of our emission line and the absence of a second line, it is reasonable to assume that this would correspond to Lyα at z= 4.56.
4.4. Consequences for an AGN pair
Our results do not allow us to discriminate between the dual AGN or projected AGN scenario. Even the latter would not con-tradict the interpretation byStockton et al.(2004) that 3C 294 hosts an obscured AGN centered at component b, while a second much fainter but not obscured AGN is coincident with compo-nent c. One natural explanation for the differences in the photom-etry from various studies summarized in Table4is the intrinsic variability of the two AGN.
Projected AGN pairs can be used for a number of astrophys-ical applications. Examples are QSO-QSO clustering and the tomography of the intergalactic medium or the circumgalactic medium of the QSO along the light of sight to the background QSO (Hennawi et al. 2006). The latest compilation of projected QSO pairs can be found inFindlay et al.(2018). However, the number of small-separation pairs (a few arcsec) is very small (Inada et al. 2012;More et al. 2016), and they have mostly be derived from searches for gravitationally lensed QSOs and all have a wider separation (≥200. 5) than our target. To the best of
our knowledge, no projected AGN pair with such a small sepa-ration and large∆z is known at present.
Due to the close separation of our system, gravitational lens-ing effects could modify the apparent properties of the 3C 294 system. A multiply-lensed QSO image of component c would be expected for an Einstein radius of ≥100. Since we do not see
any, this would set the upper limit of the 3C 294 host galaxy to 3 × 10¹²M
at a redshift of z= 1.784 and 4.56 for the lense and
source, respectively. As the host galaxy is certainly not point-like, any amplification must be very low. In addition, component c could even be subject to gravitational microlensing by stars in the host galaxy of 3C 294. This might at least in part explain the difference in brightness of the 3C 294 system shown in Table4. 4.5. Outlook
The analysis of our deep AO images and optical spectra of 3C 294 did not allow us to unambiguously characterize the 3C 294 system as the main conclusion rests on the spatial associ-ation of the emission line at λ6749.4 Å with either component b or c. If it originates from component b, the nature of component c remains a mystery. If it originates from component c, we have support for either the dual or projected AGN scenario. Whether the lines originate from component b or c can be tested by repeat-ing the optical spectroscopy “astrometrically” by takrepeat-ing a spec-trum of 3C 294 and a bright object on the FoV simultaneously, with the latter showing a trace on the two-dimensional spec-trum. If the line at λ6749.4 Å belongs indeed to component c, AO-aided NIR spectroscopy is the only way to characterize the A28, page 8 of9
system due to the faintness of the system and the probably high redshifts involved. Not much can be learned for 3C 294 itself from the ground, as at z = 1.784 all diagnostic optical emis-sion lines except Hγwill be redshifted into a wavelength range where the NIR sky is opaque. At least one of the redshifted [O II, O III] or Hα,β lines is redshifted into one of the JHK-windows if component c is at z= 2.54, 3.36, or 4.56. An unam-biguous determination of the nature of 3C 294 will be possible with the NIR spectrograph NIRspec onboard the James Webb Spacec Telescope. With its 300× 300Integral Field Unit covering
the wavelength range 0.67–5 µm, a number of diagnostic lines can be observed in a very low infrared background devoid of opaque wavelength regions.
Acknowledgements. We would like to thank the anonymous referee for the constructive comments that addressed a number of important points in the paper. We would also like to thank Mark Norris and Jesper Storm for taking the MODS-data at the LBT for us. This work has made use of data from the European Space Agency (ESA) mission Gaia (https://www. cosmos.esa.int/gaia), processed by the Gaia Data Processing and Anal-ysis Consortium (DPAC,https://www.cosmos.esa.int/web/gaia/dpac/ consortium). Funding for the DPAC has been provided by national institutions, in particular the institutions participating in the Gaia Multilateral Agreement. This work was supported in part by the German federal department for education and research (BMBF) under the project numbers 05 AL2VO1/8, 05 AL2EIB/4, 05 AL2EEA/1, 05 AL2PCA/5, 05 AL5VH1/5, 05 AL5PC1/1, and 05 A08VH1.
References
Alexandroff, R., Strauss, M. A., Greene, J. E., et al. 2013,MNRAS, 435, 3306 Alksnis, A., Balklavs, A., Dzervitis, U., & Eglitis, I. 1998,A&A, 338, 209 Barger, A. J., Cowie, L. L., Brandt, W. N., et al. 2002,AJ, 124, 1839 Barrows, R. S., Stern, D., Madsen, K., et al. 2012,ApJ, 744, 7
Brandt, W. N., Alexander, D. M., Hornschemeier, A. E., et al. 2001,AJ, 122, 2810
Ducati, J. R., Bevilacqua, C. M., Rembold, S. B., & Ribeiro, D. 2001,ApJ, 558, 309
Esposito, S., Riccardi, A., Pinna, E., et al. 2012, inAdaptive Optics Systems III, Proc. SPIE, 8447, 84470U
Fabian, A. C., Sanders, J. S., Crawford, C. S., & Ettori, S. 2003,MNRAS, 341, 729
Ferland, G. J. 1981,ApJ, 249, 17
Findlay, J. R., Prochaska, J. X., Hennawi, J. F., et al. 2018,ApJS, 236, 44 Gaia Collaboration (Prusti, T., et al.) 2016,A&A , 595, A1
Gaia Collaboration (Brown, A. G. A., et al.) 2018,A&A , 616, A1
Heidt, J., Pramskiy, A., Thompson, D., et al. 2018, in Ground-based and Airborne Instrumentation for Astronomy VII, SPIE Conf. Ser., 10702, 107020B
Hennawi, J. F., Prochaska, J. X., Burles, S., et al. 2006,ApJ, 651, 61 Humphrey, A., Villar-Martín, M., Vernet, J., et al. 2008,MNRAS, 383, 11 Husemann, B., Worseck, G., Arrigoni Battaia, F., & Shanks, T. 2018,A&A, 610,
L7
Hynes, R. I., Torres, M. A. P., Heinke, C. O., et al. 2014,ApJ, 780, 11 Inada, N., Oguri, M., Shin, M.-S., et al. 2012,AJ, 143, 119
Kormendy, J., & Ho, L. C. 2013,ARA&A, 51, 511
Koss, M., Mushotzky, R., Treister, E., et al. 2012,ApJ, 746, L22 Mannucci, F., Basile, F., Poggianti, B. M., et al. 2001,MNRAS, 326, 745 McCarthy, P. J. 1993,ARA&A, 31, 639
McCarthy, P. J., Spinrad, H., van Breugel, W., et al. 1990,ApJ, 365, 487 Miley, G., & De Breuck, C. 2008,A&ARv, 15, 67
Monet, D. 1998, USNO-A2.0
More, A., Oguri, M., Kayo, I., et al. 2016,MNRAS, 456, 1595
Mortlock, A., McLure, R. J., Bowler, R. A. A., et al. 2017,MNRAS, 465, 672
Olivier, S. S., & Gavel, D. T. 1994,J. Opt. Soc. Am. A, 11, 368 Overzier, R. A., Shu, X., Zheng, W., et al. 2009,ApJ, 704, 548
Persson, S. E., Murphy, D. C., Krzeminski, W., Roth, M., & Rieke, M. J. 1998, AJ, 116, 2475
Pogge, R. 2019,https://doi.org/10.5281/zenodo.2550741
Pogge, R. W., Atwood, B., Brewer, D. F., et al. 2010, inGround-based and Airborne Instrumentation for Astronomy III, Proc. SPIE, 7735, 77350A Poggianti, B. M. 1997,A&AS, 122, 399
Quirrenbach, A., Roberts, J. E., Fidkowski, K., de Vries, W., & van Breugel, W. 2001,ApJ, 556, 108
Rosas-Guevara, Y. M., Bower, R. G., McAlpine, S., Bonoli, S., & Tissera, P. B. 2019,MNRAS, 483, 2712
Rothberg, B., Kuhn, O., Power, J., et al. 2018, inGround-based and Airborne Instrumentation for Astronomy VII, SPIE Conf. Ser., 10702, 1070205 Saxena, A., Marinello, M., Overzier, R. A., et al. 2018,MNRAS, 480, 2733 Schlafly, E. F., & Finkbeiner, D. P. 2011,ApJ, 737, 103
Steinbring, E., Crampton, D., & Hutchings, J. B. 2002,ApJ, 569, 611 Stockton, A., Canalizo, G., & Ridgway, S. E. 1999,ApJ, 519, L131
Stockton, A., Canalizo, G., Nelan, E. P., & Ridgway, S. E. 2004,ApJ, 600, 626
Toft, S., Pedersen, K., Ebeling, H., & Hjorth, J. 2003,MNRAS, 341, L55 Urry, C. M., & Padovani, P. 1995,PASP, 107, 803