Abstract— This study aimed at evaluating whether people
with a normal cognitive function can be discriminated from subjects with a mild impairment of cognitive function based on a set of acoustic features derived from spontaneous speech. Voice recordings from 90 Italian subjects (age >65 years; group 1: 47 subjects with MMSE>26; group 2: 43 subjects with 20≤ MMSE ≤26) were collected. Voice samples were processed using a MATLAB-based custom software to derive a broad set of known acoustic features. Linear mixed model analyses were performed to select the features able to significantly distinguish between groups. The selected features (% of unvoiced segments, duration of unvoiced segments, % of voice breaks, speech rate, and duration of syllables), alone or in addition to age and years of education, were used to build a learning-based classifier. The leave-one-out cross validation was used for testing and the classifier accuracy was computed. When the voice features were used alone, an overall classification accuracy of 0.73 was achieved. When age and years of education were additionally used, the overall accuracy increased up to 0.80. These performances were lower than the accuracy of 0.86 found in a recent study. However, in that study the classification was based on several tasks, including more cognitive demanding tasks. Our results are encouraging because acoustic features, derived for the first time only from an ecologic continuous speech task, were able to discriminate people with a normal cognitive function from people with a mild cognitive decline. This study poses the basis for the development of a mobile application performing automatic voice analysis on-the-fly during phone calls, which might potentially support the detection of early signs of functional cognitive decline.
I. INTRODUCTION
Population aging goes hand in hand with the fast growing of people with dementia worldwide. The transitory step between physiological aging and dementia is known as mild cognitive impairment (MCI). An early diagnosis of the decline of cognitive function is crucial to allow patients to get anticipatory access to pharmacological and cognitive-stimulation therapies, which has been shown to increase the duration of independent living [1].
Dementia significantly affects human speech and language both at linguistic and paralinguistic level [2]. In the early phase of dementia, temporal parameters of speech are altered: notably longer hesitation times and lower speech rates [3,4], increased number and decreased length of voice segments [5],
*Research supported by MOVECARE (H2020-ICT-2016-1; g.a. 732158). E.A. (corresponding author), M.Ca., and S.F. are with NearLab, Dept. of Electronics, Information and Bioengineering, Politecnico di Milano, Italy (e-mail: [email protected]).
D.A., S.D., L.B. and M.Ce. are with Geriatric Unit, Fondazione IRCCS Cà Granda Ospedale Maggiore Policlinico, Milan, Italy and with Dept. of Clinical Sciences and Community Health, University of Milan, Italy.
increased number of word-finding pauses and higher percentage of voiceless segments [6-9]. Rhythm alterations have been highlighted also in terms of significantly less pitch modulation of people with Alzheimer's Disease (AD) compared to age-matched controls [10]. Therefore, automatic voice analysis and machine-learning techniques have been exploited for the early detection of cognitive impairment and monitoring of decline progression. Based on linguistic features from transcripts and acoustic features from the associated audio files, Fraser et al. were able to distinguish between AD and healthy subjects with a classification accuracy of >81% [11]. Similar results were found in [12], where acoustic features extracted from speech recordings provided high accuracy rates in classifying healthy versus AD (87%), MCI versus AD (80%), and healthy versus MCI (79%). Even higher classification accuracies were found in a subsequent work of the same group, in which speech analysis was performed on a mobile application, but still in a controlled environment [13].
Based on this evidence, within the context of the European project MoveCare, we aimed at developing a mobile application, running in background, able to compute acoustic features on-the-fly during phone calls without the need to record audio signals. Based on these acoustic features and on a learning-based classifier, the mobile app will discriminate between people with a normal and a mildly impaired cognitive function, becoming a tool for the daily cognitive monitoring of elderly people in a transparent and non-intrusive manner. This contribution represents a proof of concept for the development of the mobile app. Our first aim was to identify, if any, a subset of acoustic features derived from an ecologic spontaneous speech task able to discriminate between a normal and a mildly impaired cognitive function. The second aim was to build a learning-based classifier upon the selected features and to evaluate its accuracy in comparison to previous results achieved in the literature in a more controlled environment.
The main novelties of this preliminary work are: (1) the classification was based on spontaneous speech; (2) we focused on early signs of cognitive decline; (3) we developed a MATLAB-based custom software in order to favor the porting on the mobile app instead of using PRAAT [14], a free computer software package for the scientific analysis of speech mostly used in previous studies; (4) we analyzed Italian samples which were never investigated.
M.M. and C.L. are with SignalGeneriX Ltd, Limassol, Cyprus. S.M. is with Dept. of Information Engineering, Università Politecnica delle Marche, Ancona, Italy.
M.Ci., C.G., and P.S. are with Consejería de Sanidad y Políticas Sociales, Junta de Extremadura, Mérida, Spain.
N.A.B. is with Dept. of Computer Science, University of Milan, Italy.
Automatic speech analysis to early detect functional cognitive
decline in elderly population*
E. Ambrosini, Member, IEEE, M. Caielli, M. Milis, C. Loizou, D. Azzolino, S. Damanti, L. Bertagnoli, M. Cesari, S. Moccia, M. Cid, C. Galán de Isla, P. Salamanca, N. A. Borghese, S. Ferrante
II. METHODS
A. Participants and data collection
A sample of 90 elderly subjects (age >65 years) were recruited at the Geriatric Unit of Fondazione IRCCS Cà Granda, Ospedale Maggiore Policlinico in Milan, Italy. Participants were divided into two groups based on the Mini-Mental State Examination (MMSE) scores: (1) Subjects with a normal cognitive function (MMSE >26); (2) Subjects with a mild impairment of the cognitive function (20≤ MMSE ≤26). Subjects who were non-native Italian speakers, clinically unstable, affected by severe hearing or visual deficits, aphasic, and/or depressed (30-item Geriatric Depression Scale >9) were excluded.
Subjects were met individually and were asked to tell an episodic story about their life in uninterrupted way for 2 minutes. Voice signals were recorded in .WAV files (16kHz) using an ad-hoc toolbox developed in MATLAB and an external USB microphone. The study was approved by the Hospital Ethical Committee and participants had to provide their written informed consent.
B. Data Analysis
Before feature extraction, data were pre-processed. The polarity of the speech signal was estimated by using the algorithm described in [15] and reversed in case of a negative polarity. Then, to allow inter-subjects comparisons, voice signals were standardized. Standardized voice signals were finally analyzed to automatically extract the following acoustic features: (1) Percentage of unvoiced segments. i.e. segments without harmonic nature; (2) Mean pitch; (3) Mean, median, percentile 15th and 85th of the duration of voiced and
unvoiced segments [12,13]; (4) Shimmer, i.e. the variation of amplitudes of consecutive periods; (5) Percentage of voice breaks, estimated as the number of distances between consecutive pulses longer than 1.25 divided by the pitch floor (i.e. 70Hz) [9]; (6) Standard deviation of the third formant (F3), which refers to tones between 1.5kHz and 2.5kHz; (7) Speech rate, i.e. the number of syllables divided by the total speech time [16]; (8) Mean duration of the syllables [16]; (9) Mean duration of the inter-syllabic pauses >250ms [16]; (10) Percentage of the phonation time, i.e. the intra- and inter-syllabic nuclei time <250ms compared to the total speech time [16]; (1))Articulation rate, i.e. number of syllables divided by the phonation time without pauses [16].
The algorithm described in [17], based on the analysis of the residual harmonics, was used to discriminate between voiced and unvoiced segments and for pitch tracking. First, an auto-regressive model of the spectral envelope was estimated from the speech signal and the residual signal (e(t)) was obtained by inverse filtering. For each Hanning-windowed frame, the amplitude spectrum (E(f)) was then computed. E(f) has a relatively flat envelope and, for voiced segments, presents peaks at the harmonics of the fundamental frequency F0. From E(f), and for each frequency in the range [70 Hz; 500Hz], the Summation of Residual Harmonics (SRH) was computed as follows:
𝑆𝑅𝐻(𝑓) = 𝐸(𝑓) + ∑23456+𝐸(𝑘 ∙ 𝑓) − 𝐸((𝑘 −/0) ∙ 𝑓)1
780 (1)
where 𝑁:;<= is the number of the harmonics (𝑁:;<= = 5).
The estimated pitch value (F0*) for a given residual frame was the frequency maximizing SRH(f) at that time. SRH was also used to discriminate between voiced and unvoiced segments by simple local thresholding: a frame was defined as voiced if SRH(F0*) was higher that a pre-defined threshold (0.07). The frame length and the frame shift were fixed at 100ms and 10ms, respectively. The percentage of unvoiced segments was finally computed by simply dividing the number of unvoiced frames by the total number of frames, while the mean pitch was computed by averaging the value of F0* estimated for all voiced frames. Based on the results of this algorithm, the mean, median, percentile 15th and percentile
85th of the duration of the voiced / unvoiced segments were
also computed.
The shimmer was computed as follows [18]: 𝑆ℎ𝑑𝐵 =2/∑ | 20 ∗ log JKLMN
KL O | 2P/
Q8/ (2)
where 𝐴Q is the amplitude of the i-th voiced framed
associated to the pitch value F0* and N is the total number of voiced frames.
The percentage of the voice breaks was computed starting from the identification of the glottal pulses, defined as the time elapsing between the opening and the closure of the glottis. Estimation of both glottal closure instants (GCIs) and glottal openings instants (GOIs) was automatically performed by using the Dynamic Programming Projected Phase-Slope Algorithm (DYPSA) algorithm [19]. A voice break was defined as the time interval between consecutive pulses longer than 18ms [9]. The percentage of voice breaks was then computed as the ratio between the time periods classified as voice breaks and the total speech time.
F3 was estimated by using the algorithm described in [20], which is based on the calculation of the negative derivative of the argument of the chirp-z transform spectrum of the speech waveform. The algorithm was applied to track the first five formants, while the frame length and the frame shift were fixed at 32ms and 16ms, respectively. The standard deviation of F3 was then computed considering all voiced frames.
The remaining features were based on syllables’ recognition, which was performed by using the algorithm described in [21]. This algorithm computed the envelope of the speech signal by means of a half-wave rectification and a linear predictive method. The syllables were then identified by a simple thresholding method, and the threshold value was fixed at a percentage of the root mean square of the rectified signal. Once the syllables were recognized, the calculation of the speech rate, the mean duration of syllables and inter-syllabic pauses, the percentage of the phonation time and the articulation rate was straightforward.
Data analysis was performed in MATLAB. C. Statistical Analysis
The t-test for independent samples was applied to compare the two groups in terms of age, while the Mann-Whitney U test was used to compare the years of education (YoE) and the MMSE scores. Linear mixed model analyses were carried out on each voice feature, with age and YoE included as covariates, group, age, and years of education entered as fixed effects and the voice feature as dependent variable.
D. Classifier
The features upon which the classifier was built were selected based on the results of the statistical analysis. Two different datasets were considered: (D1) only acoustic features which were significantly different between the two groups; (D2) the same acoustic features plus age and YoE.
To perform feature classification, several standard machine-learning classifiers were investigated. We focused on standard classifiers, despite the recent solutions proposed in the field of deep learning [22], because our dataset was limited in number and more complex models, such as convolutional neural networks, would have led to overfitting issues. In particular, we investigated regularized logistic regression (LoR), support vector machines (SVMs), random forest (RF), k-nearest neighbors (kNN) and Adaboost [23]. Each classifier was trained both on D1 and D2.
For LoR hyperparameter tuning, both regularization strength and norm were cross-validated during training, using grid search and 5-fold cross validation. The grid-search space for the regularization strength was set to [-3,4] in logarithmic scale, with 8 equally spaced values. Both L1 and L2 norm were cross-validated for tuning the norm. As for SVM, both the penalty and kernel-coefficient parameter were cross-validated with a grid-search space equal to [1,6] and [-7,-2], respectively, in logarithmic scale with 6 equally spaced values. Regarding RF and Adaboost, the hyperparameters tuned were the number of tree estimators and the maximum tree depth, both with a grid-search space of [10,100,1000] for RF and of [50,100,200] and [1,5,10,50,250] for Adaboost. The best number of neighbors for kNN was searched in the range [3,15]. For each classifier, the best hyperparameters were chosen according to the classification accuracy on the validation test.
Considering the relatively low number of subjects involved in this study, the leave-one-out cross validation was used for robust testing: 90 different training were performed, every time training on 89 subjects and testing on the remaining one. The classification was implemented in Python using the Scikit-learn libraries.
III. RESULTS
The characteristics of the recruited subjects are reported in Table I. A total of 47 and 43 subjects were included in Group 1 (people with a normal cognitive function) and Group 2 (people with a mildly impaired of the cognitive function), respectively. In both groups, the majority of recruited subjects were female. Significant differences in terms of age, YoE and MMSE scores were found, with people with a mildly impaired cognitive function being characterized by fewer years of schooling and an older age, as previously observed [13].
TABLE I. PARTICIPANTS CHARACTERISTICS. Group 1 Group 2 P-value
Age (years)a 76.5 (4.9) 82.8 (4.7) <0.001c
Men / female 6 / 41 11 / 32
Years of Educationb 13 (3.5) 8 (8) <0.001d
MMSEb 29 (1) 24 (3) <0.001d
a. Mean (standard deviation). b. Median (interquartile range). c. T-test for independent samples. d. Mann-Whitney U test.
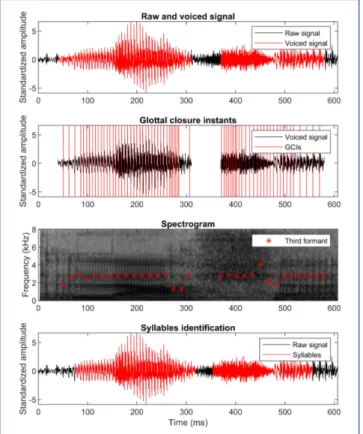
Fig. 1 shows an example of an audio signal recorded during one of the interviews (female, MMSE = 30, age = 74 years, who said “lascia” that means “to let”). The top panel displays the identified voiced segments (in red) overlapped on the overall standardized voice signal (in black). The second panel reports the instants of glottal closures (vertical red lines) estimated by the DYPSA algorithm over the voiced segments (in black). The third panel shows the spectrogram, with darker color indicating higher energy, and highlights the third formant (red asterisks). Finally, the lower panel identifies the syllables (in red) over the overall standardized voice signal (in black): two syllables were correctly identified.
Figure 1. Example of an audio signal recorded during one of the interviews. The recorded subject was a woman (MMSE=30, age of 74 years) who said “lascia”, that means “to let”.
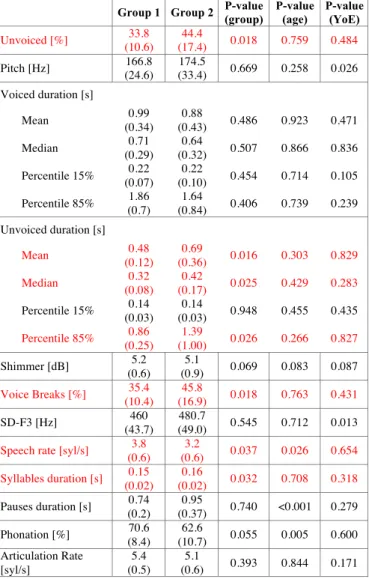
Table II summarizes the results in terms of acoustic features: mean values and standard deviation of the two groups, as well as the results of the statistical analysis. A significant increase of the % of the unvoiced segments and of voice breaks was found in people with a mild impairment of the cognitive function with respect to controls with a normal cognitive function. Furthermore, the mean, median and percentile 85th of the duration of the unvoiced segments
significantly increased in the presence of a mild cognitive impairment. Finally, the speech rate significantly decreased, and the duration of the syllables significantly increased with a decline of the cognitive function. Also, age and years of education had a significant influence on some voice features: specifically, the speech rate, the % of the phonation time, and the duration of pauses were significantly influenced by age, while the pitch and the standard deviation of F3 were influenced by the years of education.
TABLE II. VOICE FEATURES: MEAN VALUES AND STANDARD DEVIATION FOR THE TWO GROUPS AND RESULTS OF THE LINEAR MIXED MODEL ANALYSES. THE FEATURES WHICH WERE SIGNIFICANLTY DIFFERENT BETWEEN THE TWO GROUPS ARE HIGHLIGHTED IN RED.
Group 1 Group 2 P-value (group) P-value (age) P-value (YoE)
Unvoiced [%] 33.8 (10.6) 44.4 (17.4) 0.018 0.759 0.484 Pitch [Hz] 166.8 (24.6) 174.5 (33.4) 0.669 0.258 0.026 Voiced duration [s] Mean 0.99 (0.34) 0.88 (0.43) 0.486 0.923 0.471 Median 0.71 (0.29) 0.64 (0.32) 0.507 0.866 0.836 Percentile 15% (0.07) 0.22 (0.10) 0.22 0.454 0.714 0.105 Percentile 85% 1.86 (0.7) 1.64 (0.84) 0.406 0.739 0.239 Unvoiced duration [s] Mean 0.48 (0.12) 0.69 (0.36) 0.016 0.303 0.829 Median 0.32 (0.08) 0.42 (0.17) 0.025 0.429 0.283 Percentile 15% 0.14 (0.03) 0.14 (0.03) 0.948 0.455 0.435 Percentile 85% 0.86 (0.25) 1.39 (1.00) 0.026 0.266 0.827 Shimmer [dB] 5.2 (0.6) 5.1 (0.9) 0.069 0.083 0.087 Voice Breaks [%] 35.4 (10.4) 45.8 (16.9) 0.018 0.763 0.431 SD-F3 [Hz] 460 (43.7) 480.7 (49.0) 0.545 0.712 0.013
Speech rate [syl/s] 3.8
(0.6) 3.2 (0.6) 0.037 0.026 0.654 Syllables duration [s] 0.15 (0.02) 0.16 (0.02) 0.032 0.708 0.318 Pauses duration [s] 0.74 (0.2) 0.95 (0.37) 0.740 <0.001 0.279 Phonation [%] 70.6 (8.4) 62.6 (10.7) 0.055 0.005 0.600 Articulation Rate [syl/s] 5.4 (0.5) 5.1 (0.6) 0.393 0.844 0.171 TABLE III. ACCURACY OF THE DIFFERENT CLASSIFICATION ALGORITHMS ON THE TWO DATASETS (D1: VOICE FEATURES ALONE; D2: VOICE FEAUTURES PLUS AGE AND YEARS OF EDUCATION).
Algorithm Dataset Precision Recall Accuracy F1-score
Logistic regression D1 0.75 0.63 0.72 0.68 D2 0.78 0.74 0.78 0.76 Support vector machines D1 0.74 0.60 0.71 0.67 D2 0.76 0.72 0.76 0.74 Random Forest D1 0.67 0.56 0.66 0.61 D2 0.74 0.67 0.73 0.71 K-nearest neighbors D1 0.69 0.58 0.68 0.63 D2 0.86 0.70 0.80 0.77 Adaboost D1 0.60 0.63 0.62 0.61 D2 0.79 0.77 0.79 0.78
Seven voice features, for which a significant group effect was found, were used to train the classifiers, alone (dataset
D1) or together with age and YoE (dataset D2). Table III reports the results in terms of precision, recall, accuracy and F1-score of the different classifiers. For voice features alone, LoR showed the best performance with an overall accuracy of 0.72 and the highest precision and recall in identifying subjects with a mildly impaired cognitive function. When age and YoE were also considered, all classifiers improved their performances and the best performance was obtained by kNN and Adaboost, which achieved, respectively, an accuracy of 0.80 and 0.79 and a F1-score of 0.77 and 0.78: kNN resulted to be more precise in identifying subjects with a mildly impaired cognitive function (0.86), while Adaboost achieved a higher recall value (0.77).
IV. DISCUSSION
A sample of 90 Italian subjects (age >65 years) with no or subtle impairment of the cognitive function was recruited in this study in order to evaluate the capability of acoustic features derived from spontaneous speech to distinguish between normal aging and early signs of pathological decline of cognitive function. As previously observed, our results confirmed, for the first time on an Italian sample, that decline of cognitive function is associated with a significant increase of the unvoiced segments [9], of voice breaks [8,9], of the duration of unvoiced segments, and of the mean duration of syllables [8,17], and with a significant decrease of the speech rate [8,17]. Contrary to previous literature [8,9,17], where differences were found between healthy and AD subjects, we observed significant differences between people with a normal and a mildly impaired cognitive function, which is crucial in order to allow an early detection of functional cognitive decline based on automatic speech analysis. Furthermore, as far as we know, this is the first study where significant differences in terms of acoustic features were observed during an ecologic continuous speech task and using a MATLAB-based custom software.
The significant voice features were used to train a learning-based classifier. Standard classifiers were investigated to avoid overfitting due to the low sample size. An overall accuracy of 72% was found for a logistic regression classifier when voice features were used alone. The accuracy increased up to 80% when age and years of education were additionally used. In this case, the k-nearest neighbors classifier performed better, achieving the highest precision (86%). Good performances were obtained also by Adoboost, which achieved the highest recall (77%) for the classification of people with a mildly impaired cognitive function. The better accuracy when age and YoE were additionally used for classification is in line with previous evidence showing that lower education levels and older age are associated with lower cognitive performance [24]. It is worth noticing that, due to the limited number of subjects in the testing datasets, conclusions about the best classifier should not be drawn and further investigation is needed.
Overall, the classification performance achieved was lower than the 86% of accuracy in classifying healthy subjects
versus MCI people obtained in [13]. However, it is important to highlight that in [13] several tasks, including verbal fluency, picture description, counting down, and free speech tasks were performed to derive the voice features used for classification. Specifically, the Authors pointed out the importance to choose tasks which require sufficient cognitive effort in order to detect early signs of cognitive decline. However, within the MoveCare project, we aimed at developing a monitoring system completely transparent to the subject. To reach this aim, we plan to use free speech during phone calls, without the need to record any voice samples.
The main limitation of this study is the use of MMSE score to discriminate between the two groups. MMSE is proven to have good concurrent validity with other neuropsychological assessment instruments, but is not very specific, and moreover it is highly affected by age and education level. Another limitation is related to the heterogeneity of the groups, which significantly differed in terms of age and YoE, with subjects with a mildly impaired cognitive function being older and with a lower education level. Although this is in line with previous evidence [9] and further supports the hypothesis that cognitive reserve might have the potential for slowing the decline of cognitive function, it can represent a confounding factor for our results. Indeed, it has been shown that age and education level influence spontaneous oral and written language [25]. To counteract this limitation, included age and YoE were included as covariates in the linear mixed model analyses and we found out that, as previously observed [25], even when accounting for the cumulative effect of age and education, voice features were still able to discriminate between a normal and a mildly impaired cognitive function.
Our results are encouraging because acoustic features, derived for the first time only from an ecologic continuous free speech, showed to have a moderate capability to discriminate between healthy controls and subjects with a mild impairment of the cognitive function. These promising results pose the basis for the development of the mobile application, which could be use daily in a transparent and non-intrusive manner, favoring a longitudinal assessment of the cognitive function of elderly people and therefore supporting the detection of early signs of functional cognitive decline.
REFERENCES
[1] D. Budd, L.C. Burns, Z. Guo, G. L’Italien, P. Lapuerta, “Impact of early intervention and disease modification in patients with predementia Alzheimer’s disease: A Markov model simulation,” Clin Outcomes Res, vol. 3, no. 1, pp. 189–195, 2011.
[2] J. Appell, A. Kertesz, M. Fisman, “A study of language functioning in Alzheimer patients,” Brain Lang, vol. 17, pp. 73-91, 1982.
[3] B. Roark, M. Mitchell, J.P. Hosom, K. Hollingshead, J. Kaye, “Spoken language derived measures for detecting mild cognitive impairment,” IEEE Trans Audio Speech Lang Proc, vol. 19, no. 7, pp. 2081-90, 2011. [4] F. Martínez-Sánchez, J.J.G. Meilán, J.A. Vera-Ferrandiz, J. Carro, I.M. Pujante-Valverde, O. Ivanova, N. Carcavilla, “Speech rhythm alterations in Spanish-speaking individuals with Alzheimer's disease,” Neuropsychol Dev Cogn B Aging Neuropsychol Cogn, vol. 4, pp. 418-434, 2017.
[5] K. López de Ipiña, J.B. Alonso, J. Solé-Casals, N. Barroso, M. Faundez, M. Ecay, C. Travieso, A. Ezeiza, A. Estanga, “Alzheimer’s disease diagnosis based on automatic spontaneous speech analysis,” presented
at the 2012 International Conference on Neural Computation Theory and Applications, Barcelona.
[6] A. Satt, A. Sorin, O. Toledo-Ronen, O. Barkan, I. Kompatsiaris, A. Kokonozi, M. Tsolaki, “Evaluation of Speech-Based Protocol for Detection of Early-Stage Dementia,” presented at 2013 Interspeech, Lyon, France.
[7] J.J.G. Meilán, F. Martínez-Sánchez, J, Carro , J. Sánchez, E. Pérez E, “Acoustic Markers Associated with Impairment in Language Processing in Alzheimer’s Disease,” Span J Psychol, vol. 15, no. 2, pp. 487–494, 2012.
[8] J.J.G. Meilán, F. Martínez-Sánchez, J. Carro, D.E. López, L. Millian-Morell, J.M. Arana, “Speech in alzheimer’s disease: Can temporal and acoustic parameters discriminate dementia?” Dement. Geriatr. Cogn. Disord, vol. 37, no. 5–6, pp. 327–334, 2014.
[9] J.J.G. Meilán, F. Martínez-Sánchez, J. Carro, N. Carcavilla, O. Ivanova, “Voice Markers of Lexical Access in Mild Cognitive Impairment and Alzheimer’s Disease,” Cur Alzheimer Res, vol. 15, pp. 111-119, 2018. [10] K. Horley, A. Reid, D. Burnham, “Emotional prosody perception and production in dementia of the Alzheimer’s type,” J Speech Lang Hear Res, vol. 53, pp. 1132–1146, 2010.
[11] K.C. Fraser, J.A. Meltzer, F. Rudzicz, “Linguistic Features Identify Alzheimer's Disease in Narrative Speech,” J Alzheimers Dis, vol. 49, no. 2, pp. 407-422, 2016.
[12] A. König, A. Satt, A. Sorin, R. Hoory, O. Toledo-Ronen, A. Derreumaux, V. Manera, F. Verhey, P. Aalten, P.H. Robert, R. David, “Automatic speech analysis for the assessment of patients with predementia and Alzheimer’s disease” Alzheimers Dement (Amst), vol. 1, no. 1, pp. 112-124, 2015.
[13] A. Konig, A. Satt, A. Sorin, R. Hoory, A. Derreumaux, R. David, P.H. Robert, “Use of Speech Analyses within a Mobile Application for the Assessment of Cognitive Impairment in Elderly People,” Curr Alzheimer Res, vol. 15, no. 2, pp. 120-129, 2018.
[14] Available from: http://www.fon.hum.uva.nl/praat/
[15] T. Drugman, “Residual Excitation Skewness for Automatic Speech Polarity Detection,” IEEE Signal Processing Letters, vol. 20, no. 4, pp. 387-390, 2013.
[16] F. Martínez-Sánchez, J.J. Meilán, J. García-Sevilla, J. Carro, J. M. Arana, “Oral reading fluency analysis in patients with Alzheimer disease and asymptomatic control subjects,” Neurologia, vol. 28, no. 6, pp. 325-31, 2013.
[17] T. Drugman, A. Alwan, “Joint Robust Voicing Detection and Pitch Estimation Based on Residual Harmonics,” presented at 2011 Interspeech, Firenze, Italy.
[18] J. P. Teixeira, A. Gonçalves, “Algorithm for Jitter and Shimmer Measurement in Pathologic Voices”, Procedia Computer Science, vol. 100, pp. 271-279, 2016.
[19] P. A. Naylor, A. Kounoudes, J. Gudnason, and M. Brookes, “Estimation of Glottal Closure Instants in Voiced Speech using the DYPSA Algorithm,” IEEE Trans on Speech and Audio Processing, vol. 15, pp. 34–43, 2007.
[20] B. Bozkurt, B. Doval, C. D'Alessandro, T. Dutoit, “Improved differential phase spectrum processing for formant tracking,” presented at 2004 Interspeech, Jeju Island, Korea.
[21] E. L. F. Da Silva, H. M. De Oliveira, “Implementation of an automatic syllabic division algorithm from speech files in Portuguese language,” presented at 2012 Congresso Brasileiro de Automática.
[22] B. Shickel, P. J. Tighe, A. Bihorac, P. Rashidi P, “Deep EHR: A survey of recent advances in deep learning techniques for electronic health record (EHR) analysis,” IEEE J Biomed Health Inform, vol. 22, no. 5, pp. 1589-1604, 2018.
[23] N. M. Nasrabadi, “Pattern recognition and machine learning,” J Electron Imaging, vol. 16, no. 4, pp. 049901, 2007.
[24] N. C. Santos, P. S. Costa, P. Cunha, C. Portugal-Nunes, L. Amorim, J. Cotter, J. J. Cerqueira, J. A. Palha, N. Sousa, “Clinical, physical and lifestyle variables and relationship with cognition and mood in aging: a cross-sectional analysis of distinct educational groups”, Front Aging Neurosci, vol. 6, no. 21, 2014.
[25] K.E. Forbes-McKay, A. Venneri, “Detecting subtle spontaneous language decline in early Alzheimer's disease with a picture description task,” Neurol Sci, vol. 26, no. 4, pp. 243-54, 2005.