Abstract. – OBJECTIVE: To evaluate, in over-weight/obese PCOS women, which of three dis-tinct treatment modalities achieved the great-est clinical benefits in terms of clinical and body composition outcomes.
PATIENTS AND METHODS: Forty-three
poly-cystic ovary syndrome (PCOS) overweight/obese patients were randomly treated for 6 months with: only diet (Group 1, n = 21); diet and myo-inositol (MI) 4 g + folic acid 400 µg daily (group 2, n = 10); diet in association with MI 1.1 g + D-chiroinositol (DCI) 27.6 mg + folic acid 400 µg daily (group 3, n = 13). Menstrual cycle, Ferriman-Gallwey score, body mass index (BMI), waist circumference, hip circumference, waist-hip ratio (WHR), and body composition by bioimpedentiometry were mea-sured at baseline, 3 and 6 months.
RESULTS: Body weight, BMI, waist and hip
circumferences decreased significantly in all groups. There was a significant difference be-tween the 3 groups regarding the restoration of menstrual regularity (p = 0.02) that was obtained in all patients only in-group 3.
CONCLUSIONS: MI+DCI in association with
diet seems to accelerate the weight loss and the fat mass reduction with a slight increase of per-cent lean mass, and this treatment contributes significantly in restoring the regularity of the menstrual cycle.
Key Words:
Polycystic ovary syndrome, Myo-inositol, D-chiroinosi-tol, Body composition, Bioelectrical impedance analysis.
Introduction
Polycystic ovary syndrome (PCOS) is one of the most common endocrine disorders in fe-males in reproductive age, with a prevalence of about 6-10%1. PCOS is characterized by two of
these three conditions according to the Rotter-dam criteria: hyperandrogenism, chronic anovu-lation and polycystic ovarian morphology1-3. The
frequent association between PCOS, hyperan-drogenism, insulin resistance (IR) and hyperin-sulinemia, justifies the metabolic syndrome4-6.
Obesity (mostly android and present in 30-70%), increased levels of triglyceride, low density li-poprotein (LDL) and insulin with associated IR and frequent metabolic syndrome4-10, result in
possible long-term complications such as type 2 diabetes, dyslipidemia, hypertension, athero-sclerosis and cardiovascular events, including acute myocardial infarction and stroke8-13. The
more frequent cardiovascular disease observed in PCOS, is mostly mediated through increased total and abdominal adiposity, and perhaps inte-racting with PCOS-related hyperandrogenism13.
Weight loss through a balanced diet and regular physical activity is considered the first therapeu-tic intervention to restore ovarian funcion and fertility and to prevent metabolic-vascular com-plications, reducing abdominal fat,
androgenici-European Review for Medical and Pharmacological Sciences 2019; 23: 2293-2301
M. LE DONNE
1, D. METRO
2, A. ALIBRANDI
3, M. PAPA
2, S. BENVENGA
4,5,6 1Department of Human Pathology in Adulthood and Childhood “G. Barresi”, University of Messina, Messina, Italy2Department of Biomedical, Dental, Morphologic and Functional Image Sciences, University of Messina, Messina, Italy
3Department of Economics, University of Messina, Messina, Italy
4Department of Clinical and Experimental Medicine, University of Messina, Messina, Italy 5Master Program on Childhood, Adolescent and Women’s Endocrine Health, University of Messina, Messina, Italy
6Interdept. Program of Molecular and Clinical Endocrinology and Women’s Endocrine Health, University Hospital Policlinico G. Martino, Messina, Italy
Effects of three treatment modalities
(diet, myoinositol or myoinositol associated
with D-chiro-inositol) on clinical and body
composition outcomes in women with
2294
ty and IR and improving dyslipidemia13-16. Body
composition assessment studies in PCOS patien-ts have shown that the increase in fat mass (FM) and its predominantly abdominal distribution are present regardless of obesity/overweight17-19.
Data on lean muscle mass in PCOS are few and contradictory20-22. Carmina et al23 showed that
lean mass is more represented in women with PCOS than normal women even in obesity or overweight. Although the increased lean mass (LM) observed in post-menopausal women24
is associated with hyperinsulinemia and hype-randrogenemia that increase lean mass25,26,
pri-or studies on body composition in PCOS have yielded conflicting results27. The increase in LM
in classic PCOS appears to be associated with IR and central obesity rather than with energy intake, physical activity or androgens28.
Myo-i-nositol (MI) is a polyol (cyclohexane-1,2,3,4,5,6-hexol) synthesized from glucose-6-phosphate (G-6-P), and the most abundant of five naturally occurring stereoisomers (scyllo-, muco-, D-chi-ro-, and neo-inositol), MI and D-chiro-inositol (DCI) being those most represented in the human body29,30. MI is not only the precursor of DCI (a
conversion catalyzed by an insulin-dependent epimerase) but also the precursor of a number of inositol phosphates, which act in the Ca-depen-dent intracellular signaling pathways30,31.
Nume-rous studies31,32 have shown that the
administra-tion of DCI, whose deficiency in diabetics and subjects with PCOS can contribute to insulin resistance, improves glucose tolerance and in-sulin sensitivity, reduces androgens and restores ovulation in patients with PCOS. Also the other inositol isoform, the MI precursor of DCI, and very common in nature, reduces blood levels of insulin and testosterone, restores normal ovarian function, controls metabolic syndrome16,33,34.
Si-milar beneficial effects on IR, metabolic syndro-me, androgens and ovulation were reported for DCI35. The combined administration of MI and
DCI in a 40 to 1 ratio, which is the physiologi-cal plasma ratio, ensures better cliniphysiologi-cal results in the setting of treatment of PCOS women36,37 and
improves the glucose metabolism and the lipid profile of obese PCOS women thus reducing the cardiovascular risk38. The purpose of this study
was to evaluate, in overweight/obese women with PCOS, which of three distinct treatment modalities achieved the greatest clinical benefits in terms of clinical and body composition outco-mes when administered for 6 months to three corresponding groups of patients.
Patients and Methods
Of 92 consecutive overweight or obese patients who came to our observation between November 2015 and June 2016, 43 were selected for the study. Inclusion criteria were: diagnosis with PCOS ac-cording to Rotterdam criteria: age between 16 and 45 years; BMI ≥ 25kg/m2; no hormone therapy for
less than 6 months; no concurrent medical disease and taking no medications or over-the-counter products at baseline with commitment not to take any throughout the 6-month duration of the study. Should medications/supplementations, other than those prescribed in this study, be needed for the
de novo appearance of some disease, the patient
had to drop out from the study. Of these, 43 wom-en (age 26.7 ± 8.8 years), 19 (44%) were unem-ployed or housewives, 15 (33%) emunem-ployed, and 9 (21%) students. Nine women (21%) were smokers, and none (0/43) performed regular physical activ-ity. The 43 patients were randomly divided into 3 groups, based on treatment. Group 1(n = 21) was treated with diet only; group 2 (n = 10) treated with diet and MI; group 3 (n = 12) was treated with diet and an association of two inositols (MI + DCI). The treatment duration was 6 months for all groups. The diet (1200 Kcal) administered to all three groups was the same as in a previous study on other patients15. It was according to Italian
guidelines, Livelli di Assunzione di Riferimen-to di Nutrienti (LARN)39 and consisted of 25%
fats, 15-18% proteins and the remaining portion glucids; low glycemic index (IG) foods were rec-ommended. The MI administered to group 2 is manufactured by Lo.Li.Pharma (Rome, Italy), and each sachet contains 2000 mg MI and 200 µg folic acid. The product administered to group 3 is manufactured by Lo.Li.Pharma (Rome, Italy), and each softgel capsule contains 550 mg MI, 13.8 mg DCI and 200 µg folic acid. Group 2 was treat-ed with 2 sachets per day, and group 3 with 2 soft-gel capsules per day. Women enrolled were blind to the treatment. At time of enrolment (baseline) and two time-points (90 days and 180 days) while on treatment, all women underwent a thorough anamnesis and physical examination. During the physical examination, pertinent indices were re-corded: height, weight, waist circumference, hip circumference and degree of hirsutism using the Ferriman-Gallwey score. In addition, bioim-pedentiometry analysis (BIA) was performed, using the BIO 101 instrument by Akern s.r.l (Pon-tassieve, Italy), to evaluate indices of body com-position. These indices are fat mass (FM) in kg
and %, lean mass (LM) in kg and %, total body water (TBW) in lt. Written informed consent was obtained from all participants; the protocol and other materials were in accord with the Helsinki Declaration of 1975 and approved by Institutional Review Boards.
Statistical Analysis
The statistical analysis was performed by a pa-rametric approach after having verified the nor-mality of the examined variables by Kolmogorov Smirnov test. The numerical parameters were expressed as mean and standard deviation; the categorical variables as number and percentage. The ANOVA test was applied in order to assess the existence of statistically significant differen-ces at baseline and at six months between the 3 groups, and to compare baseline, 3 and 6 months numerical variables in each of the 3 groups; for the same purpose chi square for trend was applied for the categorical variable (number and percen-tage of oligomenorrhoeic patients). Student t-test was applied to perform two by two comparison between group 1 vs. group 2; group 1 vs. group 3; group 2 vs. group 3. All tests were two-tailed, and the threshold for statistical significance was set at a p-value < 0.05. p-values comprised between 0.5 and 0.10 were considered to indicate borderline statistical significance.
Results
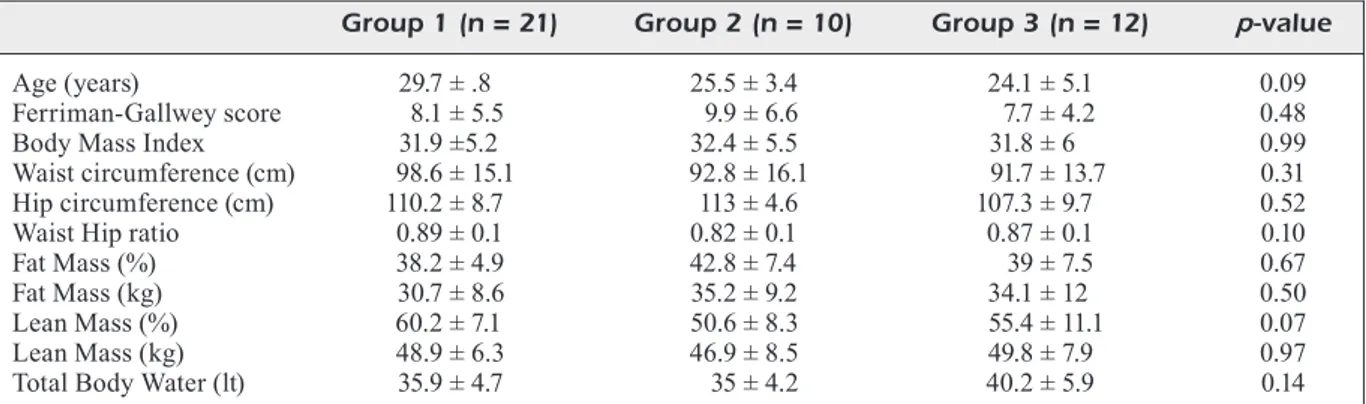
Table I summarizes the pertinent data at baseli-ne in the three groups of women. The three groups of women did not differ significantly (p > 0.05)
for any index, including the frequency of irregu-lar cycles (df = 2, χ2 = 4.25, p = 0.12). Not shown
in Table I, but inferable from Table II, is that the rate of oligomenorrhea was 33/43 (76.7%), with this distribution: 14/21 (66.7%, group 1), 10/10 (100%, group 2), 9/12 (75%, group 3). Regarding body composition, as expected, based on previous literature15,22,33, indices of body composition (FM
and LM) deviated from normality40; the FM mean
levels were higher than those recommended by Lhoman et al40; and LM levels were higher than
those of FM in both kg and %. The fat-lean mass in kg (F/L) ratio was high at basal conditions in all groups. Table II shows changes in the evaluated indices over the 6 months of treatment, except for indices associated with body composition, which are summarized in Table III. Overall, the greatest changes, and in the favorable direction (decrease), occurred in group 3. The weight loss was signi-ficant in all groups after six months and highest in group 3 (8.1, 8.5 and 9.8 kg, respectively). No-teworthy, group 3 was the only group in which regularization of the menstrual cycle had a 100% success rate (Table II). Table III illustrates how body composition is significantly altered after six months in all 3 groups. The FM in % was ficantly reduced in group 1 and borderline signi-ficantly reduced in groups 2 and 3; in groups 1 and 2, it falls within the acceptable limits (< 35%), above which the risk of health increases for wo-men in reproductive age, according to Lohman’s classification40. The FM in kg, was significantly
reduced in groups 1 and 3, and borderline signi-ficantly in group 2. The LM in % signisigni-ficantly increased in group 2 (p = 0.01) and to a lesser ex-tent in group 3 (p = 0.03). After six months, the
Footnote. *The 43 PCOS women were assigned randomly to these three groups, based on a 6-month duration treatment: only diet (Group 1, n = 21); diet and myo-inositol (MI) 4g + folic acid 400 µg daily (group 2, n = 10); diet in association with MI 11 g + D-chiroinositol (DCI) 27.6 mg + folic acid 400 µg daily (group 3, n = 13). Data are mean ± SD.
Table I. Descriptive indices of the 43 women with polycystic ovary syndrome (PCOS) at baseline*.
Group 1 (n = 21) Group 2 (n = 10) Group 3 (n = 12) p-value
Age (years) 29.7 ± .8 25.5 ± 3.4 24.1 ± 5.1 0.09 Ferriman-Gallwey score 8.1 ± 5.5 9.9 ± 6.6 7.7 ± 4.2 0.48 Body Mass Index 31.9 ±5.2 32.4 ± 5.5 31.8 ± 6 0.99 Waist circumference (cm) 98.6 ± 15.1 92.8 ± 16.1 91.7 ± 13.7 0.31 Hip circumference (cm) 110.2 ± 8.7 113 ± 4.6 107.3 ± 9.7 0.52 Waist Hip ratio 0.89 ± 0.1 0.82 ± 0.1 0.87 ± 0.1 0.10 Fat Mass (%) 38.2 ± 4.9 42.8 ± 7.4 39 ± 7.5 0.67 Fat Mass (kg) 30.7 ± 8.6 35.2 ± 9.2 34.1 ± 12 0.50 Lean Mass (%) 60.2 ± 7.1 50.6 ± 8.3 55.4 ± 11.1 0.07 Lean Mass (kg) 48.9 ± 6.3 46.9 ± 8.5 49.8 ± 7.9 0.97 Total Body Water (lt) 35.9 ± 4.7 35 ± 4.2 40.2 ± 5.9 0.14
2296 Tab le I I. C ha ng es a t 3 a nd 6 m on th s o f t he e va lu at ed i nd ic es i n t he t hr ee t re at m en t g ro up s o f 4 3 P C O S p at ie nt s. G ro u p 1 ( n = 2 1) G ro u p 2 ( n = 1 0 ) G ro u p 3 ( n = 1 2 ) B as al 3 m o n th s 6 m o n th s p -va lu e B as al 3 m o n th s 6 m o n th s p -va lu e B as al 3 m o n th s 6 m o n th s p -va lu e O lig om en or rh oi c p at ie nt s 14 ( 66 .7 ) 11 ( 52 .4 ) 9 ( 42 .8 ) 0.0 22 10 ( 10 0) 9 ( 90 ) 2 ( 20 ) 0.0 01 9 ( 75 ) 2 ( 20 ) 0 ( 0) 0.0 01 n° (% ) Fe rr im an G al lw ey s co re 8. 1 ± 5 .5 7.4 ± 4 . 6 7 ± 3 .9 0.0 01 9.9 ± 6 .6 7.8 ± 5 .1 7.8 ± 5 .1 0.0 04 7.7 ± 4 .2 5. 2 ± 3 .4 5. 2 ± 3 .4 0.0 01 (% variation) (-9 .4 %) (-1 5.7 %) (-2 6. 9%) (-2 6. 9%) (-4 8. 1%) (-4 8. 1%) W ei gh t k g ( % v ar ia tio n) 80 .1 ± 1 3. 5 73 .1 ± 1 1.9 72 ± 1 0. 2 0.0 00 80 .9 ± 1 7 76 .5 ± 1 6. 5 72 .4 ± 1 4. 2 0.0 00 80 .5 ± 1 4. 4 74 .9 ± 1 4. 6 70 .7 ± 1 5.1 0.0 00 (-9 .6 % ) (-1 1. 2% ) (-5 .7% ) (-1 1.7 % ) (-7 .5 % ) (-1 3. 9% ) Bo dy M as s I nd ex k g/m 2 31 .9 ± 5 .2 29 .1 ± 4 .8 28 .6 ± 3 .7 0.0 00 32 .4 ± 5 .5 30 .6 ± 5 .2 29 ± 4 .4 0.0 00 31 .8 ± 6 29 .9 ± 5 . 3 28 .2 ± 5 .4 0.0 00 (% va ria tio n) (-9 .6 % ) (-1 1. 5% ) (-5 .9 % ) (-1 1.7 % ) (-6 .7% ) (-1 2.8 % ) W ai st c irc um fe re nc e c m 98 .6 ± 1 5.1 89 .5 ± 1 1. 5 85 .5 ± 1 1. 6 0.0 00 92 .8 ± 1 6. 1 86 .5 ± 1 3. 2 81 .7 ± 1 2. 1 0.0 00 91 .8 ± 1 3.7 87 .2 ± 1 2. 1 83 ± 1 0. 4 0.0 00 (% v ar ia tio n) (-1 0. 2%) (-1 5. 3%) (-7 .3 %) (-1 3. 6%) (-5 .3 %) (-1 0. 6%) H ip c irc um fe re nc e c m 11 0. 2 ± 8 .7 10 1.7 ± 8 .2 10 2.8 ± 6 .3 0.0 00 11 3 ± 4 .6 10 8 ± 4 .8 10 5 ± 5 .1 0.0 00 10 7.3 ± 9 .7 1 02 .1 ± 1 1.1 98 .6 ± 1 1.7 0.0 00 (% va ria tio n) (-8 .3 % ) (-7 .2 % ) (-4 .6 % ) (-7 .6 % ) (-5 .1% ) (-8 .8 % ) W ai st H ip r at io 0.8 9 ± 0 .1 0.88 ± 0 .11 0.8 2 ± 0 .1 0.0 29 0.8 1 ± 0 .1 0.7 9 ± 0 .1 0.7 8 ± 0 .1 0.0 11 0.8 7 ± 0 .1 0.8 4 ± 0 .0 6 0.8 3 ± 0 .0 6 0. 376 (% va ria tio n) (-1 .1% ) (-8 .5 % ) (-2 .5 % ) (-3 .8 % ) (-3 .6 % ) (-4 .8 % ) Fo ot not e. * Fo r d efi ni tio n o f t he t hr ee g ro up s s ee f oot not e o f T ab le I . D at a a re n um be r ( ol ig om en or rh oi c p at ie nt s) a nd m ea n ± S D .
2297 Tab le I II . B od y c om po si tio n a t b as el in e, a nd a ft er 3 a nd 6 m on th s o f t re at m en t i n t he 3 P C O S g ro up s. G ro u p 1 ( n = 2 1) G ro u p 2 ( n = 1 0 ) G ro u p 3 ( n = 1 2 B as al 3 m o n th s 6 m o n th s p -va lu e B as al 3 m o n th s 6 m o n th s p -va lu e B as al 3 m o n th s 6 m o n th s p -va lu e FM % ( % v ar ia tio n) 38 .2 ± 4 .9 33 .3 ± 5 .8 33 .5 ± 4 .3 0.0 00 42 .8 ± 7 .4 39 .3 ± 7 .3 36 .6 ± 7 0.0 07 39 ± 7 .5 34 .5 ± 7 .1 32 .8 ± 7 .9 0.0 08 (-1 4.7 % ) (-1 4% ) (-8 .9 % ) (-1 6. 9% ) (-1 3% ) (-1 8. 9% ) FM k g ( % v ar ia tio n) 30 .7 ± 8 .6 24 .5 ± 7 .7 25 .9 ± 7 .3 0.0 02 35 .2 ± 9 .2 31 .9 ± 8 .6 31 .8 ± 1 3. 3 0.0 74 34 .1 ± 1 2 27 .7 ± 1 1 25 .8 ± 1 0.7 0.0 00 (-2 5. 3% ) (-1 8. 5% ) (-1 0. 3% ) (-1 0.7 % ) (-2 3.1 % ) (-3 2. 2% ) LM % ( % v ar ia tio n) 60 .2 ± 7 .1 62 .5 ± 9 .5 56 .7 ± 7 .1 0. 14 7 50 .6 ± 8 .3 53 .5 ± 9 .2 54 .5 ± 8 .6 0.0 15 55 .4 ± 1 1.1 5 2. 3 ± 1 4. 2 55 .5 ± 1 3. 4 0.0 32 (+ 3.7 %) (-6 .2 %) (+ 5. 4%) (+ 7.1 %) (-5 .9 %) (+ 0. 2%) LM k g ( % v ar ia tio n) 48 .9 ± 6 .3 47 .4 ± 5 .6 48 .7 ± 6 0.0 24 46 .9 ±8 .5 50 .1 ± 9 50 .9 ± 9 .3 0. 16 5 49 .8 ± 7 .9 44 .4 ± 1 1. 2 45 .8 ± 9 .3 0. 26 4 (-3 .2 % ) (-0 .4 % ) (+ 6. 2% ) (+ 7.8 % ) (-1 2. 2% ) (-8 .7% ) TB W l t ( % v ar ia tio n) 35 .9 ± 4 .6 37 .2 ± 6 .4 43 .1± 8 0.0 02 35 ±4 .2 36 .7 ± 4 .2 37 .4 ± 4 .1 0.1 96 40 .2 ± 5 .9 35 .8 ± 5 .3 45 .2 ± 8 .4 0. 16 5 (+ 3. 2%) (+ 16 .7%) (+ 4. 6%) (+ 6.7 %) (-1 2. 6%) (+ 11 .1%) F/ L k g ( % v ar ia tio n) 0. 62 ± 0 .12 0. 51 ± 0 .12 0. 53 ± 0 .13 0.0 2 0.7 6 ± 0 .2 4 0. 64 ± 0 .11 0. 62 ± 0 .2 0.0 15 0. 68 ± 0 .2 1 0. 63 ± 0 .2 2 0. 57 ± 0 .2 3 0.0 05 (-2 1. 6% ) (-1 7% ) (-1 8. 7% ) (-2 2. 6% ) (-7 .9 % ) (-1 9. 3% ) Fo ot no te . * Fo r d efi ni tio n o f t he th re e g ro up s s ee fo ot no te o f T ab le I. D at a a re m ea n ± S D . A bb re vi at io ns : F M = F at m as s; L M = L ea n m as s; T BW = T ot al b od y w at er ; F /L = F at /L ea n k g r at io .
2298
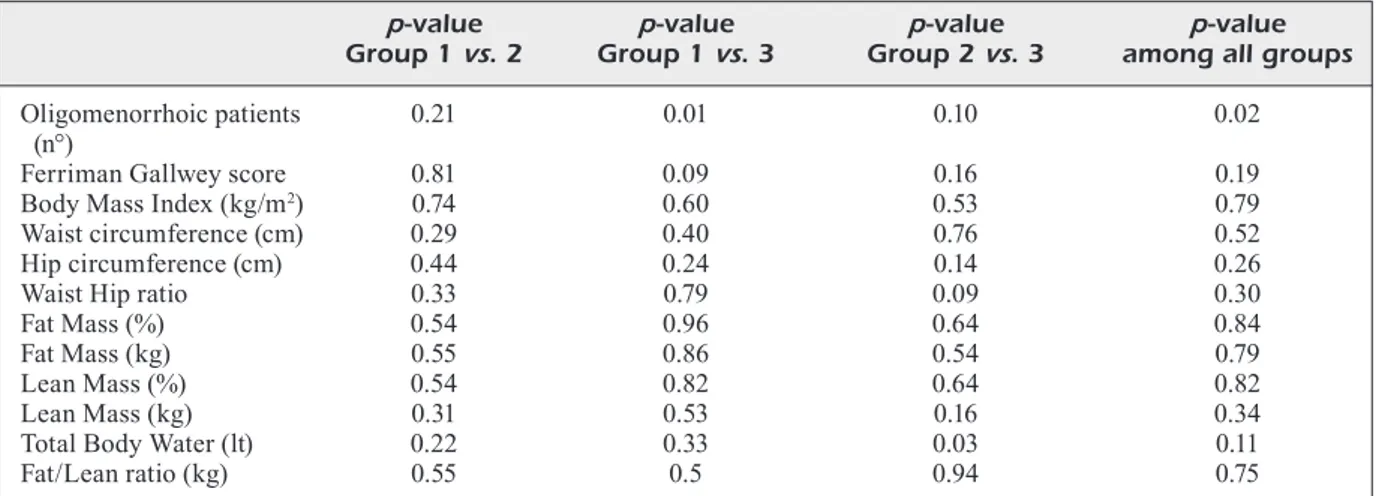
LM in kg slightly significantly decreased only in group 1, while it increased in group 2 and 3. The F/L ratio decreased significantly in all groups (p = 0.02, p = 0.015, p = 0.005 respectively). TBW increased in all groups with a significant differen-ce after six months in groups 1 and 2. No signifi-cant differences were found between the 3 groups at six months regarding Ferriman-Gallwey sco-re, weight, BMI, waist and hips, waist-hip ratio (WHR) and bioimpedentiometry data; the only significant difference between the 3 groups was found in oligomenorrhea rate (p = 0.02) (Table IV). Regarding two by two comparison between group 1 vs. group 2, group 1 vs. group 3 and group 2 vs. group 3, at 6 months (Table IV) there was a significant difference in TBW between group 2
vs. group 3 (p = 0.03) and borderline significant
difference was found in Ferriman-Gallwey score between group 1 vs. group 3 (p = 0.09) and in WHR between Group 2 vs. group 3 (p = 0.09).
Discussion
Our results show, in agreement with the litera-ture, that the weight loss in PCOS improves the metabolic and hormonal framework facilitating the restoration of physiological conditions13-16.
There was a significant difference between the 3 groups regarding the restoration of menstrual regularity, that was obtained in 80% of cases in group 2 and in all patients of group 3. Comparing these data between group 2 and 3 with the results of our previous study16, it is evident that the
addi-tion of MI plus DCI to the diet contributes even
more in restoring the regularity of the menstrual cycle with a success rate of 100% vs. 66.6% with only MI integration. These data are in agreement with those of other researchers34,36,38 and suggest
that the combination MI/DCI in a physiological plasma ratio of 40:1, might be more effective than the supplementation with single MI, because of the imbalance in the MI/DCI ratio present in the PCOS ovary, possibly due to enhanced epimera-se activity36. No significant difference was found
between the 3 groups regarding the improvement of the Ferriman-Gallwey score, that was more apparent in group 1 and 3. Many authors1-5 have
shown that increased abdominal fat is an impor-tant determinant of increased cardiovascular and metabolic disease. However, there is paucity of data on other components of body structure and their possible effects on cardiovascular risk in PCOS. It has been shown that obese women also tend to have increased LM6; this trend may be
hi-gher in women with PCOS where other factors such as obesity, IR, and androgen excess may also contribute to increasing LM. Since lean muscle mass contributes significantly to metabolism and represents one of the major targets of both insulin and androgen action15, this determinant may be
an important parameter of body composition to assess in PCOS. The importance of determining muscle mass in PCOS has been further increased by the finding that changes in LM appear to cor-relate with changes in some cardiovascular para-meters, including a correlation between small in-creases in carotid intima-media thickness (IMT) with larger muscle mass23. The increased F/L
ra-tio observed in Ezeh et al27 work, indicates a
di-Footnote. *For definition of the three groups see footnote of Table I.
Table IV. Two by two comparisons between group 1 vs. group 2; group 1 vs. group 3; group 2 vs. group 3, at six months.
p-value p-value p-value p-value
Group 1 vs. 2 Group 1 vs. 3 Group 2 vs. 3 among all groups Oligomenorrhoic patients 0.21 0.01 0.10 0.02 (n°)
Ferriman Gallwey score 0.81 0.09 0.16 0.19 Body Mass Index (kg/m2) 0.74 0.60 0.53 0.79
Waist circumference (cm) 0.29 0.40 0.76 0.52 Hip circumference (cm) 0.44 0.24 0.14 0.26
Waist Hip ratio 0.33 0.79 0.09 0.30
Fat Mass (%) 0.54 0.96 0.64 0.84
Fat Mass (kg) 0.55 0.86 0.54 0.79
Lean Mass (%) 0.54 0.82 0.64 0.82
Lean Mass (kg) 0.31 0.53 0.16 0.34
Total Body Water (lt) 0.22 0.33 0.03 0.11
sproportional change in FM relative to LM, and suggests a decreased ability of LM to increase proportionately with the changes in FM in PCOS. In our study, in all PCOS groups treated either with diet alone, in combination with MI, or with MI plus DCI, there was a significant reduction in BMI; despite the significant reduction in waist and hip circumference obtained in the 3 groups, the WHR was significantly improved only in groups 1 and 2 with more significant trend in group 2. Regarding the body composition, it was improved after six months in all groups without significant differences between the 3 groups. The % FM was significantly reduced by diet alone, and borderline significantly by diet plus MI and diet plus MI and DCI. The FM in kg was more reduced by diet in combination with MI plus DCI. The % LM was increased by diet in cotreatment with MI, while it was reduced by diet alone; in the group treated with diet in association with MI and DCI, the % LM was reduced after 3 months and then reached baseline levels at six months. The LM (kg) was significantly reduced only by diet. There was a significant difference in TBW between group 2
vs. group 3.
Our data confirm those of literature that overweight or obese PCOS women as well as ha-ving higher levels of FM predominantly distri-buted abdominally, also have a higher LM rate as a result of IR17-22. It has been shown that
du-ring the treatment of obese PCOS women with insulin-sensitizing pioglitazone in addition to decreasing fasting insulin levels, significantly reduced lean body mass without modifying te-stosterone levels41. The high F/L ratio at basal
condition was significantly reduced in all groups after 6 months within acceptable levels, without significative difference between the 3 groups. According to Ezeh et al27 the F/L ratio
predi-cts metabolic dysfunction more effectively than WHR and the deleterious effects of excess body fat therefore overrides the beneficial effects of LM in the scenario of increased F/L ratio. The presence of obesity is accompanied by an incre-ase in muscle mass42,43. However, the increased
F/L ratio indicates a disproportional change in FM relative to LM, suggesting a decreased abi-lity of LM to increase proportionately with the changes in FM in PCOS27. The data from our
study, although limited by the low number of subjects enrolled, suggest that both MI such as MI plus DCI can positively influence body com-position in obese PCOS patients, by improving glucose tolerance and insulin sensitivity.
Conclusions
Weight loss through diet undoubtedly improves the symptoms of PCOS; moreover, the addition of MI plus DCI to the diet seems to accelerate the weight and FM reduction with a slight increase of LM% and contributes even more in restoring the regularity of the menstrual cycle. In agreement with Ezeh et al27, our data suggest that BIA could
be used to assess F/L ratio, that could possibly re-present an alternative to WHR as a marker of me-tabolic dysfunction in clinical practice. Further studies are needed to confirm the role of MI and DCI on improving body composition, with parti-cular regard to lean muscle mass also correlated to some cardiovascular parameters23.
Conflict of Interest
The Authors declare that they have no conflict of interests.
References
1) Ehrmann Da. Polycistic ovary syndrome. N Engl J Med 2005; 352: 1223-1236.
2) rottErDam EShrE/aSrm SponSorED pCoS ConSEn -SuSworkShop group. Revised 2003 consensus on diagnostic criteria and long term health risks re-lated to polycystic ovary syndrome. Hum Reprod 2004; 19: 41-47.
3) LEE at, ZanE Lt. Dermatologic manifestations of polycystic ovary syndrome. Am J Clin Dermatol 2007; 8: 201-219.
4) Dunaif a. Insulin resistance and the polycystic ovary syndrome: mechanism and implications for pathogenesis. Endocr Rev 1997; 18: 774-800. 5) CiampELLi m, LanZonE a. Insulin and polycystic
ova-ry syndrome. Gynecol Endocrinol 1998; 12: 277-292.
6) moLLEr DE, fLiEr JS. Insulin resistance mecha-nisms, syndromes, and implications. N Engl J Med 1991; 325: 938-948.
7) pappaLarDo ma, ruSSo gt, pEDonE a, piZZo a, Bor -riELLi i, StaBiLE g, artEniSio aC, amato a, CaLvani m, CuCinotta D, trimarChi f, BEnvEnga S. Very high fquency of the polymorphism for the insulin re-ceptor substrate 1 (IRS-1) at codon 972 (glycin-e972arginine) in Southern Italian women with polycystic ovary syndrome. Horm Metab Res 2010; 42: 575-584.
8) wiLD ra, paintEr pC, CouLSon pB, Carruth kB, ran -nEy gB. Lipoprotein lipid concentrations and car-diovascular risk in women with polycystic ova-ry syndrome. J Clin Endocrinol Metab 1985; 61: 946-951.
9) taLBott E, guZik D, CLEriCi a, BErga S, DEtrE k, wEimEr ka, kuLLEr L. Coronary heart disease risk
2300
factors in women with polycystic ovary syndrome. Arterioscler Thromb Vasc Biol 1995; 15: 821-826. 10) G. Franik, a. Bizoń, S. Włoch, D. Pluta, ł. Blukacz,
h. miLnErowiCZ, p. maDEJ. The effect of abdomi-nal obesity in patients with polycystic ovary syn-drome on metabolic parameters. Eur Rev Med Pharmacol Sci 2017; 21: 4755-4761.
11) mokDaD ah, forD ES, Bowman Ba, DiEtZ wh, vini -Cor f, BaLES vS, DiEtZ wh, markS JS. Prevalence of obesity, diabetes, and obesity-related health risk factors 2001. JAMA 2003; 289: 76-79.
12) DahLgrEn E, JanSon po, JohanSon S, LapiDuS L, oDén a. Polycystic ovary syndrome and risk for myocardial infarction-evaluated from a risk factor model based on a prospective study of women. Acta Obstet Gynecol Scand 1992; 71: 599-604. 13) wiLD ra, Carmina E, Diamanti-kanDarakiS E, DokraS
a, ESCoBar-morrEaLE hf, futtErwEit w, LoBo r, nor -man rJ, taLBott E, DumESiC Da. Assessment of car-diovascular risk and prevention of cardiovascu-lar disease in women with the polycystic ovary syndrome: a consensus statement by the andro-gen excess and polycystic ovary syndrome (AE-PCOS) Society. J Clin Endocrinol Metab 2010; 95: 2038-2049.
14) guZik DS, wing r, Smith D, BErga SL, wintErS SJ. En-docrine consequences of weith loss in obese, hy-perandrogenic, anovulatory women. Fertil Steril 1994; 61: 598-604.
15) thomSon EL, BuCkLEy JD, noakES m, CLifton pm, norman rJ, Brinkworth gD. The effect of a hy-pocaloric diet with and without exercise training on body composition, cardiometabolic risk pro-file, and reproductive function in overweight and obese women with polycystic ovary syndrome. J Clin Endocrinol Metab 2008; 93: 3373-3380. 16) LE DonnE m, aLiBranDi a, giarruSSo r, Lo monaCo
i, muraCa u. Diet, metformin and inositol in over-weight and obese women with polycystic ovary syndrome: effects on body composition. Minerva Ginecol 2012; 64: 23-29.
17) PuDEr JJ, varga S, kraEnZLin m, DE gEytEr C, kELLEr u, müLLEr B. Central fat excess in polycystic ovary syndrome: relation to low grade inflammation and insulin-resistance. J Clin Endocrinol Metab 2005; 90: 6014-6021.
18) Carmina E, BuCChiEri S, ESpoSito a, DEL puEntE a, manSuEto p, Di fEDE g, rini g. Abdominal fat quantity and distribution in women with polycys-tic ovary syndrome and extent of its relation to insulin resistance. J Clin Endocrinol Metab 2007; 92: 2500-2505.
19) CoSar E, uCok k, akgun L, kökEn g, Sahin fk, arioZ Dt, Baş o. Body fat composition and distribution in women with polycystic ovary syndrome. Gyne-col Endocrinol 2008; 24: 428-432.
20) DouChi t, oki t, yamaSaki h, kuwahata r, nakaE m, nagata y. Relationship of androgens to mus-cle size and bone mineral density in women with polycystic ovary syndrome. Obstet Gynecol 2001; 98: 445-449.
21) notELovitZ m. Androgen effects on bone and mus-cle. Fertil Steril 2002; 4: 534-541.
22) kirChEngaaSt S, huBEr J. Body composition charac-teristics and body fat distribution in lean women with polycystic ovary syndrome. Human Repro-duction 2001; 16: 1255-1260.
23) Carmina E, guaStELLa E, Longo ra, rini gB, LoBo ra. Correlates of increased lean muscle mass in women with polycystic ovary syndrome. Eur J En-docrinol 2009; 161: 583-589.
24) LE DonnE m, mEtro D, anoLDo r, DE mEo L, La ga -Lia t, muraCa u, CanCELLiEri f Body composition estimated by bioimpedance analysis in Sicilian climacteric women. Minerva Ginecol 2008; 60: 311-316.
25) Ding EL, Song y, maLik vS, Liu S, Sex difference of endogenous hormones and risk of type 2 diabe-tes: a systematic review and meta-analysis. JA-MA 2006; 295: 1288-1299.
26) rariy Cm, ratCLiffE SJ, wEinStEin r, BhaSin r, BLaCkman mr, CauLEy Ja, roBBinS J, ZmuDa Jm, harriS tB, CappoLa ar. Higher serum free tes-tosterone concentration in older women is as-sociated with greater bone mineral density, lean body mass, and total fat mass: the cardiovascu-lar health study. J Clin Endocrinol Metab 2011; 96: 989-996.
27) EZEh u, paLL m, mathur r, aZZiZ r Association of fat to lean mass ratio with metabolic dysfunction in women with polycystic ovary syndrome Hum Re-prod 2014; 29: 1508-1517.
28) mario fm, Do amarantE f, toSCani mk, SpritZEr pm. Lean muscle mass in classic or ovulatory PCOS: association with central obesity and insulin resis-tance Exp Clin Endocrinol Diabetes 2012; 120: 511-516.
29) FaCChinEtti f, BiZZarri m, BEnvEnga S, D’anna r, Lan -ZonE a, SouLagE C, Di rEnZo gC, hoD m, CavaLLi p, Chiu tt, kamEnov Za, BEviLaCqua a, CarLomagno g, gErLi S, oLiva mm, DEvroEy p. Results from the in-ternational consensus conference on Myo-inosi-tol and d-chiro-inosiMyo-inosi-tol in obstetrics and gynecol-ogy: the link between metabolic syndrome and PCOS. Eur J Obstet Gynecol Reprod Biol 2015; 195: 72-76.
30) BErriDgE mJ. Inositol triphosphate and calcium sig-nalling. Nature1993; 361: 315-325.
31) nEStLEr JE, JakuBowiCZ DJ, rEamEr p, gunn rD, aL -Lan g. Ovulatory and metabolic effects of D-chi-ro-inositol in the polycystic ovary syndrome. N Engl J Med 1999; 340: 1314-1320.
32) Iuorno mJ, JakuBowiCZ DJ, BaiLL argEon Jp, DiL -Lon p, gunn rD, aLL an g, nEStLEr JE. Effects of D-chiro-inositol in lean women with the poly-cystic ovary syndrome. Endocr Pract 2002; 8: 417-423.
33) gEnaZZani aD, LanZoni C, riCChiEri f, JaSonni vm. Myo-inositol administration positively affects hy-perinsulinemia and hormonal parameters in over-weight patients with polycystic ovary syndrome. Gynecol Endocrinol 2008; 24: 139-144.
34) minoZZi m, D’anDrEa g, unfEr v. Treatment of hir-sutism with myo-inositol: a prospective clinical study. Reprod Biomed Online 2008; 17: 579-582. 35) monaStra g, unfEr v, harrath ah, BiZZarri m Com-bining treatment with myo-inositol and D-chi-ro-inositol (40:1) is effective in restoring ova-ry function and metabolic balance in PCOS pa-tients. Gynecol Endocrinol 2017; 33: 1-9.
36) unfEr v, porCaro g Updates on the myo-inositol plus D-chiro-inositol combined therapy in poly-cystic ovary syndrome. Expert Rev Clin Pharma-col 2014; 7: 623-631.
37) v. CappELLi, m.C. muSaCChio, a. BuLfoni, g. mor -gantE, v. DE LEo. Natural molecules for the thera-py of hyperandrogenism and metabolic disorders in PCOS. Eur Rev Med Pharmacol Sci 2017; 21: 15-29.
38) minoZZi m, norDio m, paJaLiCh r. The combined therapy myo-inositol plus D-chiro-inositol, in a physiological ratio, reduces the cardiovascular risk by improving the lipid profile in PCOS pa-tients Eur Rev Med Pharmacol 2013; 17: 537-540.
39) (SINU), S.I.d.N.U. Iv Revisione dei Livelli di Assunzione di Riferimento di Nutrienti ed Energia per la Popolazione Italiana (Larn) [(accessed on 1 April 2018)]; Available online:http://www.sinu.it/ html/pag/tabelle_larn_2014_rev.asp.
40) Lhoman tg, hooutkoopErL, going SB. Body fat measurement goes hig tech. Not all are creat-ed equal. ACSM Health Fitness J 1997; 1: 30-35.
41) gLintBorg D, anDErSEn m, hagEn C, hEiCkEnDorff L, hErmann ap. Association of pioglitazone treat-ment with decreased bone mineral density in obese premenopausal patients with polycystic ovary syndrome: a randomized, placebo-con-trolled trial. J Clin Endocrinol Metab 2008; 93: 1696-1701.
42) forBES gB, wELLE SL. Lean body mass in obesity. Int J Obes (London) 1983; 7: 99-107.
43) LEar Sa, kohLi S, BonDy gp, tChErnof a, SniDErman aD. Ethnic variation in fat and lean body mass and the association with insulin resistance. J Clin Endocrinol Metab 2009; 94: 4696-4702.