! " # $ % & ' ( $ ) *+, !& - ./0
Semiparametric Evidence on the
Long-Run E¤ects of In‡ation on
Growth
A. Vaona and S. Schiavo
yAbstract
Two major …ndings of the empirical literature on the connec-tion between in‡aconnec-tion and output growth is that their relaconnec-tionship is non linear and that there exists a threshold in‡ation level be-low which in‡ation has a positive impact on growth and above which in‡ation has a negative impact on growth. In this paper we adopt a semiparametric estimator and we show that the …rst …nding holds true even dropping the speci…cation assumptions typical of parametric models. We also show that a threshold level does exist and it is around 10% for developed countries and 15% for developing ones. However, below the threshold level in‡ation does not appear to have a positive impact on growth, rather it does not have any substantial e¤ect on it.
Jel codes: E31, O49, C14. Keywords: In‡ation, Growth.
Corresponding author. Birkbeck College (University of London) and
Uni-versity of Verona, Department of Economic Sciences, Polo Zanotto, Viale
dell’Università 4, 37129, Verona, Italy. Tel.: (+39)0458028102. E-mail:
yDepartment of Computer and Management Sciences, University of Trento,
Via Inama 4, 38100 Trento. E-mail: [email protected], phone:
1
Aim of the Paper and Literature Review
The aim of this paper is to reassess by means of a semiparametric estima-tor the issue of the long-run relationship between in‡ation and economic growth. We think this step is particularly interesting because the rele-vant empirical literature used spline models in the belief that a threshold level of in‡ation should exists below which increasing in‡ation would fos-ter output growth and above which more in‡ation is harmful to output growth.
However, …rst, the theoretical literature had considerable di¢ cul-ties in matching this stylized fact (Temple, 2000) and, second, di¤erent empirical contributions have assumed di¤erent threshold levels without being able to test their assumptions (with the exception of Kahn and Senhadji, 2001). For instance Fischer (1993) imposes a spline model with two breaks, one at 15% annual in‡ation rate and the other at 40%. Gylfason and Herbertsson (2001) …nd that the relationship between in-‡ation and growth is non-linear and the threshold inin-‡ation rate to be around 10%. Ghosh and Phillips (1998) assume the kink of the spline to be at 2.5%, whereas Judson and Orphanides (1999) choose 10%.
A threshold e¤ect is found also by Thirlwall and Barton (1971) at an annual in‡ation rate ranging from 8% to 10%. A similar value is suggested also by Sarel (1996). One notable contribution is Kahn and Senhadji (2001) who …nd the threshold to be around 1% for industri-alized countries and 11% for developing ones. However, the result for the industrialized countries is not completely convincing because, to our knowledge, the only developed country with an in‡ation rate below 1% is Japan, so it is very likely that the paucity of observations, together with the assumption of the spline model, drives the result.
One other major issue in this literature is the exact speci…ed form of non-linearity necessary to better grasp the relationship between in‡ation and growth. The log of the in‡ation rate (Kahn and Senhadji, 2001) has been used as well as the log of 1 plus the in‡ation rate (Harris, Gillman and Matyas, 2001 and Judson and Orphanides, 1999), the level of
in-‡ation rate (Fischer, 1993), 1+ and (1 ) 1 (Ghosh and Phillips,
1998), where is the in‡ation rate.
In order to take better care of these issues, we think that a semipara-metric estimator will allow to let as much as possible the data speak shedding further light on both the threshold level of in‡ation and its non linear relationship with output growth.
2
Model Speci…cation and Data Issues
We test two model speci…cations both of which follow Kahn and Senhadji (2001). The dependent variable is the growth rate of GDP in constant local currency units. In Speci…cation I controls include the level of in‡a-tion, gross …xed capital formation (or gross capital formation when the former is not available) as a share of GDP, the log of per capita GDP in PPP adjusted dollars in the initial year of each period and population growth. In Speci…cation II, the growth rate of the terms of trade and their 5-year standard deviation are also included.
Data come from three di¤erent sources: the World Bank’s World De-velopment Indicators (WDI) represents our preferred source. However, as per capita GDP is only reported since 1975, we had to revert to Penn World Tables (PWT) to obtain longer series. Last, terms of trade data are built from export and import unit value series taken from the IMF’s International Financial Statistics (IFS).
The dataset covers the period 1960–1999, which is the maximum length common to all three data sources, and 167 countries, which again represents the intersection between WDI and PWT. Terms of trade data are available for a smaller set of (mainly developed) countries and they are therefore not included in our baseline speci…cation, but only used as a robustness check.
As customary when focusing on long-term growth (Temple 2000), we divide all series into 8 equal periods of 5 years each and we consider 5-years means (or medians). The actual number of available observations is lower due to the presence of missing data, especially for non industrial countries (whose IFS code is 200 or above). Moreover, we drop from the sample all observations for which the rate of in‡ation is above 40%. Temple (2000) in fact warns against the risk of pooling together countries with very di¤erent in‡ation dynamics as few extremely high values may well drive the overall results. The 40% cuto¤ point is also employed in Khan and Senhadji (2001), while Gillman et al. (2004) show that using di¤erent truncation points generates negligible di¤erences in the results. In the end our sample contains 134 countries and 672 observations, 169 of which pertain to the 26 industrial countries. Adding the terms of trade variables substantially reduces the sample size: while industrial countries are almost una¤ected, the number of non industrial countries in the sample falls from 108 to 32 (152 total observations).
3
Estimation Method, Results and Conclusions
A semiparametric estimator is one of the tools that it is possible to use when the speci…ed econometric model is thought to be partly linear and
partly non linear:
yi = x01i + g (x2i) + ui (1)
where y is the dependent variable, xji for j = 1; 2 are two sets of
inde-pendent ones, g( ) is a non linear function of unspeci…ed form and i is
the subscript for the i-th observation. A candidate estimator for is:
^ = " n X i=1 (xi1 m^12i) (xi1 m^12i)0 # 1" n X i=1 (xi1 m^12i) (yi m^2i)0 # (2)
where ^m12i and ^m2iare the kernel-based estimators of m12i = E (x1ijx2i)
and m2i = E (yijx2i) : More in detail, the kernel based estimator of m2
is: m2 = Pn i=1K xi x h yi Pn i=1K xi x h (3) where h is the bandwidth and K ( ) is the kernel function. Once having
^ in hand it is easy to …nd ^g (x2i) :
^
g (x2i) = ^m2i m^12i^ (4)
In this contribution, we use a Gaussian kernel and Silverman’s optimal bandwidth (Pagan and Ullah, 1999).
Table 1 shows the parameter estimates for the control variables. The results for the in‡ation-output growth relationship are showed in
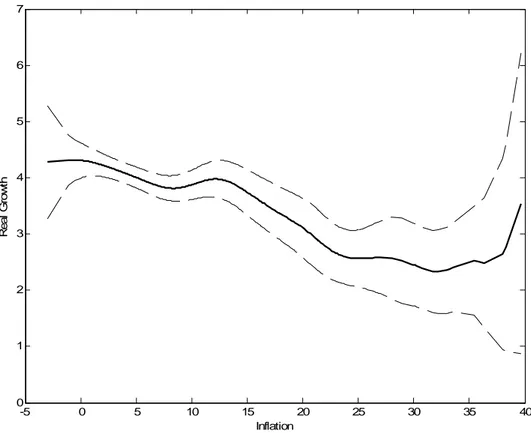
Fig-ures 1 and 2. The continuous line traces ^g (x2i) ; whereas the dotted
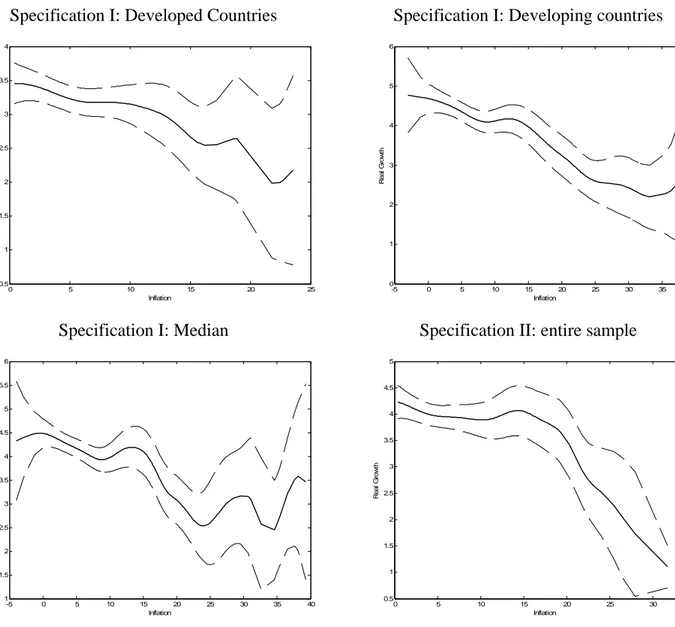
lines mark the 95% con…dence interval. Figure 1 shows the results ob-tained for the whole sample and for Speci…cation I. In‡ation does not appear to be particularly harmful to growth for rates below 15% (which might be consistent with the hypothesis of no e¤ect at all), whereas a marked negative relation appears for higher values. Above 30% a posi-tive relation shows up, but the wide con…dence interval suggests this is probably driven by the small number of observations for high in‡ation countries. Figure 2 shows the results for a number of robustness exer-cises. We split the sample between developed and developing countries. The threshold level moves to around 10% for developed countries and remains around 15% for developing ones. Using the median instead of the mean, as suggested by Temple (2000), does not appear to a¤ect the results. Speci…cation II manages to close the con…dence interval and to have more stable point estimates for both the whole sample and for de-veloping countries. In‡ation threshold levels stick to 10% for developed countries and 15% for developing ones.
This paper uses a semiparametric estimator to assess the issue of the non linear relationship between in‡ation and economic growth and the existence of a threshold e¤ect within it. Our results point to the fact that in‡ation does not have a substantial e¤ect on economic growth when it is below 15% in developing countries and 10% in developed ones. This con…rms that high in‡ation is detrimental to economic growth, but it highlights that spline models may have overstressed the bene…ts that can descend from moderate increases in long run in‡ation values at low in‡ation levels. Whilst we do not address the issue of the allocative ine¢ cency generated by in‡ation, our results also suggest that – from the standpoint of its impact on growth –the importance of low in‡ation targeting may have been overstated.
References
[1] Dotsey, M and Sartre, P. D. (2000), "In‡ation Uncertainty and Growth in a Cash-in-Advance Economy", Journal of Monetary Eco-nomics, 45(3), 631-655.
[2] Fischer, S. (1993), "The Role of Macroeconomic Factors in Growth", Journal of Monetary Economics, 41, 485-512.
[3] Ghosh, A. and Phillips, S. (1998), "In‡ation, Disin‡ation and Growth", IMF Working Paper, WP/98/68.
[4] Gillman, M., Harris M. N., and Matyas, L. (2001), "In‡ation and Growth: explaining a Negative E¤ect", Empirical Economics, 29, 149 -167.
[5] Gylfason, T. and Herbertsson, T. (2001), "Does in‡ation matter for growth?", Japan and the World Economy, 13(4), 405 - 428.
[6] Judson, R. and Orphanides, A. (1999), "In‡ation, Volatility and Growth", International Finance, 2(1), 117-138.
[7] Kahn, S. and Senhadji, A. (2001), "Threshold E¤ects in the Rela-tionship Between In‡ation and Growth", IMF Sta¤ Papers, 48 (1), 1-21.
[8] Pagan, A. and Ullah, A. (1999), Nonparametric Econometrics, Cambridge University Press.
[9] Sarel, M., (1996), "Nonlinear E¤ects of In‡ation on Economic Growth", IMF Sta¤ Papers 43, 199-215.
[10] Temple, J. (2000), " In‡ation and Growth: Stories Short and Tall", Journal of Economic Surveys, 14 (4), 395-426.
[11] Thirlwall, A. P. and Barton, C. A. (1971), "In‡ation and Growth: The International Evidence", Banca Nazionale del Lavoro Quarterly Review 98, 263-275.
Table 1 – Coefficient estimates of the control variables Specification I Specification II All sample Developed countries Developing countries Median All sample Developed countries Developing countries GDP per head at t0 -2.72* -3.77* -2.72* -2.85* -4.46* -3.85* -4.41* t-statistics (-5.93) (-3.70) (-5.11) (-5.82) (-5.83) (-3.63) (-4.10) Population growth 1.33* 1.04* 1.41* 0.45 0.84* 1.23* 0.83* t-statistics (8.16) (2.83) (7.45) (1.84) (2.57) (2.71) (1.77) Investment/GDP 0.16* 0.14* 0.17* 0.14* 0.23* 0.11* 0.30* t-statistics (7.27) (2.52) (6.66) (6.08) (7.20) (1.96) (5.83) Terms of Trade Growth - - - - 0.08* 0.10* 0.08 t-statistics - - - - (2.51) (2.21) (1.67) Terms of Trade Standard Dev. - - - - 0.56 -6.72 0.71 t-statistics - - - - (1.39) (-1.94) (1.26)
*: significant at the 5% level
Figure 1 – Semiparametric estimation of the effect of inflation on real economic growth
-5 0 5 10 15 20 25 30 35 40 0 1 2 3 4 5 6 7 Inflation R eal G row th
Figure 2 – Robustness checks for the semiparametric estimation of the effect of inflation on real economic growth Specification I: Developed Countries
0 5 10 15 20 25 0.5 1 1.5 2 2.5 3 3.5 4 Inflation R e al G row th
Specification I: Developing countries
-5 0 5 10 15 20 25 30 35 40 0 1 2 3 4 5 6 Inflation R e al G row th
Specification II: Developed Countries
0 5 10 15 20 25 0 0.5 1 1.5 2 2.5 3 3.5 4 Inflation R e a l G ro w th Specification I: Median -5 0 5 10 15 20 25 30 35 40 1 1.5 2 2.5 3 3.5 4 4.5 5 5.5 6 Inflation R eal G row th
Specification II: entire sample
0 5 10 15 20 25 30 35 0.5 1 1.5 2 2.5 3 3.5 4 4.5 5 Inflation R eal G row th
Specification II: Developing Countries
0 5 10 15 20 25 30 35 0 1 2 3 4 5 6 Inflation R eal G row th
! " # $ % " ! " & ! ! ' ( ! ) * + , * - -. / # ! - . ! 0 - ) # ! ! $ 1 / 1 % & + 0 ' # ! . / # " ( ) * % & $ 2 ) ! " 1 % . % 1 # ! " / / ' ! * ' ! % ( ! ) $ ) $ 3 4 5 4 5 . ! % & 1 6 ( ( ( 7899 789: $ %
' ($ 0 ( ; < $ $ = + 1 . % 1 . + , $ - . 1 0 ! " ! = $ + . / 0* $ + . / 1 1 ( - . % +2 3 - 4/ # $ % & 1 # 3 - . - ( 5 6 $ ' 1 ! ) . ' + 2 + " * . ' . ! * - 7 8 ) 9 . ' 0 + ' * . 7 8 ) : ' $ " ) / " % ) = ! " 0 ! " 1 > ! " &" " 6 $ " ' %-* & ' * # - #- -$ + 2 /
& * 1 ' ' . 7 ) ) ' 1 % / ! . ) 7 ) * 2 ) + + ?, ( @ 1 ' 1 ) 7 ) 9 1 > 1 $ 44 . : ) " 1 ) * # ! - ' '- .0 ! ' & ?* /@ 6 A ! . - ' '- .0 ! ' & ?* //@ ' ! . ( # ! - , .> - & % ' ! . . 4 1 ' , * 3 ' ! $ $ ! . & 1 0 0 ! " & . 6 - - . 4 . - / & 3 ! 0 ( ) . 3 ( # & ( # + " ! " & & $ $ / 4 & ' * # ! ) ; % < % #- - $
& * 2 1 ! ' 1 - ( (/ . 1-. 7BB ' #- - $ , + 3= & 9 ' ( ) ' # - ' * #- - $ + 2 / & : 3 &#* 0 + 2 / & % $ $ & / $ " & ' 4.0 & 5 .0 / ! . % & 1 ' & .> 1 7 ) ) & 1 / . 1 * ' 0 . 7 ) ) & & ! $ , ! ' -& 7 ) ) & ' > " / # $ 8 - 7 ) ) & * * ! # 3 -1 ) 3 . 4 # % " & 9 ' ! " & : % 4 / - .$" - / 4 $ 44 $ " & - . ( . / & + ) . 4 . - /