This content has been downloaded from IOPscience. Please scroll down to see the full text.
Download details:
IP Address: 192.167.23.210
This content was downloaded on 21/10/2016 at 13:22
Please note that terms and conditions apply.
You may also be interested in:
Identification and filtering of uncharacteristic noise in the CMShadron calorimeter CMS Collaboration
Performance of CMS hadron calorimeter timing and synchronization using test beam, cosmic ray, and LHC beam data
CMS Collaboration
Performance study of the CMS barrel resistive plate chambers with cosmic rays CMS Collaboration
Time reconstruction and performance of the CMS electromagnetic calorimeter CMS Collaboration
Fine synchronization of the CMS muon drift-tube local trigger using cosmic rays CMS Collaboration
Measurement of the muon stopping power in lead tungstate
Performance of the CMS hadron calorimeter with cosmic ray muons and LHC beam data
View the table of contents for this issue, or go to the journal homepage for more 2010 JINST 5 T03012
(http://iopscience.iop.org/1748-0221/5/03/T03012)
2010 JINST 5 T03012
PUBLISHED BYIOP PUBLISHING FORSISSA
RECEIVED: November 30, 2009 ACCEPTED: January 12, 2010 PUBLISHED: March 19, 2010
COMMISSIONING OF THECMS EXPERIMENT WITHCOSMIC RAYS
Performance of the CMS hadron calorimeter with
cosmic ray muons and LHC beam data
CMS Collaboration
ABSTRACT: The CMS Hadron Calorimeter in the barrel, endcap and forward regions is fully com-missioned. Cosmic ray data were taken with and without magnetic field at the surface hall and after installation in the experimental hall, hundred meters underground. Various measurements were also performed during the few days of beam in the LHC in September 2008. Calibration parameters were extracted, and the energy response of the HCAL determined from test beam data has been checked.
KEYWORDS: Calorimeters; Large detector systems for particle and astroparticle physics
2010 JINST 5 T03012
Contents1 Introduction 1
2 CMS hadron calorimeter 2
3 Impact of the magnetic field on the HCAL response 4
3.1 The barrel and endcap hadron calorimeters 5
3.2 The outer hadron calorimeter 7
3.3 The forward hadron calorimeter 7
4 Optimization of the HCAL operation using CRAFT data 8
4.1 Performance of photodetectors and impact on the trigger 8
4.2 Performance of readout electronics and impact on energy thresholds 9
5 Calibrations using cosmic ray muons and LHC beams 11
5.1 The barrel and endcap hadron calorimeters 11
5.2 The outer hadron calorimeter 14
5.3 The forward hadron calorimeter 14
6 Summary 16
The CMS collaboration 19
1 Introduction
The primary goal of the Compact Muon Solenoid (CMS) experiment [1] is to explore particle physics at the TeV energy scale exploiting the proton-proton collisions delivered by the Large Hadron Collider (LHC) [2]. This paper describes the performance of the CMS Hadron Calorime-ter (HCAL). The measurement of the detector response started with the characCalorime-terization and cali-bration of representative samples of all detector components in the laboratory using a test beam [3– 6]. After assembly of the detector, the calibration was improved and validated using cosmic ray muons and LHC beam. The cosmic ray muon data also allowed the testing of the whole data acquisition process, up to the event reconstruction and analysis. The validation includes compar-isons with Monte Carlo simulation studies, which are fundamental in understanding the detailed performance of the detector.
CMS has taken cosmic ray muon data with and without magnetic field at the surface hall in 2006, during the Magnet Test and Cosmic Challenge (MTCC) described in ref. [7]. Recently, data were taken in the underground cavern at ∼ 100 m depth with the magnet off in 2007 (CRUZET: Cosmic RUn at ZEro Tesla) and with the magnet on in 2008 (CRAFT: Cosmic Run At Four Tesla [8]).
2010 JINST 5 T03012
In September 2008, the LHC delivered a single circulating beam of 450 GeV/c protons fora few days. In addition, as part of the commissioning of the LHC, the beam was also sent onto collimator targets creating accelerator produced muons. These “beam splash” events proved very useful to determine the relative timing of various the HCAL systems [9], as well as to validate the performance of several components.
Knowledge of the HCAL performance acquired during CRAFT and with beam splash data will prove crucial to the understanding of data in the early stages of LHC operation. This will allow the timely analysis of benchmark QCD processes and of known missing energy signals. Any search for new phenomena must be grounded on these benchmark analyses.
The paper is structured as follows. Section2provides a brief description of the Hadron Cal-orimeter. Section3discusses the impact of the magnetic field on the various parts of the HCAL subsystems. The characteristics of the basic behavior of all the HCAL subsystems and the opti-mization of key hardware settings are summarized in section 4. Finally, section 5discusses the calibration improvements obtained with the various data samples.
2 CMS hadron calorimeter
The main CMS subsystems, in increasing radial distance from the beam intersection point (IP), are the silicon pixel and silicon strip tracker, the electromagnetic calorimeter, the hadron calorime-ter, and finally the muon system. In addition, in the forward direction there are two specialized calorimeters [1] that did not participate in the cosmic ray runs and are not discussed in this pa-per. The detector is symmetric for positive and negative z coordinates, the z axis being along the beam direction with z = 0 at the IP. The polar angle, θ , is measured from the z direction, and the azimuthal angle, φ , is measured in the transverse plane. The pseudorapidity is η ≡ − ln tan(θ /2).
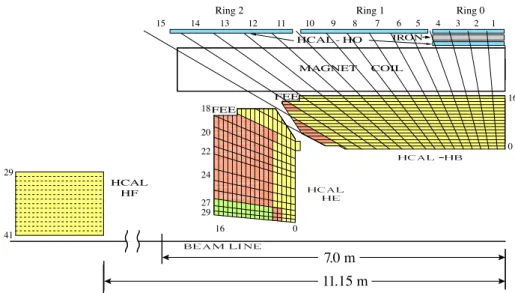
The HCAL includes four distinct subsystems: the barrel (HB), endcap (HE), outer (HO) and forward (HF) calorimeters (see figure 1). HB and HE, which are inside the cryostat of the CMS superconducting solenoid that provides a 3.8 T magnetic field, are sampling calorimeters where the absorber material is brass and the active material is scintillator. The sampling fraction is about 7%. HB and HE are separated by a gap which is located approximately at a polar angle of 57 degrees but is not projective to the center of CMS, in order to minimize the effect of the uninstrumented gap. HB covers the |η| range from zero to approximately 1.4; the |η| range between 1.3 and 1.4 is shared by HB and HE; HE covers |η| from 1.3 to 3.0. HB is built of 18 wedges, each of which covers 20 degrees in φ , and are divided in 5 degree sectors. HE is made of brass disks, interleaved with scintillator wedges which cover 20 degrees in φ , which in turn are divided in four 5 degree sectors. Because of the space constraint within the magnet cryostat, the HB thickness is limited to 5.8 hadronic interaction lengths at η = 0 and increases to 10 interaction lengths at |η| = 1.2. To catch the energy leakage from HB, layers of scintillators are placed outside the solenoid cryostat: they constitute HO. About 5% of all hadrons above 100 GeV deposit energy in HO. In φ , HO has a 12-fold structure, with each 30 degree component being divided in six 5 degree sectors. In η, HO is composed of five “rings”, which follow the structure of the magnet return yoke and of the muon chambers. Ring 0 covers the η range between -0.35 and 0.35, Rings ±1 cover the |η| range between 0.35 and 0.87, and Rings ±2 cover the |η| range between 0.87 and 1.2. The quartz fiber and steel HF calorimeter, with fibers parallel to the beam direction, covers the forward region of
2010 JINST 5 T03012
Figure 1. The CMS HCAL detector (quarter slice). “FEE” indicates the locations of the Front End Electron-ics for HB and HE. The signals of the tower segments with the same color are added optically, to provide the HCAL “longitudinal” segmentation. HB, HE and HF are built of 36 identical azimuthal wedges (∆φ = 20 degrees).
|η|, between 3.0 and 5.2. HF is constructed in wedges of 20 degrees and each wedge contains two φ sectors of 10 degrees. The calorimeter tower segmentation in η and φ of HB, HE and HO subsystems is 0.087×0.087 except in HE for |η| above 1.74, where the η segmentation ranges from 0.09 to 0.35 and the φ segmentation is 0.175. The HF segmentation is 0.175×0.175 except for |η| above 4.7, where the segmentation is 0.175×0.35.
Figure1shows a schematic quarter view of the hadron calorimeter system in the barrel, endcap and forward regions. Also shown are the locations of some of the Front End Electronics (FEE). The HF FEEs (not shown) are placed around a ring at |η| = 3 (tower number 29) and HO FEEs are located inside the muon detectors at various locations. Each HB and HE tower has 17 scintillator layers, except near the overlap region between HB and HE. Each scintillator tile of a tower is read out by an embedded wavelength shifting fiber and the signals are added optically. The color scheme in figure1denotes the longitudinal segmentation of the read out; all layers shown with the same color in one η tower are summed. The optical signals for HB, HE and HO are detected by hybrid photodiodes (HPD) with 19 independent pixels; 18 for read out of fibers and one for monitoring. The HPDs are designed to work inside the magnetic field, provided their axes are aligned with the magnetic field. This alignment is adequate for HB and HE, but it was found that the HO HPDs were off by as much as 40 degrees. This misalignment was due to the difficulty in simulating the magnetic field inside the return yoke. Therefore, an effort is under way to study the possible replacement of the HO HPDs with silicon photomultipliers that are insensitive to magnetic fields and have a better signal to noise discrimination.
In HF, quartz fibers of two different lengths are embedded in the steel, and are read sepa-rately. The calorimeter is thus functionally subdivided into two longitudinal segments (not shown in figure1). Long fibers (165 cm ≈ 10 interaction lengths) measure the total signal coming from the full material length, whereas short fibers measure the energy deposition after 22 cm of steel.
2010 JINST 5 T03012
This allows the separation of showers generated by electrons and photons from those generatedby hadrons. The photodetectors for HF are eight-stage photomultipliers (PMT) with a borosilicate glass window, which register the Cherenkov light produced by the charged shower particles in the quartz fibers.
The signals from both types of photodetectors are read by a custom-designed chip, which performs charge integration and encoding (QIE) [4]. The QIE is a non-linear multi-range analog to digital converter (ADC) that provides approximately constant fractional precision over a wide dynamic range. For each channel, the measured ADC value is converted into a charge measured in femtocoulomb (fC), using a conversion factor that was determined in the laboratory by charge injection into the QIE.
Each subsystem is equipped with laser and light emitting diodes (LED), for monitoring and calibration. In addition, the response of each HB and HE scintillator tile of each layer and each HF fiber can be measured using radioactive sources mounted on the tip of a moving wire [10].
The Electromagnetic Calorimeter (ECAL), made of lead tungstate crystals, is situated in front of HB and HE. The response and resolution of the CMS calorimeter system depends on both the ECAL and the HCAL, as most particles start showering in the ECAL. The hadronic to electro-magnetic (π/e) response ratios of the ECAL and the HCAL are different: typical values of π/e for the ECAL and the HCAL are 0.61 and 0.80 at 10 GeV/c, and 0.75 and 0.85 at 100 GeV/c, respectively [6]. The ECAL and the HCAL fraction of the energy deposited in each calorimeter varies non-linearly with energy and, as a result, the raw energy measurements require substantial corrections. Results from test beam studies are reported in [3–6].
Parts of the various HCAL subsystems were exposed to beams of electrons, pions, protons and muons, to measure their characteristics and to obtain a reference calibration. An ECAL module was also included in the test beam setup. The hadronic energy resolution of the barrel HCAL and ECAL combination being parameterized as σ /E = a/√E⊕ b, where a corresponds to a stochastic term and b to a constant term, one measures a = 0.847 ± 0.016 GeV12 and b = 0.074 ± 0.008 [4],
with E measured in GeV. The energy resolution in the endcaps is similar to that in the barrel. The corresponding values for HF are a = 1.98 GeV12 and b = 0.09 [3]. Since the forward jets typically
have very high energies, the stochastic term may be higher for HF than for the other calorimeters, while still providing the required energy resolution [3].
3 Impact of the magnetic field on the HCAL response
About 270 million cosmic ray muons were recorded during CRAFT with the magnetic field on. Typically, a muon event is triggered by the muon chambers and the muon momentum is measured by the central tracker and muon chambers. Clean signals were measured in most of the HCAL towers. The cosmic ray muons are used to measure the HPD gain to an accuracy of about 5% for HB and HO towers, and 10% for HE. Calibration corrections based on the study of the cosmic ray muon samples have been derived and applied for HB and HO, as discussed in section5.
Brightening corrections, of about 8-10%, applied to HB and HE calibration parameters to take into account the effects of the magnetic field were already obtained during MTCC, where it was possible to perform precise measurements using radioactive sources [1]. Cosmic ray muon data
2010 JINST 5 T03012
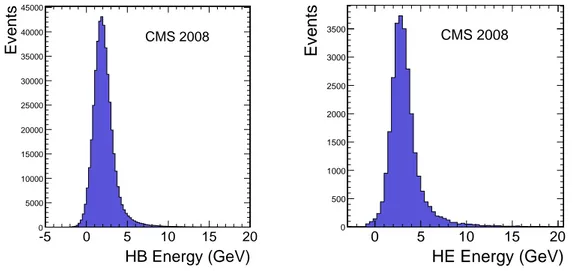
HB Energy (GeV) -5 0 5 10 15 20 Events 0 5000 10000 15000 20000 25000 30000 35000 40000 45000 CMS 2008 HE Energy (GeV) 0 5 10 15 20 Events 0 500 1000 1500 2000 2500 3000 3500 CMS 2008Figure 2. Cosmic ray muon energy deposition measured in HB (left) and HE (right) with B = 3.8 T for muon momenta above 7 GeV/c. HB and HE data samples consist of 450 and 27 thousand events, respectively.
from CRUZET and CRAFT allowed to test these corrections and to study the impact of the strong magnetic field in other parts of the HCAL system.
3.1 The barrel and endcap hadron calorimeters
A single muon traversing the HCAL deposits a few GeV in HB and HE. Figure2shows the en-ergy deposited in HB and HE by muons with momenta above 7 GeV/c, during CRAFT with the 3.8 T magnetic field. The means are consistent with the muon minimum ionizing signals measured for segments of the calorimeters in test beams [4,6], without magnetic field, for a wide momen-tum range after taking into account magnetic field effects, correcting the signal for the muon path length and normalizing to the thickness of HB at η = 0. The width of the distributions of the cosmic ray muons are broadened by the momentum spread of cosmic ray muons, since the energy deposition increases with momentum due to the relativistic rise. The measurement of the energy deposition by cosmic ray muons is performed using either the electron or the pion calibration of the calorimeter. As an example, the mean energy deposition of 150 GeV/c muons is calculated to be 2.4 GeV (2.8 GeV) if the electron (pion) calibration is used. For figure2, the pion calibration was used. The average values of the energy deposition is lower than 2.8 GeV because the average muon momenta is well below 100 GeV/c (see momentum spectrum given in figure10).
It is known [11–15], that the presence of a magnetic field increases the signal measured in scintillator based calorimeters. There are three sources contributing to this effect. The first of them is due to a chemical effect that causes an intrinsic brightness of the scintillator. Brightening is due to the polymer base of the scintillator and saturates at about 2 T. The maximum signal increase due to brightness ranges between 5% and 8%, depending on the composition of the plastic [15]. The field value at HB and HE is 3.8 T, which is well above the saturation value. The second source of signal increase is the curling of knock-on electrons in the magnetic field, which results in an increased path
2010 JINST 5 T03012
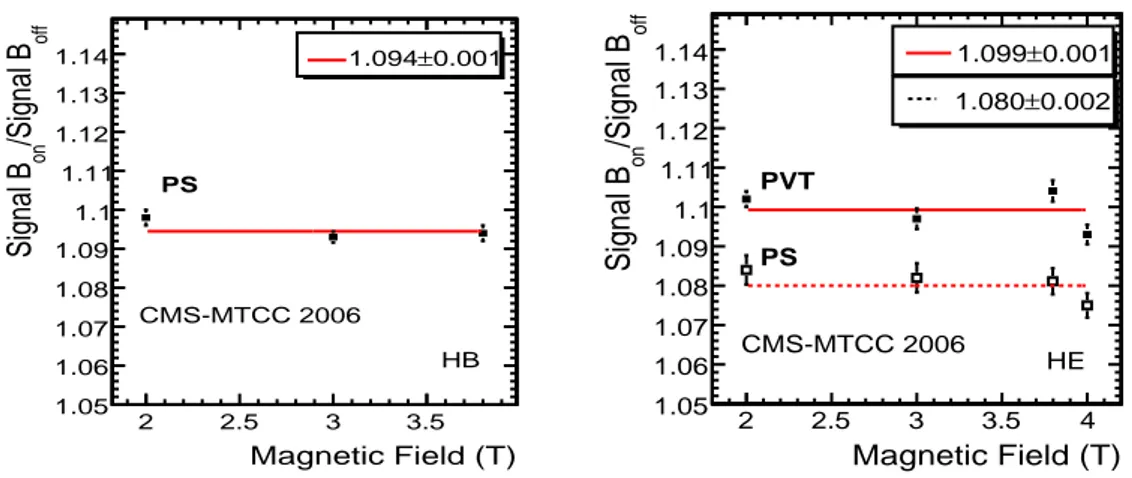
Magnetic Field (T) 2 2.5 3 3.5 off /Signal B on Signal B 1.05 1.06 1.07 1.08 1.09 1.1 1.11 1.12 1.13 1.14 p0 p0 p0 1.094 1.094 1.094 ± 0.0009949±± 0.0009949 0.0009949 0.001 ± 1.094 HB CMS-MTCC 2006 PS Magnetic Field (T) 2 2.5 3 3.5 4 off /Signal B on Signal B 1.05 1.06 1.07 1.08 1.09 1.1 1.11 1.12 1.13 1.14 p0 p0 1.099 1.099 ±± 0.001199 0.001199 HE p0 1.08 ± 0.00171 p0 1.08 ± 0.00171 p0 1.08 ± 0.00171 p0 1.08 ± 0.00171 p0 1.08 ± 0.00171 p0 1.08 ± 0.00171 0.001 ± 1.099 0.002 ± 1.080 CMS-MTCC 2006 PVT PSFigure 3. Ratio of the scintillator signals in a single layer with magnetic field on and off, measured using a radioactive source during MTCC. The left figure is for polystyrene (PS) in HB and the right figure is PVT (filled squares) and PS (open squares) in HE. The horizontal lines represent the averages of each data set. The difference for PS between HB and HE is due to the curling of the knock-on electrons and the magnetic field direction.
length of the electrons, and enhances the signal by 1-2%. Therefore, the signal increase depends on the nature of the particle impinging on the calorimeter, on the geometry and on the strength of the magnetic field. For this effect, the specific orientation of the magnetic field relative to the absorber plates is thus important and is different for HB and HE. At the LHC, the directions of particles emitted from the IP are essentially normal to the scintillator plane, the magnetic field direction is parallel to the scintillator plane in HB and perpendicular in HE. Previous measurements [15] and this study showed that the light yield increase due to the magnetic field is the same for muons and for particles from radioactive sources, while another complementary study [15] showed that the effect is different for pions and electrons, as electrons produce more knock-on electrons than pions. There is a third effect due to the HPD geometry. When a muon passes through a single tower, all the photons impinge on one single HPD pixel. However, the electrons from the photocathode spread out and up to 2% of the signal is measured in neighboring pixels, a phenomenon called cross talk. The magnetic field helps in reducing this cross talk, but any misalignment of the HPD axis with respect to the magnetic field axis increases the cross talk.
The magnetic field effect on the HCAL was observed by comparing the measurements per-formed with a moving radioactive wire source, with field on and with field off during the MTCC. The inners layer (Layer 0) of HB and HE and all layers of HO are made of 1 cm thick poly-mer polyvinyl toluene (PVT); all other layers of HB and HE are made of 0.4 cm thick polypoly-mer polystyrene (PS). Figure3shows the measurements performed at several magnetic field values for a typical polystyrene layer of HB (left) and for two layers of HE (right), one PVT and one PS. The PVT layer of HB was not installed during MTCC. The magnetic field effect on PS of 9.4% mea-sured in HB during MTCC agrees well with the expected value. The 2% difference in brightening between PVT and PS, shown in figure3(right), was also observed in an independent study [15]. For HE, a signal enhancement of about 6% is due to the increased brighteness of the polymer polystyrene, and the rest is due to the path length of the knock-on electrons. The comparison of
2010 JINST 5 T03012
Z-value (m) -5 0 5 Magnetic field (T) 0.2 0.4 0.6 0.8 1 R=4.07m R=3.82m Pedestal (GeV) -10 0 10 20 Events 0 100 200 300 400 HO Energy (GeV) -10 0 10 20 Events 0 200 400 600 CMS 2008Figure 4. Left: Magnetic field strength at the location of the HO scintillators, as calculated with the TOSCA
program [16]. The vertical lines indicate the ring borders. Ring 0 has two scintillator layers, at radii 3.82 m
and 4.07 m, respectively. Right: Pedestal and cosmic ray muon signal in Ring 0 of HO.
CRAFT and CRUZET data reveals a net signal enhancement at 3.8 T of 1.090 ± 0.005 for HB and 1.084 ± 0.013 for HE, consistent with the MTCC measurements of 1.094 ± 0.001 for HB and 1.080 ± 0.002 for HE.
3.2 The outer hadron calorimeter
All scintillator layers in HO are made of 1 cm thick PVT. Ring 0 has two scintillator layers, while Rings 1 and 2 have a single scintillator. Figure4(left) shows the field strength at the position where the scintillators are located. The first scintillator layer of Ring 0, at a radius of 3.82 m, is located in a region with a very small magnetic field. The signals in the two layers in Ring 0 are added optically and the brightening effect is the average of the effects in the two scintillator layers. The other scintillator layers are at a radial distance of 4.07 m from the beam line, where the magnetic field is more important. The scintillator brightening for Ring 0 is about 1%, and for Rings 1 and 2 it varies between 2% and 4%. This is to be compared to the 8-10% effect observed in HB and HE above 2 T.
Cosmic ray muon signals are observed in all rings of HO. In Ring 0, with two scintillator layers, the signals are twice as large as in Rings 1 and 2. Figure4(right) shows the distributions of the pedestal and the pedestal subtracted muon signal in Ring 0.
3.3 The forward hadron calorimeter
The magnetic field strength in the HF region is significantly reduced compared to that in the HB and HE regions, allowing the use of conventional PMTs.
During CRAFT, the magnetic field at the PMT locations was measured to be less than 0.03 T, and proper PMT operation was verified at full magnet current. Each PMT is shielded with individ-ual tubes made of a nickel-iron alloy and of soft iron. HF was fully operational and stable during CRAFT and the LHC startup.
2010 JINST 5 T03012
In the CMS cavern, the number of cosmic ray muons decreases significantly with increasingincidence angle relative to the vertical direction. Therefore, it was not possible to validate the cali-bration of HF channels with the CRAFT data, due to the lack of muons in the horizontal direction. The LHC startup data from September 2008, however, proved useful in validating the calibra-tion constants, and will be discussed in seccalibra-tion5. Occasional abnormally large signals were found in individual HF channels during the LHC startup. The signals were found to be due to muons striking directly the window faces of individual PMTs. Algorithms for rejecting such abnormal signals, by comparing the energies reconstructed from long and short fibers with the same (η, φ ) values, were subsequently developed based on these data [17]. The LHC beam halo data show that the current algorithms can reduce the rate of such abnormal signals by a factor of one thousand. 4 Optimization of the HCAL operation using CRAFT data
This section describes the information obtained from CRAFT about noise levels, detector stability and optimization of hardware settings, like high voltage and zero-suppression parameters, which could influence the HCAL energy resolution.
The HCAL has a total of 2592 channels in HB, 2592 in HE, 1728 in HF and 2160 in HO. At the beginning of CRAFT, 99.3% of HB, HE and HF, and 95.5% of HO channels were operational. About 75% of the non-operating channels had photodetector (HPD or PMT) problems and the rest had electronics failures of various types.
Several HPDs, about 10% of the total, functioned poorly when the magnetic field reached full strength. The high voltage for those channels was either reduced by 1.5 kV, leading to a ∼ 30% reduction in gain, or was completely turned off. After this action was taken, 87% of the HCAL was operating at the nominal high voltage of 7.5 kV both for the barrel and the endcaps. No evidence of further degradation of HPD functioning was observed during CRAFT. In HF, which employs PMTs, the high voltage was set at 1.25 kV as originally planned.
The problematic HPDs were replaced after CRAFT. As of September 2009, all the channels in the barrel, endcap and forward regions are operational at full magnetic field, while the number of non-operational channels in HO is at the level of 2%. As a precaution, the nominal high voltage during LHC collisions will be set 0.5 kV lower than in CRAFT for the barrel and the endcaps, at a cost of a 12% reduction in gain. The impact on jet energy resolution is small, of the order of 5%. 4.1 Performance of photodetectors and impact on the trigger
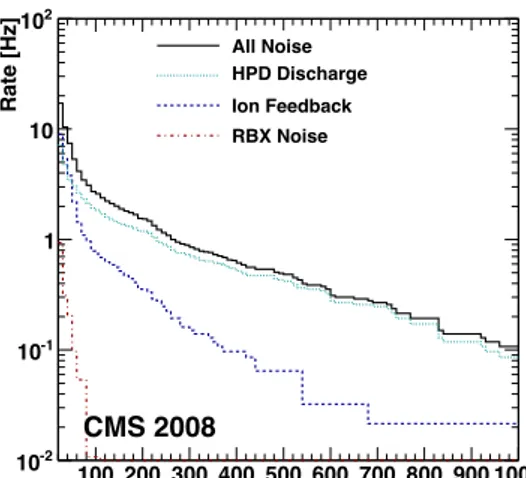
During CRAFT, the rate of HPD noise replicating an energy deposit of 20 GeV or more in a single channel was below 0.2 Hz [17], after the malfunctioning HPDs were excluded. Figure5shows the measured total noise rate for all trigger towers in the barrel and the endcaps, as a function of the energy threshold. The signals of the longitudinal segments of a tower are added to form a trigger tower in HB, in HB-HE interface region and in HE (figure 1). Three sources contribute to this noise rate [17]: (a) the ion feedback inside the HPD (two to three neighboring HPD pixels with energy greater than 1 GeV), which affects mainly single channels, (b) the noise from the whole HPD, which affects 18 channels simultaneously (all HPD pixels with energy greater than 1 GeV), and (c) coherent noise in a readout box (RBX), which affects a full set of 72 channels (all channels with energy greater than 1 GeV); one readout box includes the signals from four HPDs. The ion
2010 JINST 5 T03012
Trigger Tower Hadronic Energy Threshold [GeV] 100 200 300 400 500 600 700 800 900 1000 Rate [Hz] -2 10 -1 10 1 10 2 10 CMS 2008 All Noise HPD Discharge Ion Feedback RBX Noise
Figure 5. Total noise rate for around 4000 trigger towers as a function of the energy threshold, during CRAFT with the magnet at full field. A minimum energy of 20 GeV was required in at least one HB or HE readout box (RBX). About 280 HPDs, corresponding to 5040 channels of HB and HE, are included in the analysis; HPDs that were replaced in the beginning of 2009 are excluded.
feedback is predominantly caused by a thermally emitted electron that ionizes the residual gas inside the HPD acceleration gap. The ion is accelerated back to the cathode and liberates further electrons, causing a signal equivalent to many photoelectrons. Misalignment of the HPD axis with respect to the axis of the solenoidal field can reduce the voltage of the HPD above which electrical discharges can occur. This can lead to an avalanche of secondary electrons, producing significant energy deposition in a large number of channels within an HPD. This is the main noise contribution above 100 GeV and is referred to as “HPD discharge”. The cause of the readout box coherent noise is not yet understood, but measurements show that it does not have an impact on the trigger and can be easily identified during the event reconstruction.
The HPD noise, with or without magnetic field, has a small impact on the total trigger rate. For example, without magnetic field and with a threshold of 10 GeV, the HCAL self-trigger rate is 130 Hz; at full field the rate increases by 40 Hz. This is to be compared with the 100 kHz trigger rate expected during collisions. Furthermore, the rate decreases rapidly as a function of the applied threshold, as seen in figure5.
Special triggers to monitor the HPD noise rate, offline software to identify the corresponding atypical signals at the event reconstruction level [17], and the corresponding simulation tools have been developed and are available. Initial tests on data show that the algorithms for identifying noise and problematic channels correctly mark both persistent and sporadic known problems with high efficiency.
4.2 Performance of readout electronics and impact on energy thresholds
The electronic noise and the pedestals in the QIE chips were found to be stable during CRAFT. The QIE chips read the signal over four time intervals of 25 ns each, using four pipeline-channels (numbered 0 to 3), and output four ADC values; the cycle repeats every 100 ns. For each QIE one measures four pedestal values of a few ADC counts each (one for each 25 ns time interval),
2010 JINST 5 T03012
Run Number 67500 68000 68500 69000 ADC counts 2 2.5 3 3.5 4 4.5 5 Pipeline Channel Avg # 0 # 1 # 2 # 3 CMS 2008 Energy (GeV) 0.3 0.4 0.5 0.6 0.7Number of 25 ns time bins summed
0 2 4 6 8 10
Width relative to 1 channel
0 0.5 1 1.5 2 2.5 3 Uncorrelated noise HE Noise HB Noise CMS 2008
Figure 6. Left: The four pedestal values corresponding to the four 25 ns channels and their average, for one HB calorimeter tower over a period of 10 days. Right: The measured pedestal width in HB and HE when
averaging over several (1 to 9) time slices (TS). The solid line represents the expected noise (∝√n) in the
absence of correlations. The signal reconstruction will sum four TS at low luminosity and two TS at high luminosity. The single channel noise at 7.5 kV for 1 TS is 140 and 200 MeV for HB and HE, respectively.
which are subtracted from the corresponding signal. The left plot in figure6shows the values of the four pedestals and their averages for a particular HB tower, over a period of ten days. There is a small variation of the individual pipeline-channel pedestals over time, with a strong anti-correlation among them. The average of the four pedestals does not change over this time period.
The four pedestal values are correlated due to the integration of the pulse shaper, as demon-strated in the right plot of figure6. This figure shows the observed noise averaged over a variable number n (from 1 to 9) of 25 ns time periods, compared to the increase as √n expected in the absence of correlations. These noise correlations have been included in the HCAL simulation.
The width of the pedestal distribution allows one to estimate the QIE electronic noise. For ex-ample, the measured electronic noise during CRAFT in a single time slice corresponds to an equiv-alent energy in a tower of 140 MeV for HB, 200 MeV for HE, 280 MeV for HO and 370 MeV for HF (the larger HF noise remains small compared to the energy corresponding to a single photoelec-tron, 4 GeV, and to the typical energies of particles impinging HF). The increase when integrating over more than one time slice is modest, as can be inferred from figure6(right).
The HCAL information obtained from a tower is not recorded if the signal is below a threshold, that is, the HCAL data are “zero-suppressed”. The information of a tower is kept only if the sum of ADC counts in two adjacent time slices is larger than 2 counts above pedestal for HB, 3 counts for HE/HO, and 4 counts for HF. After taking into account the final high voltage settings planned for collision data, these thresholds correspond to ∼400 MeV for HB, ∼700 MeV for HE, ∼1 GeV for Ring 0 of HO, and ∼1 GeV for HF. These threshold values were selected such that the HCAL occupancy is reduced to about 20% at the nominal LHC luminosity. Since some towers, which contain little energy, are eliminated by zero-suppression, this can reduce the measurement accuracy. However, since the energy thresholds for zero-suppression are well below the energy threshold applied in the jet reconstruction, and since a shower is distributed over many towers,
2010 JINST 5 T03012
zero-suppression will have little effect on jet and single high energy hadron energy measurements.It can, however, affect the HCAL energy measurement for low-momentum muons (pµ< 10 GeV/c)
traversing a single tower and all muons traversing multiple towers. 5 Calibrations using cosmic ray muons and LHC beams
The calibration of the HCAL has been performed using several techniques. First, test beam setups were used to determine, for parts of the HCAL subsystems, the detector response to radioactive sources and to electrons, muons and hadrons of known momenta. Then, the intercalibrations of all channels in HB, HE, and HF were performed with radioactive sources mounted on moving wires, exactly as was done in the test beam setups. These source measurements also propagate the absolute energy scale for each subsystem. The energy scale for the reference Co60source was made with respect to 50 GeV/c pions in the case of HB and HE, while for HF 100 GeV/c electrons were used. A total of 31 beam splash events from the beam arriving from the +z side and 35 events from the −z side were recorded during the 2008 LHC commissioning exercise, with the CMS magnetic field off. In these events, muons from secondary decays penetrated the detector. Since the scintillator planes of HB and HO are parallel to the beam line, the muons from splash events traverse the full length of the scintillators giving a very large signal. The splash events could not be used to study the absolute energy scale calibration because their energy and muon flux is not accurately known. However, these events were helpful for measuring the relative scale between φ sectors and between the ±z halves of HB and the two HE endcaps.
The initial calibration obtained from measurements with radioactive sources was tested, and in some cases improved, using cosmic ray muons and the beam splash events for a significant fraction of HB channels. However, since cosmic ray muons in the CMS cavern are essentially vertical, HB φ sectors in the horizontal plane near φ = 0◦(sectors 71, 72, 1 to 4) and near φ = 180◦(sectors 33 to 38) were not included in this study, while in HO all channels were calibrated using cosmic ray muons. All channels in HE and HF were mainly tested with beam splash events.
To ensure good energy measurement, only events collected without zero-suppression are used in the calibration studies.
5.1 The barrel and endcap hadron calorimeters
All HB and HE scintillator tiles had their response measured in-situ using either 1.5 or 5 mCi Co60 sources. The averages of the signals in the 17 layers of HB and HE were used to equalize the response of all HB and HE towers. The absolute energy scale was set using the response to 50 GeV/c charged pions of the parts of the detector exposed to the test beam studies.
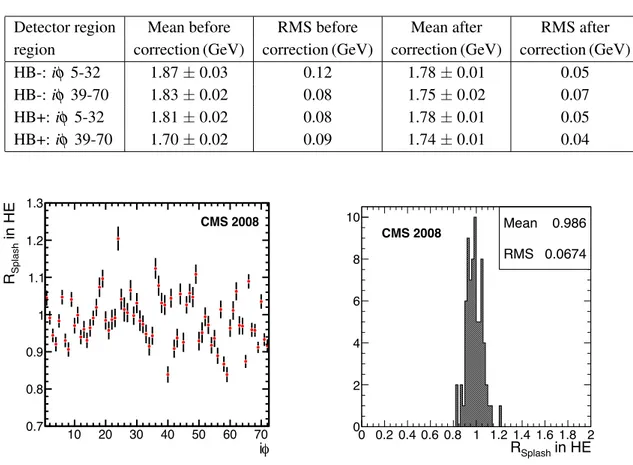
The cosmic ray muons and splash events were used to check the initial calibration conditions. The results from both methods point to non-uniformities in HB calorimeter response in different φ sectors, and to a difference in the energy scale between the two halves of HB. Figure7(left) shows the ratio of the muon signal amplitudes in HB for z < 0 and z > 0 for cosmic ray muon events, RCosmic, as a function of the φ sector index, iφ . While figure7(right) shows that measurements
for this ratio based on cosmic ray muons and beam splash events, RSplash, have a 75% correlation.
The average ratio deviates from unity by ∼7% with a sector-by-sector spread of about 10% (see table1). The source of these differences is not understood at this time.
2010 JINST 5 T03012
! i 10 20 30 40 50 60 70 in HB Cosmic R 0.9 1 1.1 1.2 1.3 1.4 CMS 2008 Uncorrected in HB Cosmic R 0.9 1 1.1 1.2 1.3 1.4 in HB Splash R 0.9 1 1.1 1.2 1.3 1.4 CMS 2008 UncorrectedFigure 7. Left:Ratio, for cosmic ray muons, of the average signal amplitudes in the two halves (+z and −z) of HB, as a function of the φ sector index, iφ , after correcting the average signal for the muon path length and normalizing to the thickness of HB at η = 0. Right: Correlation between cosmic ray muon and splash muon signals, for the ratio of the average signal in the two halves of HB. The splash muon signals were corrected for the asymmetry in the muon flux by comparing the events from the beam arriving from the +z side and the −z side.
! i 10 20 30 40 50 60 70 Signal in HB (GeV) 1 1.2 1.4 1.6 1.8 2 2.2 2.4 HCAL Barrel -Z HCAL Barrel +Z CMS 2008 Uncorrected ! i 10 20 30 40 50 60 70 Signal in HB (GeV) 1 1.5 2 2.5 HCAL Barrel -Z HCAL Barrel +Z Corrected
Figure 8. Cosmic ray muon signal in HB averaged over all η values for each φ sector, iφ , before (left) corrections for a sample of ∼400 thousand events and after (right) corrections for sample of ∼80 thousand events. The triangles (open squares) represent the results for the +z (−z) side of the detector. The mean and
RMS values for the muon signals for four HB regions are presented in table1.
The results from the cosmic ray muons were used to correct the calibration of the various HPDs, with one single parameter applied to all channels contained in a given φ sector of one of the two ±z halves of HB. Only muons traversing a single φ sector and less than five η channels
2010 JINST 5 T03012
Table 1. Mean and RMS of the muon energy distributions measured in four regions of HB, before and after correcting the calibration constants using cosmic ray muon data information.
Detector region Mean before RMS before Mean after RMS after
region correction (GeV) correction (GeV) correction (GeV) correction (GeV)
HB-: iφ 5-32 1.87 ± 0.03 0.12 1.78 ± 0.01 0.05 HB-: iφ 39-70 1.83 ± 0.02 0.08 1.75 ± 0.02 0.07 HB+: iφ 5-32 1.81 ± 0.02 0.08 1.78 ± 0.01 0.05 HB+: iφ 39-70 1.70 ± 0.02 0.09 1.74 ± 0.01 0.04 ! i 10 20 30 40 50 60 70 in HE Splash R 0.7 0.8 0.9 1 1.1 1.2 1.3 CMS 2008 Mean 0.986 RMS 0.0674 in HE Splash R 0 0.2 0.4 0.6 0.8 1 1.2 1.4 1.6 1.8 2 0 2 4 6 8 10 Mean 0.986 RMS 0.0674 CMS 2008
Figure 9. Left: Ratio, of the splash muons, of the average signal amplitudes in the two HCAL endcaps, −z and +z, as a function of the φ sector index, iφ . Right: Corresponding distribution of the signal ratios.
were used in the analysis. About half a million CRAFT muons with momentum below 100 GeV/c remain after the full event selection. Sector 13 of HB, where an HPD was replaced before CRAFT, was excluded from these studies. Figure8shows the peak value of the distribution of the average energy deposited in HB by cosmic ray muons, averaged over all η values of a given φ sector for two independent data samples. The plot on the left shows the results for the data used to determine the corrections, while the plot on the right shows the results after the corrections are applied to a smaller but independent data sample. Table1presents the corresponding results for four HB regions. After corrections, the signal spread is smaller and the differences between the mean values for the four regions of HB is significantly reduced, reflecting the improvement of the HPD intercalibration. The mean muon energy measured in this analysis is smaller than the one shown in figure2because only tracks with a momentum below 100 GeV/c were used.
Similar studies were performed for HE with a limited number of cosmic ray muon events and all splash events. The ratio of the muon signals for the two endcaps as a function of the φ sector index is shown in figure9(right) for splash events. The RSplash mean and the spread of this ratio
are shown in figure9(left). The average is consistent with unity and the spread is smaller than 7%. Therefore, no correction to the HE calibration was made.
2010 JINST 5 T03012
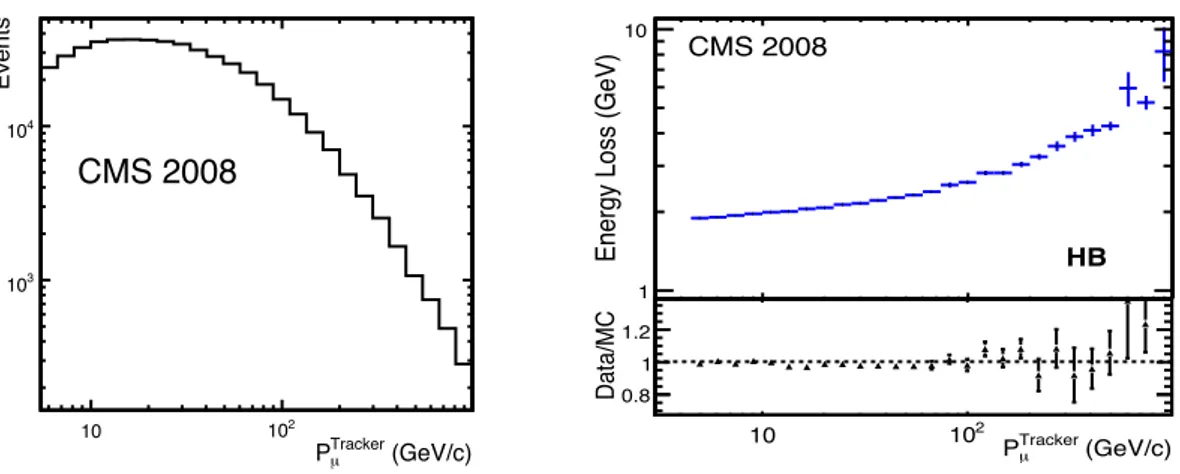
(GeV/c) µ Tracker P 10 2 10 Events 3 10 4 10 CMS 2008 (GeV/c) µ P 10 102Energy Loss (GeV)
1 10 CMS 2008 HB (GeV/c) Tracker µ P 10 102 Data/MC0.8 1 1.2
Figure 10. Left: Momentum spectrum of the muons selected by this analysis. Right: (top) Energy loss of cosmic ray muons in HB after correcting the signal mean value for the muon path length and normalizing to the thickness of HB at η = 0; (bottom) ratio of data and Monte Carlo simulation predictions (arbitrary scale) for the bottom half of the calorimeter.
Cosmic ray muons were also used to validate the absolute energy scale and the material de-scription in HB and HE simulations [18]. The absolute energy scale was tested by comparing the energy loss of muons measured at a test beam and in CRAFT, at a fixed muon momentum. From the test beam data it was derived that 150 GeV/c muons deposited 2.80±0.03 GeV in HB [6]. The energy loss measured from CRAFT data, after taking into account the magnetic field effects and the muon path length, is 2.85 GeV with a statistical error of 0.02 GeV for the momentum range between 135 and 170 GeV/c. This measurement is in good agreement with the test beam result. A wide muon momentum range was used to test the simulation. Figure10(left) shows the cosmic ray muon energy spectrum measured with the tracker. Figure10(right top) shows the muon energy deposited in a calorimeter tower, corrected for the path length and normalized to the thickness of HB at η = 0, that is, 110 cm. The relativistic rise of the energy loss for muons between 6 and 1000 GeV/c is clearly observed and is consistent with expectations [19]. Figure10(right bottom) illustrates the consistency of the data and simulation [18] as a function of the track momentum; the data to simulation ratio shown at an arbitrary scale.
5.2 The outer hadron calorimeter
Since the HO scintillators were not precalibrated with the radioactive source, the calibration of each tower was performed using cosmic ray muons from CRUZET, at a uniform high voltage value of 8 kV. This calibration agrees well with the measurements performed at a test beam [6].
Figure 11 shows the mean values of the muon signals in HO, given in ADC counts for
CRUZET data. The structure within each ring reflects the differences in signal attenuation caused by the varying length of the fibers that carry the signals to the photodetectors.
5.3 The forward hadron calorimeter
The calibration for HF was obtained from measurements with radioactive sources and from test beam data. Five HF wedges were precalibrated at the test beam with 100 GeV/c electrons [3] and
2010 JINST 5 T03012
ηi
-15 -10 -5 0 5 10 15
ADCs per minimum ionizing signal 0 0.5 1 1.5 2 2.5 3 3.5 CMS 2008
Figure 11. Mean values of the signals measured for a minimum ionizing muon in HO as a function of the η index, iη. The vertical lines indicate the borders of the rings. The differences in signal size between Ring 0 and Rings 1 or 2 are due to the fact that Ring 0 contains two layers of scintillators, for which the signals are added optically. The structure reflects the differences in the fiber lengths.
(GeV/ADC) Source C 0 0.1 0.2 0.3 0.4 0.5 0.6 (GeV/ADC) electrons C 0 0.1 0.2 0.3 0.4 0.5 0.6 CMS 2008 long fibers short fibers
Figure 12. The signal in GeV/ADC for 100 GeV/c electrons from the test beam (vertical axis) versus the radioactive source in GeV/ADC for the same η, φ space, for short (crosses) and long (circles) fibers for HF+ and HF−. This information was used to set the energy scale of the calibration obtained with the radioactive source method.
with a 5 mCi Co60 source. Figure 12 displays the good correlation between the signals of the electrons and the source measurement in the same η, φ sector, separately for short (crosses) and long (circles) fibers. The average value for the calibration coefficients of the short (long) fibers is 0.34 (0.21) GeV/fC. This information was used to set the energy scale for all the channels which were not exposed to the beam, using the results of their measurement with the radioactive source.
The monitoring of the HF calibration relies on single photoelectron distributions (SPE) mea-suments performed with the LED system. Earlier measurements performed at a test beam showed that 25 SPEs are equivalent to 100 GeV [3]. The major difference between using the SPE measure-ments and using a radioactive source is that the SPE characterizes the PMT performance alone, while the radioactive source creates Cherenkov light inside the detector which in turn detected by
2010 JINST 5 T03012
SPE / CC Source CC 0 0.5 1 1.5 2 2.5 3 3.5 4 Entries 1 10 HF RMS = 0.19 CMS 2008 (GeV/fC) Source CC 0 0.05 0.1 0.15 0.2 0.25 0.3 0.35 (GeV/fC) SPE CC 0 0.05 0.1 0.15 0.2 0.25 0.3 0.35 CMS 2008Figure 13. The calibration coefficients (CC) for HF+ and HF− obtained with the SPE (single photoelectron) method are compared to the standard values obtained with the radioactive source method before (left plot shows ratio) and after (right plot shows correlation) correcting the calibration, see text. The ratio of the two sets of constants is around 1.1 because the measurements were performed with a different HV setup.
the PMTs. Therefore, the light collection efficiency and the PMT photocathode sensitivity are taken into account in the source calibration, but not in the SPE technique. However, if the attenuation of Cherenkov light as it propagates from the fiber to the PMT is only affected by small variations from channel to channel, or if the attenuation is negligible, the two calibration techniques should be equivalent.
A comparison between the results obtained with the radioactive source and new SPE mea-surements, performed after the final HF installation, revealed that 20 of the 1728 channels had inconsistent calibration, see figure 13 (left). The beam splash events confirmed this calibration problem since the same channels were found to show an energy response inconsistent with their neighbors. Therefore, for those channels the source calibration constants were replaced by the SPE constants.
Figure13(right) shows the correlation between the calibration coefficients obtained from sin-gle photoelectron distributions and the coefficients obtained from the radioactive source calibration, after correcting the few outliers mentioned above.
6 Summary
The performance of the CMS hadron calorimeter has been studied using cosmic ray and beam splash events, providing improved calibrations with respect to those obtained in test beam data and with radioactive sources.
As a result of this calibration effort, the barrel portion is intercalibrated to the level of 5%, for 85% of the channels. The other HCAL portions have all their channels intercalibrated to better than 10% (HE), 12% (HF) and 5% (HO). Furthermore, the presence of the magnetic field results in a measured increase of the signal, by 9.4% in HB and 8% in HE, as expected.
Noise studies have been performed, showing that noise will contribute a trigger rate of around 100 Hz. This rate is stable.
2010 JINST 5 T03012
In conclusion, the CRAFT data and the beam splash events from 2008 provided an improvedcalibration of the HCAL. This subdetector is now ready for LHC collisions. Acknowledgments
We thank the technical and administrative staff at CERN and other CMS Institutes, and acknowl-edge support from: FMSR (Austria); FNRS and FWO (Belgium); CNPq, CAPES, FAPERJ, and FAPESP (Brazil); MES (Bulgaria); CERN; CAS, MoST, and NSFC (China); COLCIEN-CIAS (Colombia); MSES (Croatia); RPF (Cyprus); Academy of Sciences and NICPB (Estonia); Academy of Finland, ME, and HIP (Finland); CEA and CNRS/IN2P3 (France); BMBF, DFG, and HGF (Germany); GSRT (Greece); OTKA and NKTH (Hungary); DAE and DST (India); IPM (Iran); SFI (Ireland); INFN (Italy); NRF (Korea); LAS (Lithuania); CINVESTAV, CONACYT, SEP, and UASLP-FAI (Mexico); PAEC (Pakistan); SCSR (Poland); FCT (Portugal); JINR (Arme-nia, Belarus, Georgia, Ukraine, Uzbekistan); MST and MAE (Russia); MSTDS (Serbia); MICINN and CPAN (Spain); Swiss Funding Agencies (Switzerland); NSC (Taipei); TUBITAK and TAEK (Turkey); STFC (United Kingdom); DOE and NSF (USA). Individuals have received support from the Marie-Curie IEF program (European Union); the Leventis Foundation; the A. P. Sloan Founda-tion; and the Alexander von Humboldt Foundation.
References
[1] CMS collaboration, The CMS experiment at the CERN LHC,2008 JINST 3 S08004.
[2] L. Evans and P. Bryant eds., LHC Machine,2008 JINST 3 S08001.
[3] CMS HCAL collaboration, Design, performance and calibration of the CMS forward calorimeter
wedges,Eur. Phys. J.C 53 (2008) 139.
[4] CMS HCAL collaboration, Design, performance and calibration of CMS hadron-barrel calorimeter
wedges,Eur. Phys. J.C 55 (2008) 159.
[5] CMS HCAL collaboration, Design, performance and calibration of the CMS hadron-outer
calorimeter,Eur. Phys. J.C 57 (2008) 653.
[6] USCMS collaboration, The CMS barrel calorimeter response to particle beams from 2 GeV/c to
350 GeV/c,Eur. Phys. J.C 60 (2009) 359.
[7] T. Christiansen, The CMS magnet test and cosmic challenge,arXiv:0805.1882.
[8] CMS collaboration, Commissioning of the CMS experiment and the cosmic run at four tesla,2010
JINST 5 T03001.
[9] CMS collaboration, Performance of CMS hadron calorimeter timing and synchronization using test
beam, cosmic ray, and LHC beam data,2010 JINST 5 T03013.
[10] E. Hazen et al., Radioactive source calibration technique for the CMS hadron calorimeter,Nucl.
Instrum. Meth.A 511 (2003) 311.
[11] S. Bertolucci et al., Influence of magnetic fields on the response of acrylic scintillators,Nucl. Instr.
Meth.A 254 (1987) 561.
[12] J.P. Cumulat, H.W.K. Cheung, J. Hassed, B.D. Smith and A.D. Bross, Effects of magnetic fields on
2010 JINST 5 T03012
[13] D. Blomker, U. Holm, R. Klanner and B. Krebs, Plastic scintillators in magnetic fields,Nucl.
Instrum. Meth.A 311 (1992) 505.
[14] J. Mainusch, F. Corriveau, R. Klanner and G. Levman, Influence of magnetic fields on the response of
a uranium scintillator sampling calorimeter,Nucl. Instrum. Meth.A 312 (1992) 451.
[15] M. Bertoldi et al., Scintillators in magnetic fields up to 20-T,Nucl. Instrum. Meth.A 386 (1997) 301.
[16] J. Simkin and C.W. Trowbridge, Three-Dimensional Computer Program (TOSCA) for Nonlinear Electromagnetic Fields, technical report CCLRC, RL-79-097 (1979).
[17] CMS collaboration, Identification and filtering of uncharacteristic noise in the CMS hadron
calorimeter,2010 JINST 5 T03014.
[18] S. Banerjee, Readiness of CMS Simulation Towards LHC Startup,J. Phys. Conf. Ser.119 (2008)
032006.
[19] PARTICLEDATAGROUPcollaboration, C. Amsler et al., Review of particle physics,Phys. Lett.B
2010 JINST 5 T03012
The CMS collaborationYerevan Physics Institute, Yerevan, Armenia S. Chatrchyan, V. Khachatryan, A.M. Sirunyan
Institut f ¨ur Hochenergiephysik der OeAW, Wien, Austria
W. Adam, B. Arnold, H. Bergauer, T. Bergauer, M. Dragicevic, M. Eichberger, J. Er¨o, M. Friedl, R. Fr¨uhwirth, V.M. Ghete, J. Hammer1, S. H¨ansel, M. Hoch, N. H¨ormann, J. Hrubec, M. Jeitler, G. Kasieczka, K. Kastner, M. Krammer, D. Liko, I. Magrans de Abril, I. Mikulec, F. Mittermayr, B. Neuherz, M. Oberegger, M. Padrta, M. Pernicka, H. Rohringer, S. Schmid, R. Sch¨ofbeck, T. Schreiner, R. Stark, H. Steininger, J. Strauss, A. Taurok, F. Teischinger, T. Themel, D. Uhl, P. Wagner, W. Waltenberger, G. Walzel, E. Widl, C.-E. Wulz
National Centre for Particle and High Energy Physics, Minsk, Belarus
V. Chekhovsky, O. Dvornikov, I. Emeliantchik, A. Litomin, V. Makarenko, I. Marfin, V. Mossolov, N. Shumeiko, A. Solin, R. Stefanovitch, J. Suarez Gonzalez, A. Tikhonov
Research Institute for Nuclear Problems, Minsk, Belarus A. Fedorov, A. Karneyeu, M. Korzhik, V. Panov, R. Zuyeuski Research Institute of Applied Physical Problems, Minsk, Belarus P. Kuchinsky
Universiteit Antwerpen, Antwerpen, Belgium
W. Beaumont, L. Benucci, M. Cardaci, E.A. De Wolf, E. Delmeire, D. Druzhkin, M. Hashemi, X. Janssen, T. Maes, L. Mucibello, S. Ochesanu, R. Rougny, M. Selvaggi, H. Van Haevermaet, P. Van Mechelen, N. Van Remortel
Vrije Universiteit Brussel, Brussel, Belgium
V. Adler, S. Beauceron, S. Blyweert, J. D’Hondt, S. De Weirdt, O. Devroede, J. Heyninck, A. Kalogeropoulos, J. Maes, M. Maes, M.U. Mozer, S. Tavernier, W. Van Doninck1, P. Van Mulders, I. Villella
Universit´e Libre de Bruxelles, Bruxelles, Belgium
O. Bouhali, E.C. Chabert, O. Charaf, B. Clerbaux, G. De Lentdecker, V. Dero, S. Elgammal, A.P.R. Gay, G.H. Hammad, P.E. Marage, S. Rugovac, C. Vander Velde, P. Vanlaer, J. Wickens Ghent University, Ghent, Belgium
M. Grunewald, B. Klein, A. Marinov, D. Ryckbosch, F. Thyssen, M. Tytgat, L. Vanelderen, P. Verwilligen
Universit´e Catholique de Louvain, Louvain-la-Neuve, Belgium
S. Basegmez, G. Bruno, J. Caudron, C. Delaere, P. Demin, D. Favart, A. Giammanco, G. Gr´egoire, V. Lemaitre, O. Militaru, S. Ovyn, K. Piotrzkowski1, L. Quertenmont, N. Schul
Universit´e de Mons, Mons, Belgium N. Beliy, E. Daubie
Centro Brasileiro de Pesquisas Fisicas, Rio de Janeiro, Brazil G.A. Alves, M.E. Pol, M.H.G. Souza
2010 JINST 5 T03012
Universidade do Estado do Rio de Janeiro, Rio de Janeiro, BrazilW. Carvalho, D. De Jesus Damiao, C. De Oliveira Martins, S. Fonseca De Souza, L. Mundim, V. Oguri, A. Santoro, S.M. Silva Do Amaral, A. Sznajder
Instituto de Fisica Teorica, Universidade Estadual Paulista, Sao Paulo, Brazil T.R. Fernandez Perez Tomei, M.A. Ferreira Dias, E. M. Gregores2, S.F. Novaes Institute for Nuclear Research and Nuclear Energy, Sofia, Bulgaria
K. Abadjiev1, T. Anguelov, J. Damgov, N. Darmenov1, L. Dimitrov, V. Genchev1, P. Iaydjiev, S. Piperov, S. Stoykova, G. Sultanov, R. Trayanov, I. Vankov
University of Sofia, Sofia, Bulgaria
A. Dimitrov, M. Dyulendarova, V. Kozhuharov, L. Litov, E. Marinova, M. Mateev, B. Pavlov, P. Petkov, Z. Toteva1
Institute of High Energy Physics, Beijing, China
G.M. Chen, H.S. Chen, W. Guan, C.H. Jiang, D. Liang, B. Liu, X. Meng, J. Tao, J. Wang, Z. Wang, Z. Xue, Z. Zhang
State Key Lab. of Nucl. Phys. and Tech., Peking University, Beijing, China Y. Ban, J. Cai, Y. Ge, S. Guo, Z. Hu, Y. Mao, S.J. Qian, H. Teng, B. Zhu Universidad de Los Andes, Bogota, Colombia
C. Avila, M. Baquero Ruiz, C.A. Carrillo Montoya, A. Gomez, B. Gomez Moreno, A.A. Ocampo Rios, A.F. Osorio Oliveros, D. Reyes Romero, J.C. Sanabria
Technical University of Split, Split, Croatia
N. Godinovic, K. Lelas, R. Plestina, D. Polic, I. Puljak University of Split, Split, Croatia
Z. Antunovic, M. Dzelalija
Institute Rudjer Boskovic, Zagreb, Croatia V. Brigljevic, S. Duric, K. Kadija, S. Morovic University of Cyprus, Nicosia, Cyprus
R. Fereos, M. Galanti, J. Mousa, A. Papadakis, F. Ptochos, P.A. Razis, D. Tsiakkouri, Z. Zinonos National Institute of Chemical Physics and Biophysics, Tallinn, Estonia
A. Hektor, M. Kadastik, K. Kannike, M. M¨untel, M. Raidal, L. Rebane Helsinki Institute of Physics, Helsinki, Finland
E. Anttila, S. Czellar, J. H¨ark¨onen, A. Heikkinen, V. Karim¨aki, R. Kinnunen, J. Klem, M.J. Kortelainen, T. Lamp´en, K. Lassila-Perini, S. Lehti, T. Lind´en, P. Luukka, T. M¨aenp¨a¨a, J. Nysten, E. Tuominen, J. Tuominiemi, D. Ungaro, L. Wendland
Lappeenranta University of Technology, Lappeenranta, Finland K. Banzuzi, A. Korpela, T. Tuuva
Laboratoire d’Annecy-le-Vieux de Physique des Particules, IN2P3-CNRS, Annecy-le-Vieux, France
2010 JINST 5 T03012
DSM/IRFU, CEA/Saclay, Gif-sur-Yvette, FranceM. Besancon, R. Chipaux, M. Dejardin, D. Denegri, J. Descamps, B. Fabbro, J.L. Faure, F. Ferri, S. Ganjour, F.X. Gentit, A. Givernaud, P. Gras, G. Hamel de Monchenault, P. Jarry, M.C. Lemaire, E. Locci, J. Malcles, M. Marionneau, L. Millischer, J. Rander, A. Rosowsky, D. Rousseau, M. Titov, P. Verrecchia
Laboratoire Leprince-Ringuet, Ecole Polytechnique, IN2P3-CNRS, Palaiseau, France S. Baffioni, L. Bianchini, M. Bluj3, P. Busson, C. Charlot, L. Dobrzynski, R. Granier de Cassagnac, M. Haguenauer, P. Min´e, P. Paganini, Y. Sirois, C. Thiebaux, A. Zabi
Institut Pluridisciplinaire Hubert Curien, Universit´e de Strasbourg, Universit´e de Haute Alsace Mulhouse, CNRS/IN2P3, Strasbourg, France
J.-L. Agram4, A. Besson, D. Bloch, D. Bodin, J.-M. Brom, E. Conte4, F. Drouhin4, J.-C. Fontaine4, D. Gel´e, U. Goerlach, L. Gross, P. Juillot, A.-C. Le Bihan, Y. Patois, J. Speck, P. Van Hove Universit´e de Lyon, Universit´e Claude Bernard Lyon 1, CNRS-IN2P3, Institut de Physique Nucl´eaire de Lyon, Villeurbanne, France
C. Baty, M. Bedjidian, J. Blaha, G. Boudoul, H. Brun, N. Chanon, R. Chierici, D. Contardo, P. Depasse, T. Dupasquier, H. El Mamouni, F. Fassi5, J. Fay, S. Gascon, B. Ille, T. Kurca, T. Le Grand, M. Lethuillier, N. Lumb, L. Mirabito, S. Perries, M. Vander Donckt, P. Verdier
E. Andronikashvili Institute of Physics, Academy of Science, Tbilisi, Georgia N. Djaoshvili, N. Roinishvili, V. Roinishvili
Institute of High Energy Physics and Informatization, Tbilisi State University, Tbilisi, Georgia
N. Amaglobeli
RWTH Aachen University, I. Physikalisches Institut, Aachen, Germany
R. Adolphi, G. Anagnostou, R. Brauer, W. Braunschweig, M. Edelhoff, H. Esser, L. Feld, W. Karpinski, A. Khomich, K. Klein, N. Mohr, A. Ostaptchouk, D. Pandoulas, G. Pierschel, F. Raupach, S. Schael, A. Schultz von Dratzig, G. Schwering, D. Sprenger, M. Thomas, M. Weber, B. Wittmer, M. Wlochal
RWTH Aachen University, III. Physikalisches Institut A, Aachen, Germany
O. Actis, G. Altenh¨ofer, W. Bender, P. Biallass, M. Erdmann, G. Fetchenhauer1,
J. Frangenheim, T. Hebbeker, G. Hilgers, A. Hinzmann, K. Hoepfner, C. Hof, M. Kirsch, T. Klimkovich, P. Kreuzer1, D. Lanske†, M. Merschmeyer, A. Meyer, B. Philipps, H. Pieta, H. Reithler, S.A. Schmitz, L. Sonnenschein, M. Sowa, J. Steggemann, H. Szczesny, D. Teyssier, C. Zeidler
RWTH Aachen University, III. Physikalisches Institut B, Aachen, Germany
M. Bontenackels, M. Davids, M. Duda, G. Fl¨ugge, H. Geenen, M. Giffels, W. Haj Ahmad, T. Hermanns, D. Heydhausen, S. Kalinin, T. Kress, A. Linn, A. Nowack, L. Perchalla, M. Poettgens, O. Pooth, P. Sauerland, A. Stahl, D. Tornier, M.H. Zoeller
Deutsches Elektronen-Synchrotron, Hamburg, Germany
M. Aldaya Martin, U. Behrens, K. Borras, A. Campbell, E. Castro, D. Dammann, G. Eckerlin, A. Flossdorf, G. Flucke, A. Geiser, D. Hatton, J. Hauk, H. Jung, M. Kasemann, I. Katkov, C. Kleinwort, H. Kluge, A. Knutsson, E. Kuznetsova, W. Lange, W. Lohmann, R. Mankel1,
2010 JINST 5 T03012
M. Marienfeld, A.B. Meyer, S. Miglioranzi, J. Mnich, M. Ohlerich, J. Olzem, A. Parenti,C. Rosemann, R. Schmidt, T. Schoerner-Sadenius, D. Volyanskyy, C. Wissing, W.D. Zeuner1 University of Hamburg, Hamburg, Germany
C. Autermann, F. Bechtel, J. Draeger, D. Eckstein, U. Gebbert, K. Kaschube, G. Kaussen, R. Klanner, B. Mura, S. Naumann-Emme, F. Nowak, U. Pein, C. Sander, P. Schleper, T. Schum, H. Stadie, G. Steinbr¨uck, J. Thomsen, R. Wolf
Institut f ¨ur Experimentelle Kernphysik, Karlsruhe, Germany
J. Bauer, P. Bl¨um, V. Buege, A. Cakir, T. Chwalek, W. De Boer, A. Dierlamm, G. Dirkes, M. Feindt, U. Felzmann, M. Frey, A. Furgeri, J. Gruschke, C. Hackstein, F. Hartmann1, S. Heier, M. Heinrich, H. Held, D. Hirschbuehl, K.H. Hoffmann, S. Honc, C. Jung, T. Kuhr, T. Liamsuwan, D. Martschei, S. Mueller, Th. M¨uller, M.B. Neuland, M. Niegel, O. Oberst, A. Oehler, J. Ott, T. Peiffer, D. Piparo, G. Quast, K. Rabbertz, F. Ratnikov, N. Ratnikova, M. Renz, C. Saout1, G. Sartisohn, A. Scheurer, P. Schieferdecker, F.-P. Schilling, G. Schott, H.J. Simonis, F.M. Stober, P. Sturm, D. Troendle, A. Trunov, W. Wagner, J. Wagner-Kuhr, M. Zeise, V. Zhukov6, E.B. Ziebarth
Institute of Nuclear Physics “Demokritos”, Aghia Paraskevi, Greece
G. Daskalakis, T. Geralis, K. Karafasoulis, A. Kyriakis, D. Loukas, A. Markou, C. Markou, C. Mavrommatis, E. Petrakou, A. Zachariadou
University of Athens, Athens, Greece L. Gouskos, P. Katsas, A. Panagiotou1 University of Io´annina, Io´annina, Greece
I. Evangelou, P. Kokkas, N. Manthos, I. Papadopoulos, V. Patras, F.A. Triantis KFKI Research Institute for Particle and Nuclear Physics, Budapest, Hungary
G. Bencze1, L. Boldizsar, G. Debreczeni, C. Hajdu1, S. Hernath, P. Hidas, D. Horvath7, K. Krajczar, A. Laszlo, G. Patay, F. Sikler, N. Toth, G. Vesztergombi
Institute of Nuclear Research ATOMKI, Debrecen, Hungary
N. Beni, G. Christian, J. Imrek, J. Molnar, D. Novak, J. Palinkas, G. Szekely, Z. Szillasi1, K. Tokesi, V. Veszpremi
University of Debrecen, Debrecen, Hungary
A. Kapusi, G. Marian, P. Raics, Z. Szabo, Z.L. Trocsanyi, B. Ujvari, G. Zilizi Panjab University, Chandigarh, India
S. Bansal, H.S. Bawa, S.B. Beri, V. Bhatnagar, M. Jindal, M. Kaur, R. Kaur, J.M. Kohli, M.Z. Mehta, N. Nishu, L.K. Saini, A. Sharma, A. Singh, J.B. Singh, S.P. Singh
University of Delhi, Delhi, India
S. Ahuja, S. Arora, S. Bhattacharya8, S. Chauhan, B.C. Choudhary, P. Gupta, S. Jain, S. Jain, M. Jha, A. Kumar, K. Ranjan, R.K. Shivpuri, A.K. Srivastava
Bhabha Atomic Research Centre, Mumbai, India
R.K. Choudhury, D. Dutta, S. Kailas, S.K. Kataria, A.K. Mohanty, L.M. Pant, P. Shukla, A. Topkar Tata Institute of Fundamental Research - EHEP, Mumbai, India
T. Aziz, M. Guchait9, A. Gurtu, M. Maity10, D. Majumder, G. Majumder, K. Mazumdar, A. Nayak, A. Saha, K. Sudhakar
2010 JINST 5 T03012
Tata Institute of Fundamental Research - HECR, Mumbai, IndiaS. Banerjee, S. Dugad, N.K. Mondal
Institute for Studies in Theoretical Physics & Mathematics (IPM), Tehran, Iran
H. Arfaei, H. Bakhshiansohi, A. Fahim, A. Jafari, M. Mohammadi Najafabadi, A. Moshaii, S. Paktinat Mehdiabadi, S. Rouhani, B. Safarzadeh, M. Zeinali
University College Dublin, Dublin, Ireland M. Felcini
INFN Sezione di Baria, Universit`a di Barib, Politecnico di Baric, Bari, Italy
M. Abbresciaa,b, L. Barbonea, F. Chiumaruloa, A. Clementea, A. Colaleoa, D. Creanzaa,c, G. Cuscelaa, N. De Filippisa, M. De Palmaa,b, G. De Robertisa, G. Donvitoa, F. Fedelea, L. Fiorea, M. Francoa, G. Iasellia,c, N. Lacalamitaa, F. Loddoa, L. Lusitoa,b, G. Maggia,c, M. Maggia, N. Mannaa,b, B. Marangellia,b, S. Mya,c, S. Natalia,b, S. Nuzzoa,b, G. Papagnia, S. Piccolomoa, G.A. Pierroa, C. Pintoa, A. Pompilia,b, G. Pugliesea,c, R. Rajana, A. Ranieria, F. Romanoa,c, G. Rosellia,b, G. Selvaggia,b, Y. Shindea, L. Silvestrisa, S. Tupputia,b, G. Zitoa
INFN Sezione di Bolognaa, Universita di Bolognab, Bologna, Italy
G. Abbiendia, W. Bacchia,b, A.C. Benvenutia, M. Boldinia, D. Bonacorsia, S. Braibant-Giacomellia,b, V.D. Cafaroa, S.S. Caiazzaa, P. Capiluppia,b, A. Castroa,b, F.R. Cavalloa, G. Codispotia,b, M. Cuffiania,b, I. D’Antonea, G.M. Dallavallea,1, F. Fabbria, A. Fanfania,b, D. Fasanellaa, P. Giacomellia, V. Giordanoa, M. Giuntaa,1, C. Grandia, M. Guerzonia, S. Marcellinia, G. Masettia,b, A. Montanaria, F.L. Navarriaa,b, F. Odoricia, G. Pellegrinia, A. Perrottaa, A.M. Rossia,b, T. Rovellia,b, G. Sirolia,b, G. Torromeoa, R. Travaglinia,b
INFN Sezione di Cataniaa, Universita di Cataniab, Catania, Italy
S. Albergoa,b, S. Costaa,b, R. Potenzaa,b, A. Tricomia,b, C. Tuvea INFN Sezione di Firenzea, Universita di Firenzeb, Firenze, Italy
G. Barbaglia, G. Broccoloa,b, V. Ciullia,b, C. Civininia, R. D’Alessandroa,b, E. Focardia,b,
S. Frosalia,b, E. Galloa, C. Gentaa,b, G. Landia,b, P. Lenzia,b,1, M. Meschinia, S. Paolettia, G. Sguazzonia, A. Tropianoa
INFN Laboratori Nazionali di Frascati, Frascati, Italy
L. Benussi, M. Bertani, S. Bianco, S. Colafranceschi11, D. Colonna11, F. Fabbri, M. Giardoni, L. Passamonti, D. Piccolo, D. Pierluigi, B. Ponzio, A. Russo
INFN Sezione di Genova, Genova, Italy P. Fabbricatore, R. Musenich
INFN Sezione di Milano-Biccocaa, Universita di Milano-Bicoccab, Milano, Italy
A. Benagliaa, M. Callonia, G.B. Ceratia,b,1, P. D’Angeloa, F. De Guioa, F.M. Farinaa, A. Ghezzia, P. Govonia,b, M. Malbertia,b,1, S. Malvezzia, A. Martellia, D. Menascea, V. Miccioa,b, L. Moronia, P. Negria,b, M. Paganonia,b, D. Pedrinia, A. Pulliaa,b, S. Ragazzia,b, N. Redaellia, S. Salaa,
R. Salernoa,b, T. Tabarelli de Fatisa,b, V. Tancinia,b, S. Taronia,b
INFN Sezione di Napolia, Universita di Napoli ”Federico II”b, Napoli, Italy
S. Buontempoa, N. Cavalloa, A. Cimminoa,b,1, M. De Gruttolaa,b,1, F. Fabozzia,12, A.O.M. Iorioa, L. Listaa, D. Lomidzea, P. Nolia,b, P. Paoluccia, C. Sciaccaa,b
2010 JINST 5 T03012
INFN Sezione di Padovaa, Universit`a di Padovab, Padova, ItalyP. Azzia,1, N. Bacchettaa, L. Barcellana, P. Bellana,b,1, M. Bellatoa, M. Benettonia, M. Biasottoa,13, D. Biselloa,b, E. Borsatoa,b, A. Brancaa, R. Carlina,b, L. Castellania, P. Checchiaa, E. Contia,
F. Dal Corsoa, M. De Mattiaa,b, T. Dorigoa, U. Dossellia, F. Fanzagoa, F. Gasparinia,b, U. Gasparinia,b, P. Giubilatoa,b, F. Gonellaa, A. Greselea,14, M. Gulminia,13, A. Kaminskiya,b, S. Lacapraraa,13, I. Lazzizzeraa,14, M. Margonia,b, G. Marona,13, S. Mattiazzoa,b, M. Mazzucatoa,
M. Meneghellia, A.T. Meneguzzoa,b, M. Michelottoa, F. Montecassianoa, M. Nespoloa, M. Passaseoa, M. Pegoraroa, L. Perrozzia, N. Pozzobona,b, P. Ronchesea,b, F. Simonettoa,b, N. Tonioloa, E. Torassaa, M. Tosia,b, A. Triossia, S. Vaninia,b, S. Venturaa, P. Zottoa,b,
G. Zumerlea,b
INFN Sezione di Paviaa, Universita di Paviab, Pavia, Italy
P. Baessoa,b, U. Berzanoa, S. Bricolaa, M.M. Necchia,b, D. Paganoa,b, S.P. Rattia,b, C. Riccardia,b, P. Torrea,b, A. Vicinia, P. Vituloa,b, C. Viviania,b
INFN Sezione di Perugiaa, Universita di Perugiab, Perugia, Italy
D. Aisaa, S. Aisaa, E. Babuccia, M. Biasinia,b, G.M. Bileia, B. Caponeria,b, B. Checcuccia,
N. Dinua, L. Fan`oa, L. Farnesinia, P. Laricciaa,b, A. Lucaronia,b, G. Mantovania,b, A. Nappia,b, A. Pilusoa, V. Postolachea, A. Santocchiaa,b, L. Servolia, D. Tonoiua, A. Vedaeea, R. Volpea,b INFN Sezione di Pisaa, Universita di Pisab, Scuola Normale Superiore di Pisac, Pisa, Italy P. Azzurria,c, G. Bagliesia, J. Bernardinia,b, L. Berrettaa, T. Boccalia, A. Boccia,c, L. Borrelloa,c, F. Bosia, F. Calzolaria, R. Castaldia, R. Dell’Orsoa, F. Fioria,b, L. Fo`aa,c, S. Gennaia,c, A. Giassia, A. Kraana, F. Ligabuea,c, T. Lomtadzea, F. Mariania, L. Martinia, M. Massaa, A. Messineoa,b, A. Moggia, F. Pallaa, F. Palmonaria, G. Petragnania, G. Petrucciania,c, F. Raffaellia, S. Sarkara, G. Segneria, A.T. Serbana, P. Spagnoloa,1, R. Tenchinia,1, S. Tolainia, G. Tonellia,b,1, A. Venturia, P.G. Verdinia
INFN Sezione di Romaa, Universita di Roma “La Sapienza”b, Roma, Italy
S. Baccaroa,15, L. Baronea,b, A. Bartolonia, F. Cavallaria,1, I. Dafineia, D. Del Rea,b, E. Di Marcoa,b, M. Diemoza, D. Francia,b, E. Longoa,b, G. Organtinia,b, A. Palmaa,b, F. Pandolfia,b,
R. Paramattia,1, F. Pellegrinoa, S. Rahatloua,b, C. Rovellia
INFN Sezione di Torino a, Universit`a di Torino b, Universit`a del Piemonte Orientale
(No-vara)c, Torino, Italy
G. Alampia, N. Amapanea,b, R. Arcidiaconoa,b, S. Argiroa,b, M. Arneodoa,c, C. Biinoa, M.A. Borgiaa,b, C. Bottaa,b, N. Cartigliaa, R. Castelloa,b, G. Cerminaraa,b, M. Costaa,b, D. Dattolaa, G. Dellacasaa, N. Demariaa, G. Dugheraa, F. Dumitrachea, A. Grazianoa,b, C. Mariottia, M. Maronea,b, S. Masellia, E. Migliorea,b, G. Milaa,b, V. Monacoa,b, M. Musicha,b, M. Nervoa,b, M.M. Obertinoa,c, S. Oggeroa,b, R. Paneroa, N. Pastronea, M. Pelliccionia,b, A. Romeroa,b, M. Ruspaa,c, R. Sacchia,b, A. Solanoa,b, A. Staianoa, P.P. Trapania,b,1, D. Trocinoa,b, A. Vilela Pereiraa,b, L. Viscaa,b, A. Zampieria
INFN Sezione di Triestea, Universita di Triesteb, Trieste, Italy
F. Ambroglinia,b, S. Belfortea, F. Cossuttia, G. Della Riccaa,b, B. Gobboa, A. Penzoa
Kyungpook National University, Daegu, Korea
2010 JINST 5 T03012
Wonkwang University, Iksan, KoreaS.Y. Bahk
Chonnam National University, Kwangju, Korea S. Song
Konkuk University, Seoul, Korea S.Y. Jung
Korea University, Seoul, Korea
B. Hong, H. Kim, J.H. Kim, K.S. Lee, D.H. Moon, S.K. Park, H.B. Rhee, K.S. Sim Seoul National University, Seoul, Korea
J. Kim
University of Seoul, Seoul, Korea M. Choi, G. Hahn, I.C. Park
Sungkyunkwan University, Suwon, Korea
S. Choi, Y. Choi, J. Goh, H. Jeong, T.J. Kim, J. Lee, S. Lee Vilnius University, Vilnius, Lithuania
M. Janulis, D. Martisiute, P. Petrov, T. Sabonis
Centro de Investigacion y de Estudios Avanzados del IPN, Mexico City, Mexico H. Castilla Valdez1, A. S´anchez Hern´andez
Universidad Iberoamericana, Mexico City, Mexico S. Carrillo Moreno
Universidad Aut´onoma de San Luis Potos´ı, San Luis Potos´ı, Mexico A. Morelos Pineda
University of Auckland, Auckland, New Zealand P. Allfrey, R.N.C. Gray, D. Krofcheck
University of Canterbury, Christchurch, New Zealand N. Bernardino Rodrigues, P.H. Butler, T. Signal, J.C. Williams
National Centre for Physics, Quaid-I-Azam University, Islamabad, Pakistan
M. Ahmad, I. Ahmed, W. Ahmed, M.I. Asghar, M.I.M. Awan, H.R. Hoorani, I. Hussain, W.A. Khan, T. Khurshid, S. Muhammad, S. Qazi, H. Shahzad
Institute of Experimental Physics, Warsaw, Poland
M. Cwiok, R. Dabrowski, W. Dominik, K. Doroba, M. Konecki, J. Krolikowski, K. Pozniak16, R. Romaniuk, W. Zabolotny16, P. Zych
Soltan Institute for Nuclear Studies, Warsaw, Poland
T. Frueboes, R. Gokieli, L. Goscilo, M. G´orski, M. Kazana, K. Nawrocki, M. Szleper, G. Wrochna, P. Zalewski
Laborat´orio de Instrumentac¸˜ao e F´ısica Experimental de Part´ıculas, Lisboa, Portugal N. Almeida, L. Antunes Pedro, P. Bargassa, A. David, P. Faccioli, P.G. Ferreira Parracho, M. Freitas Ferreira, M. Gallinaro, M. Guerra Jordao, P. Martins, G. Mini, P. Musella, J. Pela, L. Raposo, P.Q. Ribeiro, S. Sampaio, J. Seixas, J. Silva, P. Silva, D. Soares, M. Sousa, J. Varela, H.K. W¨ohri
2010 JINST 5 T03012
Joint Institute for Nuclear Research, Dubna, RussiaI. Altsybeev, I. Belotelov, P. Bunin, Y. Ershov, I. Filozova, M. Finger, M. Finger Jr., A. Golunov, I. Golutvin, N. Gorbounov, V. Kalagin, A. Kamenev, V. Karjavin, V. Konoplyanikov, V. Korenkov, G. Kozlov, A. Kurenkov, A. Lanev, A. Makankin, V.V. Mitsyn, P. Moisenz, E. Nikonov, D. Oleynik, V. Palichik, V. Perelygin, A. Petrosyan, R. Semenov, S. Shmatov, V. Smirnov, D. Smolin, E. Tikhonenko, S. Vasil’ev, A. Vishnevskiy, A. Volodko, A. Zarubin, V. Zhiltsov
Petersburg Nuclear Physics Institute, Gatchina (St Petersburg), Russia
N. Bondar, L. Chtchipounov, A. Denisov, Y. Gavrikov, G. Gavrilov, V. Golovtsov, Y. Ivanov, V. Kim, V. Kozlov, P. Levchenko, G. Obrant, E. Orishchin, A. Petrunin, Y. Shcheglov, A. Shchetkovskiy, V. Sknar, I. Smirnov, V. Sulimov, V. Tarakanov, L. Uvarov, S. Vavilov, G. Velichko, S. Volkov, A. Vorobyev
Institute for Nuclear Research, Moscow, Russia
Yu. Andreev, A. Anisimov, P. Antipov, A. Dermenev, S. Gninenko, N. Golubev, M. Kirsanov, N. Krasnikov, V. Matveev, A. Pashenkov, V.E. Postoev, A. Solovey, A. Solovey, A. Toropin, S. Troitsky
Institute for Theoretical and Experimental Physics, Moscow, Russia
A. Baud, V. Epshteyn, V. Gavrilov, N. Ilina, V. Kaftanov†, V. Kolosov, M. Kossov1, A. Krokhotin,
S. Kuleshov, A. Oulianov, G. Safronov, S. Semenov, I. Shreyber, V. Stolin, E. Vlasov, A. Zhokin Moscow State University, Moscow, Russia
E. Boos, M. Dubinin17, L. Dudko, A. Ershov, A. Gribushin, V. Klyukhin, O. Kodolova, I. Lokhtin, S. Petrushanko, L. Sarycheva, V. Savrin, A. Snigirev, I. Vardanyan
P.N. Lebedev Physical Institute, Moscow, Russia
I. Dremin, M. Kirakosyan, N. Konovalova, S.V. Rusakov, A. Vinogradov
State Research Center of Russian Federation, Institute for High Energy Physics, Protvino, Russia
S. Akimenko, A. Artamonov, I. Azhgirey, S. Bitioukov, V. Burtovoy, V. Grishin1, V. Kachanov, D. Konstantinov, V. Krychkine, A. Levine, I. Lobov, V. Lukanin, Y. Mel’nik, V. Petrov, R. Ryutin, S. Slabospitsky, A. Sobol, A. Sytine, L. Tourtchanovitch, S. Troshin, N. Tyurin, A. Uzunian, A. Volkov
Vinca Institute of Nuclear Sciences, Belgrade, Serbia
P. Adzic, M. Djordjevic, D. Jovanovic18, D. Krpic18, D. Maletic, J. Puzovic18, N. Smiljkovic Centro de Investigaciones Energ´eticas Medioambientales y Tecnol´ogicas (CIEMAT), Madrid, Spain
M. Aguilar-Benitez, J. Alberdi, J. Alcaraz Maestre, P. Arce, J.M. Barcala, C. Battilana, C. Burgos Lazaro, J. Caballero Bejar, E. Calvo, M. Cardenas Montes, M. Cepeda, M. Cerrada, M. Chamizo Llatas, F. Clemente, N. Colino, M. Daniel, B. De La Cruz, A. Delgado Peris, C. Diez Pardos, C. Fernandez Bedoya, J.P. Fern´andez Ramos, A. Ferrando, J. Flix, M.C. Fouz, P. Garcia-Abia, A.C. Garcia-Bonilla, O. Gonzalez Lopez, S. Goy Lopez, J.M. Hernandez, M.I. Josa, J. Marin, G. Merino, J. Molina, A. Molinero, J.J. Navarrete, J.C. Oller, J. Puerta Pelayo, L. Romero, J. Santaolalla, C. Villanueva Munoz, C. Willmott, C. Yuste