Mesenchymal stromal cells (MSCs) induce ex
vivo proliferation and erythroid commitment
of cord blood haematopoietic stem cells
(CB-CD34+ cells)
Simone Perucca1,2, Andrea Di Palma1,2, Pier Paolo Piccaluga3,4, Claudia Gemelli5,
Elisa Zoratti6, Giulio Bassi7, Edoardo Giacopuzzi8, Andrea Lojacono9, Giuseppe Borsani8, Enrico Tagliafico10, Maria Teresa Scupoli11, Simona Bernardi1,2, Camilla Zanaglio1,2, Federica Cattina1, Valeria Cancelli1, Michele Malagola1, Mauro Krampera7,
Mirella Marini12, Camillo Almici12, Sergio Ferrari13, Domenico Russo1*
1 Unit of Blood Diseases and Stem Cells Transplantation, Department of Clinical and Experimental Sciences,
University of Brescia, ASST Spedali Civili di Brescia, Brescia, Italy, 2 Laboratorio CREA (Centro di Ricerca Emato-oncologica AIL), ASST Spedali Civili of Brescia, Brescia, Italy, 3 Department of Experimental, Diagnostic, and Specialty Medicine (DIMES), S. Orsola-Malpighi Hospital, Bologna University School of Medicine, Bologna, Italy, 4 Section of Genomics and Personalized Medicine, Euro-Mediterranean Institute of Science and Technology (IEMEST), Palermo, Italy, 5 Parco Scientifico e Tecnologico Materiali Innovativi e Ricerca Applicata del Mirandolese, Modena, Italy, 6 Applied Research on Cancer-Network (ARC-NET), University of Verona, Verona, Italy, 7 Stem Cell Research Laboratory, Section of Hematology, Department of Medicine, University of Verona, Verona, Italy, 8 Unit of Biology and Genetics, Department of Molecular and Translational Medicine (DMTM), University of Brescia, Brescia, Italy, 9 U.O. of Obstetrics and Gynecology I, ASST Spedali Civili di Brescia, Brescia, Italy, 10 Centro di Ricerche Genomiche, Dipartimento di Scienze della Vita, Universitàdegli Studi di Modena e Reggio Emilia, Modena, Italy, 11 Interdepartmental Laboratory of Medical Research (LURM), University of Verona, Verona, Italy, 12 Department of Transfusion Medicine, Laboratory for Stem Cells Manipulation and Cryopreservation, ASST Spedali Civili di Brescia, Brescia, Italy,
13 Department of Life Sciences, University of Modena and Reggio Emilia, Modena, Italy
Abstract
A human bone marrow-derived mesenchymal stromal cell (MSCs) and cord blood-derived CD34+ stem cell co-culture system was set up in order to evaluate the proliferative and dif-ferentiative effects induced by MSCs on CD34+ stem cells, and the reciprocal influences on gene expression profiles. After 10 days of co-culture, non-adherent (SN-fraction) and adher-ent (AD-fraction) CD34+ stem cells were collected and analysed separately. In the presence of MSCs, a significant increase in CD34+ cell number was observed (fold increase = 14.68), mostly in the SN-fraction (fold increase = 13.20). This was combined with a significant increase in CD34+ cell differentiation towards the BFU-E colonies and with a decrease in the CFU-GM. These observations were confirmed by microarray analysis. Through gene set enrichment analysis (GSEA), we noted a significant enrichment in genes involved in heme metabolism (e.g. LAMP2, CLCN3, BMP2K), mitotic spindle formation and proliferation (e.g. PALLD, SOS1, CCNA1) and TGF-beta signalling (e.g. ID1) and a down-modulation of genes participating in myeloid and lymphoid differentiation (e.g. PCGF2) in the co-cultured CD34+ stem cells. On the other hand, a significant enrichment in genes involved in oxygen-level response (e.g. TNFAIP3, SLC2A3, KLF6) and angiogenesis (e.g. VEGFA, IGF1, ID1)
a1111111111 a1111111111 a1111111111 a1111111111 a1111111111 OPEN ACCESS
Citation: Perucca S, Di Palma A, Piccaluga PP,
Gemelli C, Zoratti E, Bassi G, et al. (2017) Mesenchymal stromal cells (MSCs) induce ex vivo proliferation and erythroid commitment of cord blood haematopoietic stem cells (CB-CD34+ cells). PLoS ONE 12(2): e0172430. doi:10.1371/journal. pone.0172430
Editor: Irina Kerkis, Instituto Butantan, BRAZIL Received: October 27, 2016
Accepted: February 3, 2017 Published: February 23, 2017
Copyright:© 2017 Perucca et al. This is an open access article distributed under the terms of the Creative Commons Attribution License, which permits unrestricted use, distribution, and reproduction in any medium, provided the original author and source are credited.
Data Availability Statement: The complete dataset
has been submitted to the gene expression omnibus data (GEO) public database at NCBI, and the accession number is GSE90970.
Funding: This study was supported by PRIN_2009,
BCC “Pompiano e Franciacorta”, LIONS Bassa Bresciana. The funders had no role in study design, data collection and analysis, decision to publish, or preparation of the manuscript.
Competing interests: The authors have declared
was found in the co-cultured MSCs. Taken together, our results suggest that MSCs can exert a priming effect on CD34+ stem cells, regulating their proliferation and erythroid differ-entiation. In turn, CD34+ stem cells seem to be able to polarise the BM-niche towards the vascular compartment by modulating molecular pathways related to hypoxia and
angiogenesis.
Introduction
Haematopoiesis is a continuous blood cell production process occurring in the bone marrow niche (BM-niche) through the orchestrated proliferation, self-renewal and differentiation of haematopoietic stem cells (HSCs) [1,2].
The mesenchymal stem/stromal cells (MSCs) play an essential role in the quiescence, prolif-eration and differentiation of HSCs [3–5]. They are spatially associated with HSCs, adrenergic nerve fibres and arteriolar vasculature and constitute a structurally unique niche made of MSC-HSC pairings, tightly regulated by local input and long-distance cues [6–10].
The CXCL12(SDF-1)/CXCR4 axis is one of the most important biological mechanisms involved in the reciprocal interaction between MSCs and HSCs [11,12]. Experimental data indicate thatin vivo nestin+ MSC depletion significantly reduces bone marrow homing and haematopoietic progenitor content [13]. In a xenogenic transplantation model, MSCs favour the haematopoietic engraftment by an increased expression of SDF-1 and osteopontin and, when injected locally, they co-localised around blood vessels in the subendosteal region of mice femurs, restoring BM-niche function even when the stroma is damaged [14].
The activation of specific signalling pathways, such as those dependent on Notch, Wnt/β-catenin molecules [15] or on the adhesion molecules, (fibronectin-1, cadherin-11, vascular cell adhesion molecule-1 (VCAM-1), CX43) and integrins [16] have been recognized to be involved in the interaction between human HSCs and MSCs. The interaction of VCAM-1 with integrin alpha4beta1 through which MSCs modulate the fate of HSCs [17]. Less known is the role of alternative genes and signalling pathways that contribute to regulate stemness, cell pro-liferation and cell differentiation.
These data strongly suggest that haematological recovery post-ablative chemotherapy or after HSC transplantation depends on and could be improved by the co-operation between MSCs and HSCs. In mice model, Me´ndez-Ferrer et al. observed that physical association between nestin+MSCs and HSCs is essential to inducing the expression of HSC maintenance genes and to balance HSC quiescence, proliferation and differentiation [13].
In humans, perhaps the best transplant model suggesting the potential role of MSCs in favouring HSC proliferation and differentiation is allogeneic transplantation based on intra-bone injection of cord blood haematopoietic stem cells (CB-CD34+ cells) (IB-HSCT) [18,19]. In this case, positive effects in the haematopoietic recovery observed in the transplanted patients have been attributed to a local and direct interaction of the injected HSCs with other cell components into the BM-niche, including, in particular, with MSCs.
The expectation that an intra-bone co-infusion of MSCs could promote the ability of BM-niche in supporting the post-transplant haematopoiesis by contributing to the repair or replacement of the stromal damage is intriguing but it is not explored. Furthermore, assuming a possiblein vivo use of MSC and HSC co-infusion, biological aspects regarding the effects of the HSCs on MSCs have not been investigated at all. Since experimental data and comprehen-sive indications suggesting that HSCs priming with MSCs could improve the clinical outcome
in the setting of allogeneic HSCs transplantation are still lacking, we investigated how bone marrow-derived MSCs can affect the molecular and functional phenotype of CB-CD34+ cells and vice versa. To this end, we set up an ex-vivo human MSC-HSC co-culture system in order to evaluate the early proliferative and differentiative effects induced by MSCs on HSCs, and the reciprocal influences on their gene expression profiles.
Materials and methods
Ethics statement
Ethics approval to conduct this study was granted by Comitato Etico Provinciale della Provin-cia di BresProvin-cia—ASST Spedali Civili di BresProvin-cia (Approval number: NP1871).
Experimental design
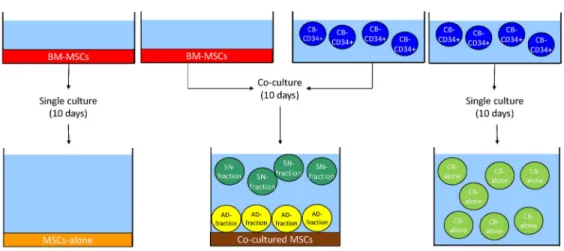
BM-derived MSCs (BM-MSCs, red) were seeded on a plastic support. Upon reaching 80% of confluence, previously isolated CD34+ CB-derived HSCs (CB-CD34+ cells, blue) were plated onto a MSCs layer. After 10 days of culture, cells grown in suspension were collected in plastic tubes, while adherent cells were harvested by trypsinization. Two different fractions of HSCs were obtained: the SN-fraction (green), representing the cells grown in the supernatant of the co-cultures, and the AD-fraction (yellow), representing the cells grown directly in contact with the stromal layer, represented by co-cultered MSCs (brown). Single cultures of BM-MSCs and CB-CD34+ cells served as controls, namely MSCs-alone (orange) and CB-alone (light green) (Fig 1).
CB-CD34+ cell purification
Fresh cord blood (CB) samples were collected after normal vaginal delivery in women without infectious diseases or maternal complications, after informed written consent. Mononuclear cells (MNC) were isolated from 30 ml of CB after density gradient centrifugation using lym-phocytes separation media (Histopaque1, Sigma-Aldrich) stratification (2000 rpm, 20 min). After washing with Phosphate-Buffered Saline (PBS) (Gibco), MNC were incubated with immunomagnetic beads (CD34+) (Miltenyi) following manufacturer’s instruction. After CD34+ cell recovery, cell purity was assessed by flow cytometry (FACS Canto II1, BD) using a panel of CD34-PE and CD45-FITC (BD) fluorochrome-conjugated monoclonal antibodies. TruCount1Absolute-Count Tubes (BD) were used for determining the number of CD34 + cells. The strategy of gating is reported in theS1andS2Figs. CB samples were processed within 8 hours from collection; cells with at least 90% of purity were used for co-culture experiments.
Isolation and characterization of BM-MSCs
Third party-MSCs were obtained from bag washouts after scheduled BM harvests according to standards of National Marrow Donor Program and after informed written consent. The Donor of BM-MSCs was a healthy 20 years old male. Total nucleated cells from filter and bag residues were obtained after two washings with 100–150mL PBS and centrifugation at 200 g for 10 min. The pellet material was gently resuspended in 20–30mL PBS and separated over Histopaque1gradients centrifugation to yield MNC. One million MNC were seeded in a T75 flask (Sarstedt) and cultured in complete ISCOVE’s modified Dulbecco’s medium (Gibco) supplemented with 10% Fetal Bovine Serum (FBS) (Gibco). Medium was changed weekly, dis-carding non-adherent cells. After 3 weeks, adherent cells were trypsinized and purity was assessed by flow cytometry using a panel of the following antibodies: CD45-FITC, CD90-APC,
CD73-PE, CD105-PerCP-Cy5.5 and 7AAD-PerCP (BD). MSCs were also characterized for their differential potential. According to the manufacture’s instruction, cells were cultured in proper media for adipogenic (Mesencult™ Adipogenic Differentiation Medium, StemCell Technologies), chondrogenic (StemXVivo™ Chondrogenic Differentiation Media, R&D Sys-tems) and osteogenic (Mesencult™ Osteogenic Stimulatory Kit, StemCell Technologies) differ-entation, followed by staining with Oil-Red-O (Sigma Aldrich), Safranin O (Sigma Aldrich) and Alizarin Red S (Sigma Aldrich), respectively. Briefly, 5x10⁴cells were plated in culture dishes with weekly changing of the specific differentiating media. At the end of the differentia-tion period, all cultures were fixed with 4% formaldehyde for 30 min and adipocytes were stained with 0,3% Oil Red O solution for 10min; bone cells with 2% Alizarin Red S solution (pH 4.2) for 3 min, while chondrogenic pellets were stained with 0.1% Safranin O solution for 5 minutes (S3 Fig). Once characterized, MSCs (CD45-, CD90+, CD73+, CD105+ cells > 95%) were expanded and stored in liquid nitrogen at the final concentration of 0.5x10⁶cells/vial. In this study, MSCs were used until third passage.
CB-CD34+ cells and BM-MSCs co-cultures
BM-MSCs were thawed at 37˚C and 1.5x10⁶cells were plated in three T75 flasks at equal con-centrations (0.5x10⁶cells/flask). Cells were cultured in complete ISCOVE’s modified Dulbec-co’s medium supplemented with 10% FBS for a week until 80% confluence.
CB-CD34+ cells were seeded directly onto the MSCs layer at a final concentration of 0.3x10⁶cells/flask. Cells were maintained in serum-free medium (StemSpan H3000, StemCell Technologies) supplemented with 100 ng/ml Stem Cell Factor (SCF) (Peprotech), Thrombo-poietin (TPO) (Peprotech) and Granulocyte Colony Stimulating Factor (G-CSF) (Italfarmaco) for 10 days at 37˚C and 5% CO2.
A single co-culture experiment consisted of:
• 2 T75 of 0.3x10⁶CB-CD34+ cells seeded onto MSCs at 80% confluence (CB-CD34+ cells and MSCs co-culture)
Fig 1. Experimental design of the study. SeeMaterial and methodsection for a complete description of the figure. Ten days of culture were chosen for 2 reasons: first of all, the majority of research articles dealing with MSCs and HSCs range from 7 to 14 days of co-culturing. Secondly, 10 days of co-culturing allow to see a biological effect of MSCs on HSCs without inducing cellular senescence in stromal cells. Indeed, co-cultures were maintained in serum-free medium supplemented with Stem Cell Factor (SCF), Thrombopoietin (TPO) and Granulocyte Colony Stimulating Factor (G-CSF) (see below for details). When MSCs are cultured in this medium for more than 14 days they undergo changes in cell morphology and they begin losing their phenotypic characteristics (data not shown).
• 1 T75 of 0.3x10⁶CB-CD34+ cells (CB-CD34+ alone) • 1 T75 of MSCs at 80% of confluence (MSCs alone)
As regards microarray experiments and clonogenic assay, three independent experiments were performed, whereas for the evaluation of CB-CD34+ cell expansion, 5 independent repli-cates were performed. In all the experiments, cord blood samples were never pooled
Purification and cell-sorting of BM-MSCs and CB-CD34+ cells
After 10 days of culture, cells grown in suspension were collected in plastic tubes, while adher-ent cells were harvested by trypsinization. Four differadher-ent cell fractions were obtained: the single culture of CB-CD34+ cells grown in suspension (CB-alone), the single culture of MSCs grown adherent to the flask (MSCs-alone), the CB-CD34+ cells in the co-culture supernatant (SN-fraction) and the adherent fraction (AD-(SN-fraction) of the co-cultures, i.e. adherent MSCs and CB-CD34+ cells grown directly in contact of the stromal layer. Samples were centrifuged 10’ at 1300 rpm, pellets were resuspended in PBS and stained for 30’ on ice with the following fluoro-chrome-conjugated monoclonal antibodies: CD45-FITC (BD Biosciences), CD73-PE (BD Bio-sciences), CD90-PE (BD BioBio-sciences), CD105-PE (ImmunoStep), CD34-APC (BD
Biosciences), in presence of DAPI (Sigma-Aldrich). Cells were then washed, passed through a 45 um cell strainer (BD Biosciences) and resuspended in PBS. Stained cells were analyzed and sorted by a FACSAria II flow cytometer (Becton Dickinson). Flow cytometric data were ana-lyzed using FACSDiva software (Becton Dickinson). Dead cells and debris were excluded by forward scatter (FSC), side scatter (SSC), and DAPI viability dye. MSCs were identified on the basis of CD73, CD90, CD105 co-expression and lack of CD45. CB-CD34+ cells were identified on the basis of CD45 and CD34 co-expression. At least 0.3x10⁶gated events were acquired for each sample. Purity of FACS-isolated cells was greater than 95%, as assessed by flow cytometric analysis of post-sorting samples.
Proliferation and clonogenic assays of CB-CD34+ cells
The proliferation of CB-CD34+ cells was reported as a fold-increase ratio by comparing the number of CB in the Total SN+AD (CD34+ cells grown in presence of MSCs) with the number of CD34+ cells of CB-alone, thus obtaining a readout of the effect of MSCs on the proliferative capacity of the CB-CD34+ cells. Similarly, we reported the fold-increase ratio of CB-CD34 + cells grown in the SN-fraction and in the AD-fraction independently analyzed. We per-formed 5 independent experiments to achieve statistical significance. The number of human Colony Forming Units (CFUs) of CB-CD34+ cells was analyzed by seeding 1x10³CD34+ cells of CB-, SN- and AD- fractions, respectively, in a 35 mm dish (Sarstedt). Seeded cells were cul-tured in MethoCult™ H4535 methylcellulose media (StemCell Technologies) at 37˚C, in humidified atmosphere and 5% CO2. After 14 days, the number of erythroid burst-forming
unit (BFU-E), granulocyte-macrophage colony forming unit (CFU-GM) and granulocyte/ erythrocyte/macrophage/megakaryocyte colony forming unit (CFU-GEMM) was determined with manual count at optical microscope. Values came from three replicates.
RNA extraction and microarray analysis
Total cellular RNA was isolated using Qiagen total RNA purification kits as recommended by the manufacturer (Qiagen). RNA integrity, purity and concentration were then verified by the Bio-Analyzer technique (Applied Biosystem) and NanoDrop 2000 spectrophotometer (Life Technologies). Three independent experiments for each culture condition were performed. An amount of 50 ng of RNA was converted in labelled aRNA using the GeneChip 3’ IVT
Expression kit (Affymetrix) and then used to hybridized the Affymetrix HG-U133A PLUS 2.0 GeneChip arrays that were subsequently washed and stained using the GeneChip Hybridiza-tion, Wash and Stain Kit (Affymetrix). Genechips were then analyzed with the Affymetrix Scanner 3000 and the images obtained were processed by Microarray Analysis Suite 5.0 (MAS 5.0) algorithm. Hybridization quality, absolute call (absent or present) and mRNA quantifica-tion were also evaluated.
The complete dataset has been submitted to the gene expression omnibus data (GEO) pub-lic database at NCBI, and the accession number is GSE90970.
Gene validation by quantitative RT-PCR
Quantitative RT-PCR (qRT-PCR) was carried out by a Light Cycler 480 sequence detection system (Roche Diagnostics) on total RNAs (100 ng) reversely transcribed using the High Capacity cDNA Archive Kit (Applied Biosystems), according to the manufacturer’s instruc-tions. Each cDNA sample was run in duplicate for either each target (VEGFA and CCNA1) or GAPDH endogenous control. TaqMan gene assays, supplied as ready solutions, and TaqMan Universal PCR Master Mix were provided by Applied Biosystems. Quantification of qRT-PCR signals was performed using the (2-Delta DeltaCt) method [20], which calculates relative changes in gene expression of the target gene normalized to theGAPDH endogenous control and rela-tive to a calibrator sample. The values obtained were represented as relarela-tive quantity of mRNA level variations.
Bioinformatic analysis
Number of CB-CD34+ cells and clonogenicity assays were presented as mean± standard devi-ations (SDs) and analyzed using Student’s t-test. Differences between the samples were consid-ered statistically significant for p <0.05.
Microarrays data were processed by using Partek1Genomics Suite1software to identify genes differentially expressed in MSCs and CB-CD34+ cells following co-culture. The lists of genes were obtained by applying multiple comparison tests (Bonferroni’s correction and False Discovery Rate) after ANOVA analysis, and only genes with a fold change <-2 or> +2 were selected.
The analysis of molecular pathways was carried out as previously reported [21–24]. Briefly, EASE software was applied to establish whether specific cell functions and biological processes, defined according to gene ontology, were significantly represented among the deregulated genes through the DAVID Functional Annotation Bioinformatics Microarray Analysis [25,26]. Broad Institute Gene Set Enrichment Analysis (GSEA) software was performed to identify significant enrichments in differentially expressed genes signatures, in case of nominal P values corrected for False Discovery Rate (FDR) for enrichment scores minor than 0.05. Spe-cifically, GeneOntology Biological Processes, Oncogenic pathways, immune pathways, and curated gene sets were considered [27]. The network analyses were generated through the use of Ingenuity Pathway Analysis1(IPA1, Qiagen).
Results
Co-cultures of CB-CD34+ cells and MSCs
Co-culturing experiments were performed to evaluate the MSCs’ effects on the proliferation and differentiation of CB-CD34+ cells. After 10 days, when cultured alone (CB-alone), 0.5x10⁶ CB-CD34+ cells were obtained. The ratio of CD34+ cells grown in single culture (CB-alone) was compared to the total number of CD34+ cells after co-culture with MSCs (Total SN+AD).
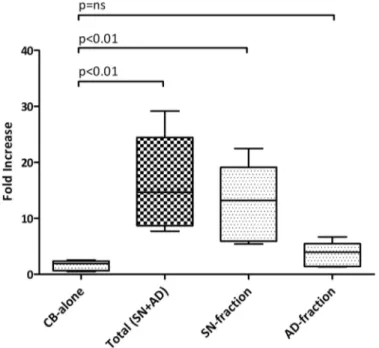
A fold-increase of 14.68 (median of 5 replicates, p = 0.019) was found. Notably, a 13.20-fold increase in the number of CD34+ cells was observed with the sorted SN-fraction (median of 5 replicates, p = 0.025), while no statistically significant difference was found with the sorted AD-fraction. Data are summarised inFig 2and inS1 Table.
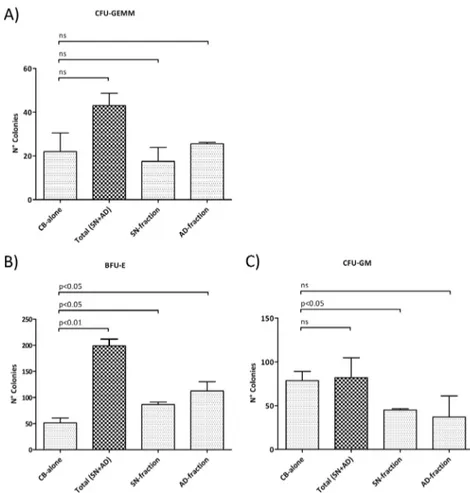
The colony-forming unit ability of CB-CD34+ cells was investigated by performing a genic assay in methylcellulose-based cultures. A statistically significant difference in clono-genic capacity was found by comparing CB-alone-derived colonies with the co-culture-derived colonies (Total SN+AD, SN-fraction or AD fraction alone). In particular, the methyl-cellulose-based assay showed no statistically significant differences in CFU-GEMM number, while a significant increase in the BFU-E colonies was observed in co-culture-derived fractions (Total SN+AD p<0.01, SN-fraction p<0.05 or AD-fraction p<0.05), and this was combined with a decrease in the CFU-GM, in the SN-fraction only (p<0.05). Data are shown inFig 3.
Gene expression profiling of CB-CD34+ cells after co-culture with MSCs
CB-CD34+ cells, either cultured alone or with MSCs (Total SN+AD, SN-fraction or AD-frac-tion alone), were analysed for their gene expression profile by using GeneChip arrays
HG-U133A 2.0 PLUS (Affymetrix). First, gene expression profiles of SN-fraction vs. AD-frac-tion were analysed to assess possible differences in their transcriptomes. Since no statistically significant differences were found between SN- and AD- fractions (data not shown), CB-alone and Total SN+AD (SN- and AD- fractions together) were compared.
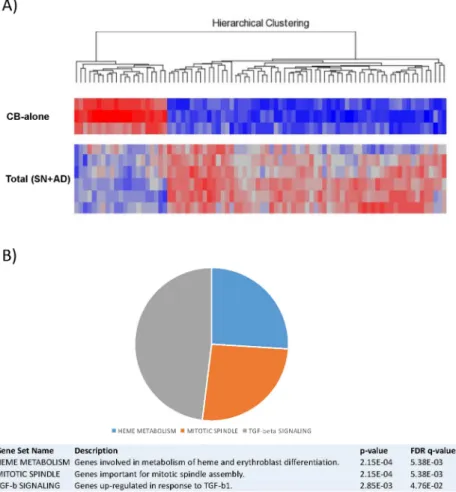
Seventy-one out of 47,000 genes spotted on the array were expressed differentially, with a corrected p<0.05 coupled with a fold change < -2 or > +2. Based on the expression of such 71 genes, CB-alone and culture-derived cells (AD+SN) appeared clearly distinct (Fig 4A).
Fig 2. Ex vivo expansion of CB-CD34+ cells with MSCs. 5×10⁵CB-CD34+ cells were cultured alone or in presence of a layer of MSCs for 10 days; the fold increase in total cell number was calculated from the original CD34+ cells seeded at day 0. The absolute number of CB-CD34+ cells was measured by flow cytometry. Values came from 5 independent replicates. Abbreviation: CB-alone: number of CB-CD34+ cells after 10 days of single culture; SN-fraction: CB-CD34+ cells in the supernatant (SN-fraction) of the co-cultures with MSCs; AD-fraction: CB-CD34+ cells grown directly in contact with MSCs layer; Total SN+AD: total number of CB-CD34+ cells after co-culture with MSCs.
To understand better the possible biological role of the transcriptional differences induced by culture, we investigated whether the identified gene signature was enriched with genes involved in specific cellular programs and functions. Through gene set enrichment analysis (GSEA), we found a significant enrichment in genes involved in heme metabolism, mitotic spindle formation and proliferation, and TGF-beta signalling (Fig 4B,S2 Table). In addition, IPA-based pathway analysis revealed the significant involvement of genes regulating cell-to-cell signalling, haematological system development and function, cell-to-cell cycle, growth and prolif-eration (S3 Table). In particular, certain genes (e.g. ID1 and PCGF2) appeared to be key regula-tors of several processes affecting haematopoiesis (S4–S6Figs). To confirm the microarray data, qRT-PCR was carried out onCCNA1 that resulted differentially expressed between CB-alone versus SN-fraction and AD-fraction. Data related to the relative quantity of mRNA level variations are recorded inFig 5.
Gene expression profiles analysis of MSCs after co-culturing with
CB-CD34+ cells
Co-culture effects on MSC transcriptome were then studied. To this aim, microarray analysis was carried out on either MSCs-alone or MSCs maintained for 10 days in co-culture with
Fig 3. Clonogenic assays of CB-CD34+ cells. Results of statistical analysis of methylcellulose-based
clonogenic assay performed on CB-CD34+ cells plated after 14 days of co-culture with human MSCs. (A) CFU-GEMM count; (B) BFU-E count; (C) CFU-GM count. Values are reported as mean±SD. The results derive from three independent experiments. Abbreviations: BFU-E, Burst forming unit-erythroid; CFU, Colony forming unit; E, erythrocyte; GM, granulocyte-monocyte; GEMM, granulocyte-erythrocyte-monocyte-megakaryocyte. doi:10.1371/journal.pone.0172430.g003
CB-CD34+ cells. In the latter case, only MSC samples with at least 95% purity following cell sorting were used.
Five-hundred-ninety-seven genes were expressed differentially in untreated vs. cultured MSCs with a corrected p<0.05 and a fold change < -2 or > +2. The two cell populations were clearly separated as suggested by hierarchical clustering based on the expression of these genes (Fig 6A).
Again, to explore the potential biological role associated with the transcriptional changes, GSEA and pathway analyses were performed. Among others, we found a significant enrich-ment in genes involved in angiogenesis and VEGF signalling, proliferation and aurora kinase B activity, and NF-kappa B pathway (Fig 6B,S4 Table), as well as genes involved in cell-to-cell signalling and interaction, cell cycle, and cardiovascular system development and function (S7 andS8Figs;S5 Table).
Among the genes differentially expressed in MSCs-alone vs. co-cultured MSCs,VEGFA was used as validating gene of microarray data. QRT-PCR analysis confirmed a significant VEGFA up-regulation following co-culture of MSCs and HSCs (Fig 7).
Fig 4. Gene expression analysis of CB-CD34+ cells after co-culture with MSCs. (A) Supervised analysis
of CB-alone vs. Total SN+AD. CB-CD34+ cells were maintained for 10 days in co-culture with MSCs. A heat map of the genes differentially expressed in a statistically significant manner after co-culture (corrected p value<0.05) is plotted. (B) Gene Set Enrichment Analysis (GSEA) of CB-alone vs Total SN+AD. Enriched gene sets from hallmark gene sets are plotted. Please refer toS2 Tablefor the complete GSEA details. Abbreviation: CB-alone: CB-CD34+ cells in single culture; Total SN+AD: CB-CD34+ cells grown in presence of MSCs.
Discussion
MSCs are essential for HSC self-renewal and proliferation [28–30] and, in the case of IB-HSCT, it has been suggested that they can favour haematologic recovery by interacting with CB-CD34+ cells when injected locally into the BM [31,32]. Nevertheless, experimental data and comprehensive indications suggesting that HSCs priming with MSCs could improve the clinical outcome in the setting of allogeneic HSCs transplantation are still lacking. For this purpose, we investigated how bone marrow-derived MSCs can affect the molecular and func-tional phenotype of CB-CD34+ cells and vice versa. To this end, we set up a co-culture system of human CB-CD34+ cells with third-party MSCs to elucidate the mechanisms depending on the early reciprocal interaction between MSCs and HSCs.
In presence of BM-MSCs, a significant increase in CB-CD34+ cell proliferation (fold increase of 14.68, p = 0.019) was observed as compared to the CB-CD34+ cells cultured alone. Since the increase was mainly observed in the SN-fraction (fold increase of 13.20, p = 0.025), we supposed that the inductive proliferative effects of MSCs on HSCs could be mediated by MSCs-derived molecules. We did not carry out a systematic and complete study of secretome. It has been already reported that several cytokines and growth factors, such as SDF-1, stem cell factor (SCF), Flt-3 ligand (FL), thrombopoietin (TPO), interleukin (IL)-6, IL-11, tumor necro-sis factor-alpha (TNF-alpha), and transforming growth factor-beta 1 (TGF-beta1), are involved in inducing proliferative effects on HSCs [33]. We looked at the levels of TNF-alpha, inter-feron-gamma, IL-8, IL-6, sVCAM-1 and sICAM-1 in the supernatant of the cultures, and at the end of 10 days of co-culture, we did not find a significant increase in the levels of the above-mentioned cytokines in the co-culture medium, even though higher detectable levels of TNF-alpha, IL-6 and sVCAM-1 were present (data not shown). Although a possible partial degrada-tion of these cytokines cannot be excluded, our results suggest that their producdegrada-tion was not induced by co-culturing. This observation is not in contrast with that which has been reported in a number of studies published in recent years [34–40]. The majority of these studies did not specify whether the inductive proliferative effects of MSCs on HSCs depended on direct con-tact with MSCs or mediation by soluble molecules. Furthermore, they did not provide any information regarding HSC differentiation, as well as gene expression profiles. Alakel et al. investigated the impact of direct contact between MSCs and HSCs in terms of expansion, dif-ferentiation, migratory capacity, and gene expression profile [41]. However, they used Fig 5. Real-Time Quantitative Polymerase Chain Reaction PCR (qRT-PCR) analysis of CCNA1 gene.
Expression level of CCNA1 gene was assessed by qRT-PCR. Quantification of mRNA relative quantity was calculated as relative changes in gene expression of the target gene normalised to the GAPDH endogenous control and relative to a calibrator sample. The values obtained were represented as relative quantity of mRNA level variations.
mobilised CD133+ haematopoietic progenitor cells from healthy adult donors instead of CB-CD34+ cells collected after natural delivery, thereby introducing the granulocyte colony-stimulating factor (G-CSF) treatment as a variable. Nevertheless, their results are superimpos-able with ours; in particular, they observed that when CD133+ cells were grown in the pres-ence of MSCs, there was a significant increase in the number of haematopoietic progenitor cells and an increase in the number BFU-E colonies. Moreover, when they performed gene expression analysis between non-adherent and adherent fractions, they observed a modulation in genes involved in cell-to-cell and cell-to-extracellular matrix contact, cell cycle and some signalling pathways. Interestingly, just like Alakel et al. in their study, we found that co-cul-tured CB-CD34+ cells were first induced by MSCs towards erythroid commitment. On the other hand, we did not observe an inductive differentiation effect on CFU-GM. We do not have a clear explanation as to why the BFU-E differentiation was favoured as compared to CFU-GEMM and CFU-GM. In this regard, we can only speculate that the preferential shift Fig 6. Gene expression profiles analysis of MSCs after co-culturing with CB-CD34+ cells. (A)
Supervised analysis of MSCs-alone vs. MSCs after 10 days of co-culture with CB-CD34+ cells. A heat map of the genes differentially expressed in a statistically significant manner after co-culture (corrected p value <0.05) is plotted. (B) Gene Set Enrichment Analysis (GSEA) of MSCs-alone vs. MSCs maintained for 10 days in co-culture with CB-CD34+ cells. Top 10 gene sets from hallmark gene sets, canonical/KEGG pathways and oncogenic signatures are plotted. Please refer toS4 Tablefor the complete GSEA details.
towards erythroid commitment is a priority and thus the first and more important step for ini-tiating new haematopoietic reconstitution. In this regard, Alakel et al. also did not provide a clear explanation of this phenomenon.
The increased capacity of proliferation and the preferential erythroid differentiation of CB-CD34+ cells co-cultured with MSCs were confirmed by gene expression profile analysis. IPA-based pathway analysis revealed significant involvement of genes regulating cell-to-cell signalling (e.g.ARHGEF2, DGKE) [42,43], haematological system development and function (e.g.TPP2, HOXA9, SOS1) [44–46], cell cycle, growth and proliferation (e.g.AIM2, BMP2K, ZNRF3) [47,48]. In particular, genes such asID1 and PCGF2 should be deemed relevant since they are recognised to be the key regulators of several processes affecting haematopoiesis [49– 51]. Furthermore, the higher expression ofCCNA1 gene, which encodes for cyclin A1, a master regulator of the cell cycle [52], would confirm the higher proliferation rate of HSCs in the pres-ence of MSCs. The enrichment in genes involved in erythroid differentiation (e.g.LAMP2, CLCN3, BMP2K and SLC30A1) [53–56] and down-modulation of genes participating to mye-loid and lymphoid differentiation (e.g.ID1, PCGF2) [57,58] are in accordance with the prefer-ential shift of HSCs towards the erythroid commitment observed in the clonogenic assays. Interestingly, bioinformatic analysis did not reveal a modulation of genes encoding haemoglo-bin proteins (such as HBA1, HBA2, HBB, HBG1, HBG2). This could be explained by the fact that gene expression profile analyses in co-cultured CB-CD34+ cells were performed after cell sorting on the basis of CD45 and CD34 expression. In this setting, only immature haemato-poietic progenitors were examined. Since genes encoding haemoglobin proteins get expressed during erythrocyte differentiation, it is unlikely to record their statistically significant differ-ences in terms of gene expression. Indeed, only HBB gene showed a borderline significant trend (FDR = 0.08, fold change = 1.2).
Not only did the MSCs reveal to be able to modulate both the expansion of CB-CD34+ cells (particularly in the SN-fraction) and the commitment towards erythroid lineage, but it was also found that HSCs influence MSCs behaviour. Unlike Alakel’s study, where authors fucused on hematopoietic compartment only, we also performed a deep characterization of the stromal component. Interestingly, MSCs co-cultured with CB-CD34+ cells revealed a modulation of genes involved in molecular pathways related to hypoxia and oxygen-level response (e.g. TNFAIP3, SLC2A3, KLF6) and also a profound modification of pathways involved in angio-genesis and vascular processes (e.g.VEGFA, IGF1, ID1) [59–64], as well asmTORC1 [65,66] Fig 7. Real-Time Quantitative Polymerase Chain Reaction PCR (qRT-PCR) analysis of VEGFA gene.
Expression level of VEGFA in co-cultured MSCs was assessed by qRT-PCR. Quantification of mRNA relative quantity was calculated as relative changes in gene expression of the target gene normalised to the GAPDH endogenous control and relative to a calibrator sample. The values obtained were represented as relative quantity of mRNA level variations as compared to MSCs-alone.
and Aurora kinases A and B [67,68]. Among these genes,VEGFA is one of the most intriguing because it is an inducible growth factor that stimulates the formation of new blood vessels in response to hypoxia, and it is one of the mechanisms by which MSCs can be involved in tissue regeneration [69–71]. In particular, VEGFA is reported to stimulate postnatal haematopoiesis [72] and to make stem cells resistant to an ischemic environment they would encounter after transplantation into injured tissue and it improves the survival of both the transplanted cells and the host cells at the injury site [73]. The qRT-PCR analysis onVEGFA confirmed its up-regulation, in agreement with the microarray results. These data are thus indicative of a bi-directional interaction between CB-CD34+ cells and MSCs that would favour the remodelling of the BM-niche structure, and underline the importance of a switch from the osteogenic to the vascular compartment in transplantation.
Conclusion
Taken all together, our results suggest that MSCs can exert a priming effect on CB-CD34 + cells, possibly by secreting specific molecules essential to the regulation of HSC proliferation and erythroid differentiation. In turn, CB-CD34+ cells seem to be able to polarise the BM-niche towards the vascular compartment by modulating molecular pathways related to hyp-oxia and angiogenesis. From a clinical point of view, since it is known that in the allo-trans-planted patients MSCs may decrease by up to 90% and that this reduction is correlated to a defective haematopoietic reconstitution [74], these data would suggest that a co-infusion of MSCs with CB-CD34+ cells may favour the haematological recovery after IB-HSCT, possibly by replacing damaged stroma and by promoting HSC engraftment through the remodelling the BM-niche from the osteogenic compartment to the vascular one.
Supporting information
S1 Fig. Flow cytometry detection of CB-CD34+ cells. HSCs were considered to be CD45+ dim
CD34+. (TIFF)
S2 Fig. Flow cytometry detection of CB-CD34+ cells after immunomagnetic enrichment. (TIFF)
S3 Fig. Characterisation of BM-derived MSC differentiation potential. Osteogenic, chon-drogenic and adipogenic differentiation was assessed after culture in proper media and specific staining.
(TIFF)
S4 Fig. IPA analysis on CB-CD34+ cells co-cultured with MSCs. The network is representa-tive of cell cycle, cell death and survival pathways.
(TIFF)
S5 Fig. IPA analysis of CB-CD34+ cells co-cultured with MSCs. The network is representa-tive of cellular growth and proliferation, haematological system development and function and haematopoietic pathways.
(TIFF)
S6 Fig. IPA analysis of CB-CD34+ cells co-cultured with MSCs. The network is representa-tive of cell-to-cell signaling and interaction pathways.
S7 Fig. Schematic representation of the cellular growth and proliferation network as iden-tified by IPA pathway analysis and specifically related to hematopoiesis. Key regulator genes are highlighted by blue circles.
(TIFF)
S8 Fig. IPA analysis of MSCs after co-culture with CB-CD34+ cells. The plot is representa-tive of cell-to-cell signaling and interaction, cellular movement, and immune cell trafficking networks.
(TIFF)
S9 Fig. IPA analysis of MSCs after co-culturing with CB-CD34+ cells. The plot is represen-tative of cardiovascular system development and function, cellular development and haemato-logical system development and function networks.
(TIFF)
S1 Table.Ex vivo expansion of CB-CD34+ cells with MSCs. The table summarise the results about the assessment of theex vivo expansion of CB-CD34+ cells grown in presence of MSCs. Briefly, 5×10⁵CB-CD34+ cells were cultured alone or in presence of a layer of MSCs for 10 days; the fold increase in total cell number was calculated from the original CD34+ cells seeded at day 0. Absolute number of CB-CD34+ cells was measured by flow cytometry. Values derive as median of 5 replicates. Abbreviation: CB-alone: number of CB-CD34+ cells after 10 days of single culture; SN-fraction: CB-CD34+ cells in the supernatant (SN-fraction) of the co-cultures with MSCs; AD-fraction: CB-CD34+ cells grown directly in contact with MSCs layer; Total SN +AD: total number of CB-CD34+ cells after co-culture with MSCs.
(DOC)
S2 Table. Gene Set Enrichment Analysis (GSEA) of CB-alone vs. total SN+AD. The table reports Hellmark Genes, Oncogenic-linked Genes, Immune-linked Genes and Pathways enriched after co-culture. Each category is reported in a different sheet, where the Gene Set Name, the number of Genes in Gene Set (K), the Description, the number of Genes in Overlap (k), the k/K ratio, the p-value and the FDR q-value are listed. The Gene/Gene set overlap Matrix reports also the Entrez Gene ID, the Gene Symbol and the Description fully detailed. (XLS)
S3 Table. Ingenuity Pathway Analysis (IPA) of CB-alone vs. total SN+AD. The table reports the networks in which the differentially expressed genes (in bold characters) are involved. Col-umns list the Molecules in Network, the Score, the Focus-molecules and the direct related Top Diseases and Functions Molecules.
(DOCX)
S4 Table. Gene Set Enrichment Analysis (GSEA) of MSCs-alone vs. co-cultured MSCs. The table reports Hellmark Genes, Oncogenic-linked Genes, Immune-linked Genes and Pathways enriched after co-culturing. Each category is reported in a different sheet, where the Gene Set Name, the number of Genes in Gene Set (K), the Description, the number of Genes in Overlap (k), the k/K ratio, the p-value and the FDR q-value are listed. The Gene/Gene set overlap Matrix reports also the Entrez Gene ID, the Gene Symbol and the Description fully detailed. (XLS)
S5 Table. Ingenuity Pathway Analysis (IPA) of MSCs-alone vs. co-cultured MSCs. The table reports the networks in which the differential expressed genes (in bold characters) are involved. Columns list the Molecules in Network, the Score, the Focus-molecules and the
direct related Top Diseases and Functions Molecules. (DOCX)
Acknowledgments
This study was supported by PRIN_2009, BCC “Pompiano e Franciacorta”, LIONS Bassa Bresciana. Special thanks are to Studio Moretto Group Srl for English revision (http://www. smglanguages.com).
Author Contributions
Conceptualization: SF DR. Data curation: FC VC.
Formal analysis: SP ADP PPP EG G. Borsani ET MTS SB CZ MK CA DR. Funding acquisition: DR.
Investigation: SP ADP CG EZ G. Bassi. Methodology: SP ADP.
Project administration: DR.
Resources: CG EZ G. Bassi AL ET MTS M. Malagola MK M. Marini CA SF DR. Supervision: DR.
Visualization: SP ADP.
Writing – original draft: SP ADP.
Writing – review & editing: PPP MK SF DR.
References
1. Orkin SH, Zon LI. Hematopoiesis: An Evolving Paradigm for Stem Cell Biology. Cell 2008 Feb 22; 132 (4):631–644. doi:10.1016/j.cell.2008.01.025PMID:18295580
2. Doulatov S, Notta F, Laurenti E, Dick JE. Hematopoiesis: a human perspective. Cell Stem Cell 2012 Feb 3; 10(2):120–136. doi:10.1016/j.stem.2012.01.006PMID:22305562
3. Bianco P. “Mesenchymal” Stem Cells. Annu. Rev Cell Dev Biol. 2014; 30:677–704. doi:10.1146/ annurev-cellbio-100913-013132PMID:25150008
4. Frenette PS, Pinho S, Lucas D, Scheiermann C. Mesenchymal Stem Cell: Keystone of the Hematopoi-etic Stem Cell Niche and a Stepping-Stone for Regenerative Medicine. Annu. Rev Immunol 2013; 31:285–316. doi:10.1146/annurev-immunol-032712-095919PMID:23298209
5. Boulais PE, Frenette PS. Making sense of hematopoietic stem cell niches. Blood 2015; 125(17):2621– 2629. doi:10.1182/blood-2014-09-570192PMID:25762174
6. Renstro¨m J, Kro¨ger M, Peschel C, Oostendorp RA. How the niche regulates hematopoietic stem cells. Chem Biol Interact 2010 Mar 19; 184(1–2):7–15. doi:10.1016/j.cbi.2009.11.012PMID:19944675
7. Ehninger A, Trumpp A. The bone marrow stem cell niche grows up: mesenchymal stem cells and mac-rophages move in. J Exp Med 2011 Mar 14; 208(3):421–428. doi:10.1084/jem.20110132PMID: 21402747
8. Chotinantakul K, Leeanansaksiri W. Hematopoietic stem cell development, niches, and signaling path-ways. Bone Marrow Res 2012; 2012:270425. doi:10.1155/2012/270425PMID:22900188
9. Zhang CC, Lodish HF. Cytokines regulating hematopoietic stem cell function. Curr Opin Hematol. 2008 Jul; 15(4):307–311. doi:10.1097/MOH.0b013e3283007db5PMID:18536567
10. Kunisaki Y, Bruns I, Scheiermann C, Ahmed J, Pinho S, Zhang D, et al. Arteriolar niches maintain hae-matopoietic stem cell quiescence. Nature 2013 Oct 31; 502(7473):637–643. doi:10.1038/nature12612 PMID:24107994
11. Ding L, Morrison SJ. Haematopoietic stem cells and early lymphoid progenitors occupy distinct bone marrow niches. Nature. 2013 Mar 14; 495(7440):231–5. doi:10.1038/nature11885PMID:23434755
12. Greenbaum A, Hsu YM, Day RB, Schuettpelz LG, Christopher MJ, Borgerding JN et al. CXCL12 in early mesenchymal progenitors is required for haematopoietic stem-cell maintenance. Nature 2013 Mar 14; 495(7440):227–230. doi:10.1038/nature11926PMID:23434756
13. Me´ndez-Ferrer S, Michurina TV, Ferraro F, Mazloom AR, Macarthur BD, Lira SA, et al. Mesenchymal and haematopoietic stem cells form a unique bone marrow niche. Nature 2010 Aug 12; 466(7308):829– 834. doi:10.1038/nature09262PMID:20703299
14. Carrancio S, Blanco B, Romo C, Muntion S, Lopez-Holgado N, Blanco JF, et al. Bone marrow mesen-chymal stem cells for improving hematopoietic function: an in vitro and in vivo model. Part 2: Effect on bone marrow microenvironment. PLoS One 2011; 6(10):e26241. doi:10.1371/journal.pone.0026241 PMID:22028841
15. Frisch BJ, Porter RL, Calvi LM. Hematopoietic niche and bone meet. Curr Opin Support Palliat Care 2008; 2:211–217. doi:10.1097/SPC.0b013e32830d5c12PMID:18685423
16. Wagner W, Wein F, Roderburg C, Saffrich R, Faber A, Krause U, et al. Adhesion of hematopoietic pro-genitor cells to human mesenchymal stem cells as a model for cell-cell interaction. Exp Hematol 2007 Feb; 35(2):314–325. doi:10.1016/j.exphem.2006.10.003PMID:17258080
17. Papayannopoulou T, Priestley GV, Nakamoto B, Zafiropoulos V, Scott LM. Molecular pathways in bone marrow homing: dominant role of alpha(4)beta(1) over beta(2)-integrins and selectins. Blood 2001 Oct 15; 98(8):2403–2411. PMID:11588037
18. Brunstein CG, Barker JN, Weisdorf DJ, Defor TE, McKenna D, Chong SY, et al. Intra-BM injection to enhance engraftment after myeloablative umbilical cord blood transplantation with two partially HLA-matched units. Bone Marrow Transplant 2009 Jun; 43(12):935–940. doi:10.1038/bmt.2008.417PMID: 19139736
19. Frassoni F, Gualandi F, PodestàM, Raiola AM, Ibatici A, Piaggio G, et al. Direct intrabone transplant of unrelated cord-blood cells in acute leukaemia: a phase I/II study. Lancet Oncol 2008 Sep; 9(9):831– 839. doi:10.1016/S1470-2045(08)70180-3PMID:18693069
20. Livak KJ, Schmittgen TD. Analysis of relative gene expression data using real-time quantitative PCR and the 2(-Delta Delta C(T)) Method. Methods 2001 Dec; 25(4):402–408. doi:10.1006/meth.2001.1262 PMID:11846609
21. Piccaluga PP, Agostinelli C, Califano A, Rossi M, Basso K, Zupo S, et al. Gene expression analysis of peripheral T cell lymphoma, unspecified, reveals distinct profiles and new potential therapeutic targets. J Clin Invest 2007 Mar; 117(3):823–834. doi:10.1172/JCI26833PMID:17304354
22. Piccaluga PP, Califano A, Klein U, Agostinelli C, Bellosillo B, Gimeno E, et al. Gene expression analysis provides a potential rationale for revising the histological grading of follicular lymphomas. Haematolo-gica 2008 Jul; 93(7):1033–1038. doi:10.3324/haematol.12754PMID:18492688
23. Piccaluga PP, De Falco G, Kustagi M, Gazzola A, Agostinelli C, Tripodo C, et al. Gene expression anal-ysis uncovers similarity and differences among Burkitt lymphoma subtypes. Blood 2011 Mar 31; 117 (13):3596–3608. doi:10.1182/blood-2010-08-301556PMID:21245480
24. Navari M, Fuligni F, Laginestra MA, Etebari M, Ambrosio MR, Sapienza MR, et al. Molecular signature of Epstein Barr virus-positive Burkitt lymphoma and post-transplant lymphoproliferative disorder sug-gest different roles for Epstein Barr virus. Front Microbiol 2014 Dec 23; 5:728. doi:10.3389/fmicb.2014. 00728PMID:25566237
25. Huang DW, Sherman BT, Lempicki RA. Systematic and integrative analysis of large gene lists using DAVID Bioinformatics Resources. Nature Protoc 2009; 4(1):44–57.
26. Huang DW, Sherman BT, Lempicki RA. Bioinformatics enrichment tools: paths toward the comprehen-sive functional analysis of large gene lists. Nucleic Acids Res 2009; 37(1):1–13. doi:10.1093/nar/ gkn923PMID:19033363
27. Subramanian A, Tamayo P, Mootha VK, Mukherjee S, Ebert BL, Gillette MA, et al. Gene set enrichment analysis: a knowledge-based approach for interpreting genome-wide expression profiles. Proc Natl Acad Sci U S A 2005 Oct 25; 102(43):15545–15550. doi:10.1073/pnas.0506580102PMID:16199517
28. Wang LD, Wagners AJ. Dynamic niches in the origination and differentiation of hematopoietic stem cells. Nat Rev Mol Cell Biol 2011 Sep 2; 12(10):643–655. doi:10.1038/nrm3184PMID:21886187
29. Wagner W, Roderburg C, Wein F, Diehlmann A, Frankhauser M, Schubert R, et al. Molecular and secretory profiles of human mesenchymal stromal cells and their abilities to maintain primitive
hematopoietic progenitors. Stem Cells 2007; 25(10):2638–2647. doi:10.1634/stemcells.2007-0280 PMID:17615262
30. Mendelson A, Frenette PS. Hematopoietic stem cell niche maintenance during homeostasis and regen-eration. Nat Med. 2014 Aug; 20(8):833–846. doi:10.1038/nm.3647PMID:25100529
31. Wu KH, Wu HP, Chan CK, Hwang SM, Peng CT, Chao YH. The role of mesenchymal stem cells in hematopoietic stem cell transplantation: from bench to bedsides. Cell Transplant 2013; 22(4):723–729. doi:10.3727/096368912X655217PMID:23068433
32. Fajardo-Orduna GR, Mayani H, Montesinos JJ. Hematopoietic Support Capacity of Mesenchymal Stem Cells: Biology and Clinical Potential. Arch Med Res 2015; 46(8):589–596. doi:10.1016/j.arcmed. 2015.10.001PMID:26522615
33. Li T, Wu Y. Paracrine Molecules of Mesenchymal Stem Cells for Hematopoietic Stem Cell Niche. Bone Marrow Res 2011; 2011:353878 doi:10.1155/2011/353878PMID:22046560
34. McNiece IK, Harrington J, Turney J, Kellner J, Shpall EJ. Ex vivo expansion of cord blood mononuclear cells on mesenchymal stem cells. Cytotherapy 2004; 6(4):311–317. doi:10.1080/14653240410004871 PMID:16146883
35. Mehrasa R, Vaziri H, Oodi A, Khorshidfar M, Nikogoftar M, Golpour M, et al. Mesenchymal stem cells as a feeder layer can prevent apoptosis of expanded hematopoietic stem cells derived from cord blood. Int J Mol Cell Med 2014 Winter; 3(1):1–10. PMID:24551815
36. de Lima M, McNiece I, Robinson SN, Munsell M, Eapen M, Horowitz M, et al. Cord-blood engraftment with ex vivo mesenchymal-cell coculture. N Engl J Med 2012; 367(24):2305–2315. doi:10.1056/ NEJMoa1207285PMID:23234514
37. Flores-Guzma´n P, Flores-Figueroa E, Montesinos JJ, Martı´nez-Jaramillo G, Ferna´ndez-Sa´nchez V, Valencia-Plata I, et al. Individual and combined effects of mesenchymal stromal cells and recombinant stimulatory cytokies on the in vitro growth of primitive hematopoietic cells from human umbilical cord blood. Cytotherapy 2009; 11(7):886–896. doi:10.3109/14653240903180076PMID:19903101
38. Pelagiadis I, Stiakaki E, Choulaki C, Kalmanti M, Dimitriou H. The role of children’s bone marrow mes-enchymal stromal cells in the ex vivo expansion of autologous and allogeneic hematopoietic stem cells. Cell Biol Int 2015 Oct; 39(10):1099–1110. doi:10.1002/cbin.10483PMID:25914387
39. Klein C, Strobel J, Zingsem J, Richter RH, Goecke TW, Beckmann MW, et al. Ex vivo expansion of hematopoietic stem- and progenitor cells from cord blood in coculture with mesenchymal stroma cells from amnion, chorion, Wharton’s jelly, amniotic fluid, cord blood, and bone marrow. Tissue Eng Part A 2013 Dec; 19(23–24):2577–2585. doi:10.1089/ten.tea.2013.0073PMID:24308543
40. Huang GP, Pan ZJ, Jia BB, Zheng Q, Xie CG, Gu JH, et al. Ex vivo expansion and transplantation of hematopoietic stem/progenitor cells supported by mesenchymal stem cells from human umbilical cord blood. Cell Transplant 2007; 16(6):579–585. PMID:17912949
41. Alakel N, Jing D, Muller K, Bornhauser M, Ehninger G, Ordemann R. Direct contact with mesenchymal stromal cells affects migratory behavior and gene expression profile of CD133+ hematopoietic stem cells during ex vivo expansion. Exp Hematol 2009 Apr; 37(4):504–513. doi:10.1016/j.exphem.2008.12. 005PMID:19216019
42. Cullis J, Meiri D, Sandi MJ, Radulovich N, Kent OA, Medrano M, et al. The RhoGEF GEF-H1 is required for oncogenic RAS signaling via KSR-1. Cancer Cell 2014 Feb 10; 25(2):181–195. doi:10.1016/j.ccr. 2014.01.025PMID:24525234
43. Vijayan KV. DGKE disruption ditches complement and drives p38 signaling. Blood 2015 Feb 5; 125 (6):898–899. doi:10.1182/blood-2014-12-617589PMID:25655457
44. Huai J, Firat E, Nil A, Million D, Gaedicke S, Kanzler B et al. Activation of cellular death programs asso-ciated with immunosenescence-like phenotype in TPPII knockout mice. Proc Natl Acad Sci U S A 2008 Apr 1; 105(13):5177–5182. doi:10.1073/pnas.0801413105PMID:18362329
45. Argiropoulos B, Humphries RK. Hox genes in hematopoiesis and leukemogenesis. Oncogene 2007 Oct 15; 26(47):6766–6776. doi:10.1038/sj.onc.1210760PMID:17934484
46. Baltana´s FC, Pe´rez-Andre´s M, Ginel-Picardo A, Diaz D, Jimeno D, Liceras-Boillos P, et al. Functional redundancy of Sos1 and Sos2 for lymphopoiesis and organismal homeostasis and survival. Mol Cell Biol 2013 Nov; 33(22):4562–4578. doi:10.1128/MCB.01026-13PMID:24043312
47. Man SM, Zhu Q, Zhu L, Liu Z, Karki R, Malik A, et al. Critical Role for the DNA Sensor AIM2 in Stem Cell Proliferation and Cancer. Cell 2015 Jul 2; 162(1):45–58. doi:10.1016/j.cell.2015.06.001PMID: 26095253
48. Planas-Paz L, Orsini V, Boulter L, Calabrese D, Pikiolek M, Nigsch F, et al. The RSPO-LGR4/5-ZNRF3/ RNF43 module controls liver zonation and size. Nat Cell Biol 2016 May; 18(5):467–479. doi:10.1038/ ncb3337PMID:27088858
49. Perry SS, Zhao Y, Nie L, Cochrane SW, Huang Z, Sun XH. Id1, but not Id3, directs long-term repopulat-ing hematopoietic stem-cell maintenance. Blood 2007 Oct 1; 110(7):2351–2360. doi: 10.1182/blood-2007-01-069914PMID:17622570
50. Wood AD, Chen E, Donaldson IJ, Hattangadi S, Burke KA, Dawson MA, et al. ID1 promotes expansion and survival of primary erythroid cells and is a target of JAK2V617F-STAT5 signaling. Blood 2009 Aug 27; 114(9):1820–1830. doi:10.1182/blood-2009-02-206573PMID:19571317
51. Kajiume T, Ninomiya Y, Ishihara H, Kanno R, Kanno M. Polycomb group gene mel-18 modulates the self-renewal activity and cell cycle status of hematopoietic stem cells. Exp Hematol 2004 Jun; 32 (6):571–578. doi:10.1016/j.exphem.2004.03.001PMID:15183898
52. Yang R, Mu¨ller C, Huynh V, Fung YK, Yee AS, Koeffler HP. Functions of Cyclin A1 in the Cell Cycle and Its Interactions with Transcription Factor E2F-1 and the Rb Family of Proteins. Mol Cell Biol 1999 Mar; 19(3):2400–2407 PMID:10022926
53. Delaby C, Rondeau C, Pouzet C, Willemetz A, Pilard N, Desjardins M, et al. Subcellular localization of iron and heme metabolism related proteins at early stages of erythrophagocytosis. PLoS One 2012; 7 (7):e42199. doi:10.1371/journal.pone.0042199PMID:22860081
54. Babitt JL, Huang FW, Wrighting DM, Xia Y, Sidis Y, Samad TA, et al. Bone morphogenetic protein sig-naling by hemojuvelin regulates hepcidin expression. Nat Genet 2006 May; 38(5):531–539. doi:10. 1038/ng1777PMID:16604073
55. Huber KL, Cousins RJ. Zinc metabolism and metallothionein expression in bone marrow during erythro-poiesis. Am J Physiol 1993 May; 264(5 Pt 1):E770–5 PMID:8498498
56. Ryu MS, Lichten LA, Liuzzi JP, Cousins RJ. Zinc transporters ZnT1 (Slc30a1), Zip8 (Slc39a8), and Zip10 (Slc39a10) in mouse red blood cells are differentially regulated during erythroid development and by dietary zinc deficiency. J Nutr 2008; 138(11):2076–2083. doi:10.3945/jn.108.093575PMID: 18936201
57. Buitenhuis M, van Deutekom HW, Verhagen LP, Castor A, Jacobsen SE, Lammers JW, et al. Differen-tial regulation of granulopoiesis by the basic helix-loop-helix transcriptional inhibitors Id1 and Id2”— Blood 2005; 105(11):4272–4281. doi:10.1182/blood-2004-12-4883PMID:15701714
58. Miyazaki M, Kawamoto H, Kato Y, Itoi M, Miyazaki K, Masuda K, et al. Polycomb group gene mel-18 regulates early T progenitor expansion by maintaining the expression of Hes-1, a target of the Notch pathway. J Immunol 2005; 174(5):2507–2516. PMID:15728456
59. Park JH, Lee JY, Shin DH, Jang KS, Kim HJ, Kong G. Loss of Mel-18 induces tumor angiogenesis through enhancing the activity and expression of HIF-1αmediated by the PTEN/PI3K/Akt pathway. Oncogene 2011; 30(45):4578–4589. doi:10.1038/onc.2011.174PMID:21602890
60. Lu J, Pompili VJ, Das H. Neovascularization and hematopoietic stem cells. Cell Biochem Biophys 2013; 67(2):235–245. doi:10.1007/s12013-011-9298-xPMID:22038301
61. Shigematsu S, Yamauchi K, Nakajima K, Iijima S, Aizawa T, Hashizume K. IGF-1 regulates migration and angiogenesis of human endothelial cells. Endocr J 1999 Mar; 46 Suppl:S59–62.
62. Nishiyama K, Takaji K, Kataoka K, Kurihara Y, Yoshimura M, Kato A, et al. Id1 gene transfer confers angiogenic property on fully differentiated endothelial cells and contributes to therapeutic angiogenesis. Circulation 2005; 112(18):2840–2850. doi:10.1161/CIRCULATIONAHA.104.516898PMID:16267257
63. Watabe T. Roles of old players in the suppression of a new player: networks for the transcriptional con-trol of angiogenesis. J Biochem. 2011; 149(2):117–119. doi:10.1093/jb/mvq146PMID:21172954
64. Lee D, Shenoy S, Nigatu Y, Plotkin M. Id proteins regulate capillary repair and perivascular cell prolifera-tion following ischemia-reperfusion injury. PLoS One 2014; 9(2):e88417. doi:10.1371/journal.pone. 0088417PMID:24516656
65. Walker NM, Belloli EA, Stuckey L, Chan KM, Lin J, Lynch W, et al. Mechanistic Target of Rapamycin Complex 1 (mTORC1) and mTORC2 as Key Signaling Intermediates in Mesenchymal Cell Activation. J Biol Chem 2016 Mar 18; 291(12):6262–6271. doi:10.1074/jbc.M115.672170PMID:26755732
66. Martin SK, Fitter S, Dutta AK, Matthews MP, Walkley CR, Hall MN, et al. Brief report: the differential roles of mTORC1 and mTORC2 in mesenchymal stem cell differentiation. Stem Cells 2015; 33 (4):1359–1365. doi:10.1002/stem.1931PMID:25537496
67. Carmena M, Earnshaw WC, Glover DM. The Dawn of Aurora Kinase Research: From Fly Genetics to the Clinic. Front Cell Dev Biol 2015 Nov 17; 3:73. doi:10.3389/fcell.2015.00073PMID:26636082
68. Gavriilidis P, Giakoustidis A, Giakoustidis D. Aurora Kinases and Potential Medical Applications of Aurora Kinase Inhibitors: A Review. J Clin Med Res. 2015; 7(10):742–751. doi:10.14740/jocmr2295w PMID:26345296
69. Lee EY, Xia Y, Kim WS, Kim MH, Kim TH, Kim KJ, et al. Hypoxia-enhanced wound-healing function of adipose-derived stem cells: increase in stem cell proliferation and up-regulation of VEGF and bFGF.
Wound Repair Regen 2009 Jul-Aug; 17(4):540–547. doi:10.1111/j.1524-475X.2009.00499.xPMID: 19614919
70. Tang YL, Zhao Q, Zhang YC, Cheng L, Liu M, Shi J, et al. Autologous mesenchymal stem cell trans-plantation induce VEGF and neovascularization in ischemic myocardium. Regul Pept 2004 Jan 15; 117 (1):3–10. PMID:14687695
71. To¨gel F, Weiss K, Yang Y, Hu Z, Zhang P, Westenfelder C. Vasculotropic, paracrine actions of infused mesenchymal stem cells are important to the recovery from acute kidney injury. Am J Physiol Renal Physiol 2007 May; 292(5):F1626–35. doi:10.1152/ajprenal.00339.2006PMID:17213465
72. Hattori K, Dias S, Heissig B, Hackett NR, Lyden D, Tateno M, et al. Vascular endothelial growth factor and angiopoietin-1 stimulate postnatal hematopoiesis by recruitment of vasculogenic and hematopoi-etic stem cells. J Exp Med 2001 May 7; 193(9):1005–1014. PMID:11342585
73. Liu L, Gao J, Yuan Y, Chang Q, Liao Y, Lu F. Hypoxia preconditioned human adipose derived mesen-chymal stem cells enhance angiogenic potential via secretion of increased VEGF and bFGF. Cell Biol Int 2013 Jun; 37(6):551–560. doi:10.1002/cbin.10097PMID:23505143
74. Galotto M, Berisso G, Delfino L,Podesta M, Ottaggio L, Dallorso S, et al. Stromal damage as conse-quence of high-dose chemo/radiotherapy in bone marrow transplant recipients. Exp Hematol 1999 Sep; 27(9):1460–1466. PMID:10480437