ScienceDirect
Available online at www.sciencedirect.comTransportation Research Procedia 45 (2020) 587–595
2352-1465 2020 The Authors. Published by Elsevier B.V.
This is an open access article under the CC BY-NC-ND license (http://creativecommons.org/licenses/by-nc-nd/4.0/) Peer-review under responsibility of the scientific committee of the Transport Infrastructure and Systems (TIS ROMA 2019). 10.1016/j.trpro.2020.03.053
10.1016/j.trpro.2020.03.053 2352-1465
© 2020 The Authors. Published by Elsevier B.V.
This is an open access article under the CC BY-NC-ND license (http://creativecommons.org/licenses/by-nc-nd/4.0/) Peer-review under responsibility of the scientific committee of the Transport Infrastructure and Systems (TIS ROMA 2019).
ScienceDirect
Transportation Research Procedia 00 (2019) 000–000
www.elsevier.com/locate/procedia
2352-1465 © 2020 The Authors. Published by Elsevier Ltd. This is an open access article under the CC BY-NC-ND license (https://creativecommons.org/licenses/by-nc-nd/4.0/)
Peer-review under responsibility of the scientific committee of TIS ROMA 2019
AIIT 2nd International Congress on Transport Infrastructure and Systems in a changing world
(TIS ROMA 2019), 23rd-24th September 2019, Rome, Italy
Use of eye tracking device to evaluate the driver’s behaviour and
the infrastructures quality in relation to road safety
David Vetturi
a*, Michela Tiboni
b, Giulio Maternini
b, Michela Bonera
ba DIMI – Università degli Studi di Brescia, Brescia 25125, Italy b DICATAM - Università degli Studi di Brescia, Brescia 25125, Italy
Abstract
Eye tracking allows to obtain important elements regarding the drivers’ behaviour during their driving activity, by employing a device that monitors the movements of the eye and therefore of the user's observation point. In this paper it will be explained how analysing the behaviour of the drivers through the eye movements permits to evaluate the infrastructures quality in terms of road safety.
Driver behaviour analysis have been conducted in urban areas, examining the observation target (cars, pedestrians, road signs, distraction elements) in quantitative terms (time of fixing each singular target). In particular, roundabout intersections and rectilinear segment of urban arterials have been examined and the records related to seven drivers’ behaviour were collected, in order to have a significant statistical variability. Only young people has considered in this study.
The analyses carried out have made it possible to assess how different types of infrastructure influence the behaviour of road users, in terms of safety performance given by their design.
In particular, quantitative analyzes were carried out on driving times dedicated to observing attention rather than distraction targets. From a statistical point of view, the relationship that exists between the characteristics of the driver, weather conditions and infrastructure, with driving behavior (traveling speed and attention / inattention time) was analyzed by ANOVA method.
© 2020 The Authors. Published by Elsevier Ltd. This is an open access article under the CC BY-NC-ND license (https://creativecommons.org/licenses/by-nc-nd/4.0/)
Peer-review under responsibility of the scientific committee of TIS ROMA 2019 Keywords: eye tacking, drives behaviour, road safety, infrastructure quality
* Corresponding author. Tel.: +39-030-3715664 E-mail address: [email protected]
1. Introduction
The use of the eye tracker is proving to be an increasingly effective method to investigate the ocular behavior of driving subjects. Just in the last few years studies related to oculometry on driving people have increased worldwide and have shown a global interest of researcher in road safety (Hurtado.et al., 2016). However, most of the research work used the eye tracker by testing it on subjects intent on driving in a simulate context and not in real driving conditions on the road (Kapitaniak et al., 2015 – Kaminski et al, 2012).
With the use of driving simulation environments many other aspects have been evaluated with the aid of the eye tracker, such as the attention placed near an intersection or near a roundabout with pedestrians intent on crossing and the behavior in the facing motorway curves, characterized by a wide range of travel. Beyond the specific elements analyzed from time to time, it is clear that the use of a simulated environment involves considerable simplifications in the analysis of the situation.
It is therefore natural the choice of many researchers to carry out their studies using the eye tracker without relying on a simulator, but working directly in the urban context. The aspects analyzed are the most diverse: eye movement in dangerous situations (such as intersections and roundabouts), behavior in the presence of fog on the highway, differences between experienced and novice drivers, driving skills in elderly subjects and those with visual problems. According to numerous studies (Rossetti et al, 2015), distraction while driving is one of the main causes of road accidents. Modern street design tends to create urban infrastructures where different road users can coexist, in order to facilitate soft mobility. This combination of different types of road users means greater danger exposure to the vulnerable road users. The road infrastructure does not always favor the attention of drivers, since sometimes tends to create a source of inattention (Tira et al., 2016).
In this paper a study will be presented, conducted in real driving conditions in an urban context, which focuses on the different attitudes of people in relation to the urban contest.
2. Eye Tracking
The two main parameters measured by eye tracking are fixations and saccades. The first occurs when the eye focuses on a specific area, thus the viewer perceives only a small part of his visual field. During the fixation a cognitive elaboration of the observed object is presumed, or a simple transfer of attention to it. The duration of the single fixation depends mainly on the intensity of the luminance contrast, the complexity of the vision area and the cognitive load associated with it.
On the other hand, the saccade is the rapid movement of the eye from one point of fixation to another; this is one of the fastest movements of the human body and lasts about 30 - 80 ms. During this phenomenon the subject does not perceive visual information located on the trajectory of the movement. According to some medical studies, some cognitive functions are momentarily inactive during the saccade. The eye also does not follow a straight path during this movement, but can follow different trajectories; this has been widely observed in the data collected in several studies and during the experimental activity related to this work.
The studies related to the movement of the eyes date back to the end of the 1800s but in the 1980s a hypothesis was formulated, considered valid by researchers in the field (strong eye-mind hypothesis) according to which there is no significant time delay between what is fixed and what is processed; this implies that, for the duration of a fixation, the viewer cognitively processes what he observes.
Historically, mainly three types of eye tacker were used: electro-oculographic, galvanometric and those that exploit corneal reflection. The electro-ocular technique involves the measurement of differences in bioelectric potential caused by movements of the cornea and retina; the measurement is carried out by electrodes placed around the eyes. This technique is precise in assessing movement with good temporal resolution but low spatial resolution; it also tracks eye movements only when the head is immobilized.
Currently, non-invasive techniques are used to study and analyze eye movements and, in particular, corneal reflection is used. A beam of infrared light, generated by a source near the eye, is directed towards the pupil and reflected on the image of the visual field, filmed by the camera placed on the driver's forehead. A specific software is in charge of identifying the position of the gaze; this is made feasible by the possibility of separating the reflection of
the mobile parts of the pupil from that of the other elements of the cornea. This technique is currently the most used in field studies for long-term monitoring of eye movements.
Currently eyes tracking is used both to analyze the visual apparatus and its disorders and to analyze the visual interaction between man and machine in the context of information technology (computer and web).
In recent years there has been a rapid development of the corneal reflection technique, preferred to other methods of analysis for non-invasiveness and the possibility of use in motion. Several instruments of this type and of various price ranges have been placed on the market. The tool used in this work is the eye tracker produced by Pupil Labs, a company based in Germany specialized in eye tracking for virtual and augmented reality.
The instrument consists of a front camera, capable of recording the user's visual field, and two vision systems for the eye movement of each eye in the infrared field.
The acquisition of the scene camera was conducted with a recording frequency of 30 frames per second, with a resolution of 720p (1280x720 pixels, format 16: 9). The two video cameras that record the eyes and the position of the pupil were used with a sampling frequency of 120 Hertz. The eye tracker device is then connected to a personal computer via USB interface.
Figure 1 shown the Pupil Labs eye tracker.
Fig. 1. Pupil Labs’ Eye Traker
The use of the recording device allows, through an activity of previous calibration and processing of the films of the eye movements, to obtain the observation target of the driver, for each frame of the acquired movie,. The estimation of the observation target takes place through an optimization algorithm and a confidence index of the estimate, frame by frame, is provided.
In fugura 2 the processing of the information provided to the user is shown. The green circle instantly indicates the driver's observation point. This position is reconstructed by software from the analysis of the position of the pupils taken from the two additional cameras.
The red line indicates instead the path of the gaze. In this case the driver from the observation of the rear-view mirror quickly passes to the observation of the road with an extremely rapid and regular movement of the gaze.
Fig. 2. Visual analysis results
The data can be processed in raw mode, that is through the analysis of numerical analysis files, both visually monitoring, with the PC, the user observation target.
3. Case Study: on road analysis
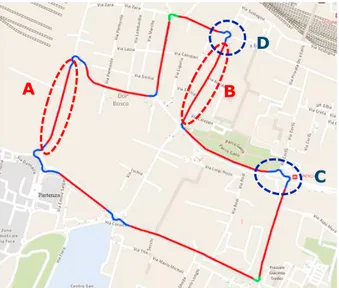
The analyzes were conducted on an urban route in the southern area of the city of Brescia (northern Italy) on different working days during normal traffic conditions. The choice of the route was made based on the different types of urban site consisting that route, either of recent redevelopment and of a more past design, characterized by wide width and high travel speed. The roads are connected to each other by roundabout intersections in most cases. All roads are characterized by having a different function: from the transit of cars to that of pedestrians on the sidewalk, from the presence of parking lots to that of commercial and service activities. The route therefore makes it possible to appreciate different types of infrastructures in a single system of urban planning functions.
Figure 3 shown the area analysed.
Fig. 3. Route analyzed
A
B
C
D
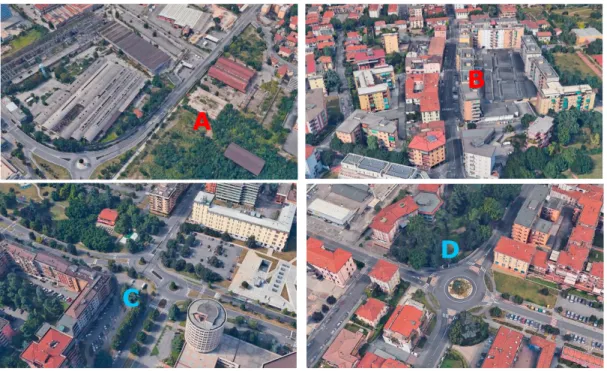
The analyzed route is located in the southern area of the city of Brescia and has been analyzed since, although it is a typically urban area, it has been partially subjected to significant interventions, in recent times, aimed at improving road safety aspects.
Fig. 4. Route analyzed
The tests were conducted with 7 different drivers, 4 males and 3 females, all young people (age 20-23and in two different weather conditions,rain and sun. The quantitative analysis of the observation times of the individual targets requires a very onerous manual processing in terms of time. For this reason only a sample of seven individuals was considered. However, from a statistical point of view this sample is sufficiently large and varied from a typological point of view
The route has been divided into a series of sections, distinguishing between a straight segments, a roundabout and an intersection as shown in the figure 3. Many other traits have been analyzed along this route but they have not been included in this analysis for reasons of space.
In this work four different sites of the whole route were taken into consideration: two roundabout intersections (C-D) and two straights (A-B).
4. Driver behavior’s analysis
For the seven drivers and for each road section, the films were analyzed frame by frame. The number of frames, and therefore the time interval, in which the driver observed a different target was counted in each portion of the video relating to a part of the street.
The analyzed observation targets were divided into two categories: elements of attention and elements of distraction. The following table shows the observation targets divided into two categories and, in the same table, as an example, the result of the analysis of driving behavior during the journey of a road section are reported.
A
B
C
Target Numbers of frame Number of fixations Time [s] fixation time Average
[s] %
Car ahead 48 3 1.60 0.53 12.8%
Traffic signs - traffic lights Rearview mirror
Vehicle entering (in roundabout) 78 3 2.60 0.87 20.9%
Vehicle running along the roundabout 55 4 1.83 0.46 14.7%
Center of the roundabout Side vehicle Pedestrian 19 2 0.63 0.32 5.1% Cyclist Road 80 7 2.67 0.38 21.4% Advertising board Vehicle interior Parked cars Passers / pedestrians 36 1 1.20 1.20 9.6% Tree-houses-urban furniture 39 4 1.30 0.33 10.4% Vehicles in transit 19 1 0.63 0.63 5.1% Total 374 25 12.47 0.50 Attention elements 280 19 9.33 0.49 74.9% Distracting elements 94 6 3.13 0.52 25.1%
Tab. 1. Result of analysis of driving behavior
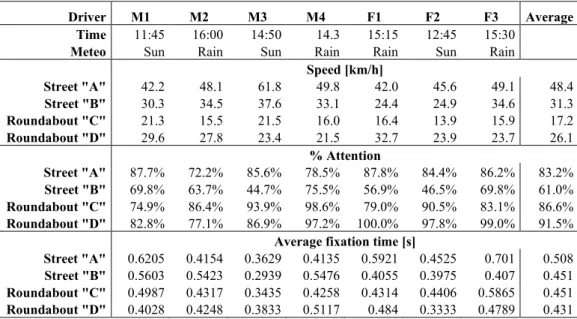
Starting from the analysis of the single road sections and for each individual driver, synthetic data have been collected and the behavior of the seven drivers have been analyzed in the four different sections. Drivers are indicated with M1 through M4 for men and F1 through F3 for women. The main parameters analyzed are attention / distraction to driving and average duration of fixations. Table 2 shows all the data collected.
The behaviors analyzed refer to contexts in urban areas in medium traffic conditions and show four different situations: straight-line travel at high speed (street "A"); straight subject to redevelopment with moderate travel speed (street "B"), complex double roundabout, ordinary roundabout.
Driver M1 M2 M3 M4 F1 F2 F3 Average
Time 11:45 16:00 14:50 14.3 15:15 12:45 15:30
Meteo Sun Rain Sun Rain Rain Sun Rain
Speed [km/h] Street "A" 42.2 48.1 61.8 49.8 42.0 45.6 49.1 48.4 Street "B" 30.3 34.5 37.6 33.1 24.4 24.9 34.6 31.3 Roundabout "C" 21.3 15.5 21.5 16.0 16.4 13.9 15.9 17.2 Roundabout "D" 29.6 27.8 23.4 21.5 32.7 23.9 23.7 26.1 % Attention Street "A" 87.7% 72.2% 85.6% 78.5% 87.8% 84.4% 86.2% 83.2% Street "B" 69.8% 63.7% 44.7% 75.5% 56.9% 46.5% 69.8% 61.0% Roundabout "C" 74.9% 86.4% 93.9% 98.6% 79.0% 90.5% 83.1% 86.6% Roundabout "D" 82.8% 77.1% 86.9% 97.2% 100.0% 97.8% 99.0% 91.5%
Average fixation time [s]
Street "A" 0.6205 0.4154 0.3629 0.4135 0.5921 0.4525 0.701 0.508 Street "B" 0.5603 0.5423 0.2939 0.5476 0.4055 0.3975 0.407 0.451 Roundabout "C" 0.4987 0.4317 0.3435 0.4258 0.4314 0.4406 0.5865 0.451 Roundabout "D" 0.4028 0.4248 0.3833 0.5117 0.484 0.3333 0.4789 0.431
The analyzes carried out show the variability of the three parameters considered between drivers and road section. For each parameter, one-way analysis of variance (ANOVA) was carried out, analyzing both the difference between driver and road. The significance parameter indicated by the ANOVA analysis is the alpha term which must be conventionally less than 0.05 (95% significance). In the following analyzes the alpha parameter is indicated briefly as an indicator of the significance of the analysis performed.
It clearly emerges that the context of the road has a significant influence on traveling speed and attention span (alpha <10-5) while it does not affect the duration of the observations (alpha = 0.478).
The different driver, on the other hand, does not affect either speed or attention. On the contrary, the variability of the duration of the fixations between the different drivers is significant, regardless of the context observed (alpha = 0.033).
5. Results
Given the previous considerations, the three parameters observed can be taken as indicators of different aspects of the driving behavior in urban areas. The speed is a characteristic parameter of the analyzed road section and it is independent by the driver. This parameter allows classifying the type of road in urban areas between low-speed and high-speed roads / intersections.
The second parameter examined is the percentage of time devoted to observing attention target. This parameter indicates the driver's comfort level, thus the longer the time spent observing the attention elements of the driving context the less safe and comfortable the road section is. This indicator can be taken into consideration as an indicator of the level of safety offered by the infrastructure: if a driver can dedicate time to observe targets different from those strictly necessary while driving, that means that the road offers a level of intrinsic safety that makes driving comfortable.
The last parameter analyzed is that of fixation duration. It has been observed that this parameter belongs to the individual driver and does not characterize the observed elements or is influenced by speed or the urban context.
Fig. 5. Analysis results
From a statistical point of view, the two-way ANOVA also confirmed what had already emerged from the one-way analysis of variance: speed is a significant parameter when the road section changes (alpha <10-8) but not from the driver (alpha = 0.257); the percentage of attention depends on the road section (alpha <10-4) but not on the driver (alfa = 0.567) and on the contrary the average time of fixing depends on the driver (alfa = 0.033) but not on the road (alpha = 0.312) .
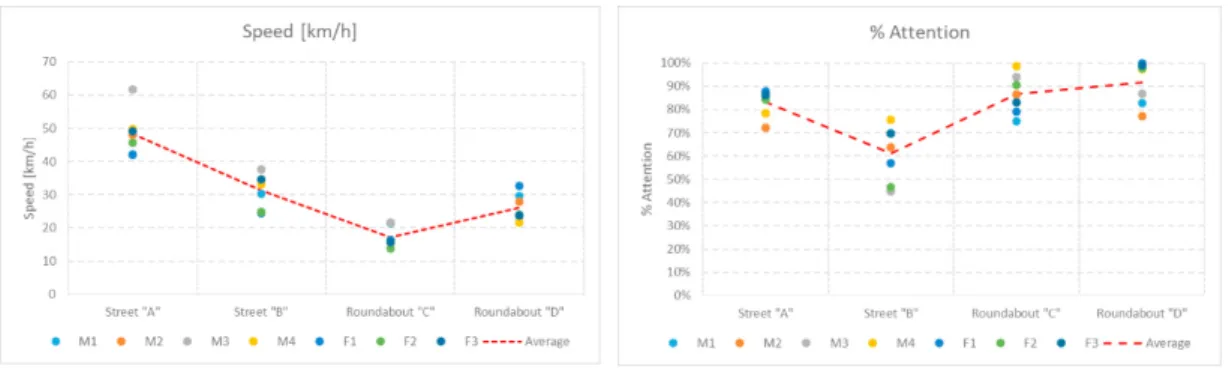
The main results that emerge can be summarized as follows: the two straight sections show a different structure that allows a higher travel speed (48 km/h) in case of "A" but requires more attention from the driver (83%) , while
on the contrary, in the "B" section the average speed of the journey is smaller (31 km/h) and for the driver a lower percentage of attention to driving (61%) is required to pass safely.
Fig. 6. Speed vs. % Attention
In the case of a roundabout intersection the traveling speed is lower (for "C" 17 km/h and for "D" 26 km/h), however in both cases the level of attention required is greater (86% and 91%). The crossing of a complex intersection such as case "C" limits the speed, leaving the level of attention required unchanged, indicating a good design of the infrastructure.
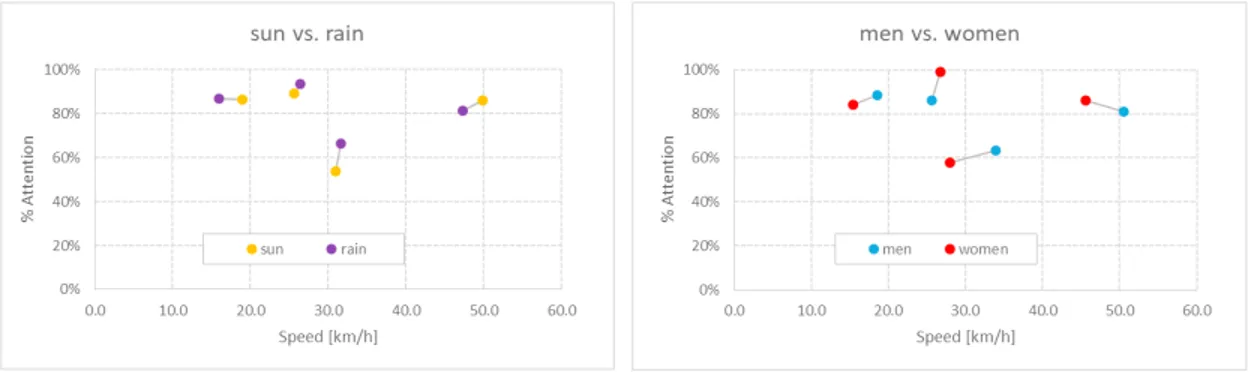
Fig. 7. Sun vs. Rain – Men vs. Women
A comparison analysis was also conducted between the weather conditions and the gender of the driver to highlight any significant difference. However, the driving conditions did not depend on these two parameters. Both the ANOVA and the student statistical test showed no significant differences.
6. Conclusive remarks
In this paper a methodology was presented to analyze the behavior of different subjects in different driving conditions. To analyze the level of attention, an eye tracker was used to monitor the attention target of those involved in driving. The analyses were conducted in real-life urban driving situations, both on straight segments and at roundabout intersections. The driving behavior of men and women was analysed, both in sunny and rainy weather conditions.
The analyzed parameters were the following: average speed of the analyzed section; percentage of observation time of target of attention to driving; average duration of fixations.
For the first two parameters it emerged that there is a significant dependence on the type of road section independently of the other parameters, while the average duration of the fixations is a characteristic of the subject driving and does not depend on the road type and speed.
There is no direct correlation between speed and degree of attention to driving but the urban context has a significant influence on both parameters.
In particular, it emerges how the level of attention can be used as a significant indicator of the level of safety offered by the road infrastructure. Traffic calming elements in fact positively influence the travel speed by reducing the level of danger of the guide and in parallel highlight a mental situation of greater comfort for the drivers, an intrinsic safety index of the infrastructure.
Further analyzes will also be conducted in the extra-urban area. In this paper only quantitative variables were considered and these were analyzed from a statistical point of view. However, it is also possible to carry out analyzes from the point of view of quantitative parameters. These activities have been conducted in extra-urban areas and will be the subject of further publications.
References
Hurtado. S., Chiasson S., An Eye-tracking Evaluation of Driver Distraction and Unfamiliar Road Signs, Proceedings of the 8th International Conference on Automotive User Interfaces and Interactive Vehicular Applications, pages 153-160, October 2016
Kapitaniak B., Walczak M., Kosobudzki M., Jóźwiak Z., Bortkiewicz A., Application of eye-tracking in drivers testing: a review of research, International Journal of Occupational Medicine and Environmental Health 2015;28(6):941-54
Kaminski T., Kruszewski M., Niezgoda M., Application of eyetracking research techniques into road safety studies – theoretical considerations, Journal of KONES Powertrain and Transport, Vol. 19, No. 4 2012
Glaser, S., Rakotonirainy, A., Gruyer, D., & Nouveliere, L.. An integrated driver-vehicle-environment (I-DVE) model to assess crash risks. In Proc. Australasian Road Safety Res., Policing Edu. Conf., Melbourne, Australia.
Falkmer, T., Dahlman, J., Dukic, T., Bj€allmark, A., & Larsson, M., Fixation identification in centroid versus start-point modes using eyetracking data. Perceptual and Motor Skills, 106(3), 710–724.
Sun, Q., Xia, J., Falkmer, T., & Lee, H. (2016). Investigating the spatial pattern of older drivers’ eye fixation behaviour and associations with their visual capacity. Journal of Eye Movement Research.
Rossetti S., Tiboni M., Vetturi D., Calderòn E.J., 2015. Pedestrian mobility and accessibility planning: some remarks towards the implementation of travel time maps. In CSE Journal, issue 1-2015.
Tira M., Rossetti S., Tiboni M., Managing Mobility to Save Energy through Parking Planning. In: Papa R., Fistola R. (eds) Smart Energy in the Smart City. Green Energy and Technology. Springer, Cham, 2016
Bertolini, L.,2012. Integrating Mobility and Urban Development Agendas: a Manifesto. DisP – The Planning Review, Routledge, 48:1, 16-26. Geurs K., Eck J., 2001. Accessibility measures: review and applications, RIVM Report for the Directorate-General for Environment Protection of
the Ministry of Housing, Spatial Planning and the Environment, Utrecht.
Handy S., 2002. Accessibility vs Mobility. Enhancing Strategies for Addressing Automobile Dependence in the U.S. Institute for Transportation Studies, UC Davies.
Marcuccia E., Gatta V., Le Pira M., Gamification design to foster stakeholder engagement and behavior change: An application to urban freight transport, Transportation Research Part A: Policy and Practice - Volume 118, December 2018, Pages 119-132
Le Pira M., Transport planning with stakeholders : An agent-based modelling approach, International Journal of Transport Economics - DOI: 10.19272/201806701002
Marcuccia E., Le Pira M., Gatta V., Inturri G., Ignaccolo M., Pluchino A., Simulating participatory urban freight transport policy-making: Accounting for heterogeneous stakeholders’ preferences and interaction effects, Transportation Research Part E: Logistics and Transportation Review - Volume 103, July 2017, Pages 69-86