University of Pisa
Research Doctorate School in Biological
and Molecular Sciences
Doctorarate Program: Biology
The DNA barcoding
in the ciliated protist Euplotes
Supervisor:
Student:
Dr. Ph.D. Graziano Di Giuseppe
Dr. Paola Ricciolini
Academic Year 2011/2012 BIO/05
- 1 -
1 ABSTRACT ... 4
2 INTRODUCTION ... 6
2.1 THE TAXONOMIC IMPEDIMENT ... 7
2.2 TOWARDS A SOLUTION: THE DNA BARCODING TOOL AND ITS POTENTIAL ... 9
2.2.1 THE DNA BARCODING TOOL AND ITS BROAD RANGE OF APPLICATIONS ... 12
2.2.2 THE UNIVERSAL DNA BARCODE: THE cox1 GENE ... 14
2.2.3 THE TWO CRITERIA FOR ASSIGNING A DNA SEQUENCE TO THE SPECIES LEVEL ... 16
2.2.4 THE DNA BARCODING: “PHILOSOPHICAL” AND TECHNICAL CONSIDERATIONS ... 19
2.2.5 THE DNA BARCODING: STATE OF THE ART ... 23
2.3 PROTISTS: GENERAL FEATURES ... 26
2.3.1 PROTISTS AND THEIR TANGLED TAXONOMY ... 28
2.4 CILIATED PROTIST: GENERAL FEATURES ... 30
2.4.1 THE CILIATED PROTIST GENUS Euplotes AND ITS TAXONOMIC IMPEDIMENT ... 31
3 AIM OF THIS WORK ... 34
4 MATERIALS AND METHODS ... 36
4.1 SOURCE OF SAMPLES AND CULTURE CONDITIONS ... 37
4.2 DNA EXTRACTION ... 44
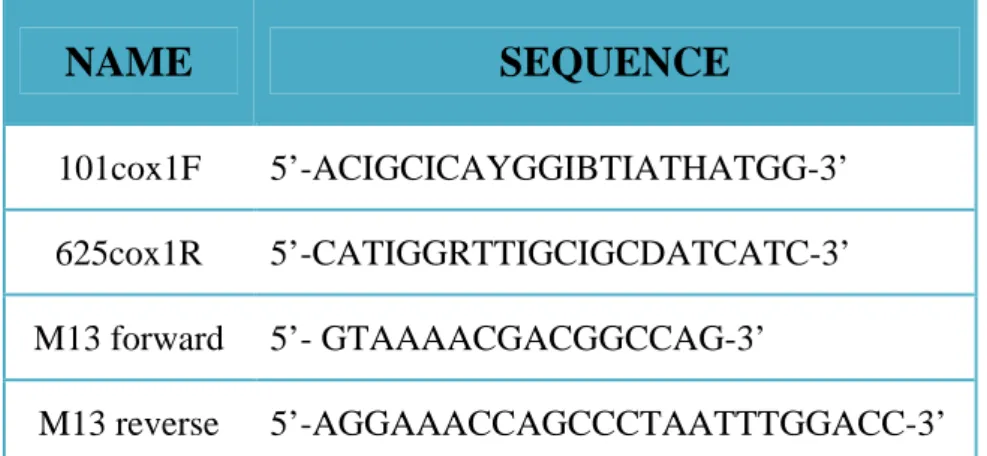
4.3 PRIMER DEVELOPMENT, PCR AMPLIFICATION, AND SEQUENCING ... 46
4.4 MULTIPLE SEQUENCE ALIGNMENT (ALN) ... 54
4.5 TESTING FOR MUTATIONAL SATURATION ... 55
4.6 PHYLOGENETIC ANALYSIS ... 56
- 2 -
5.1 SEQUENCES OBTAINED ... 59
5.2 NUCLEOTIDE COMPOSITION ... 63
5.3 MULTIPLE ALIGNMENT (ALN) ... 65
5.4 SEQUENCE ANALYSIS OF THE cox1 GENE ... 68
5.5 TESTING FOR MUTATIONAL SATURATION ... 74
5.5.1 LIKELIHOOD-MAPPING ANALYSIS ... 74
5.5.2 p-distance ANALYSIS ... 76
5.6 PHYLOGENETIC ANALYSIS ... 78
6 DISCUSSION ... 90
6.1 SEQUENCES ANALYSIS OF THE cox1 GENE ... 91
6.2 PHYLOGENETIC ANALYSIS ... 93
7 CONCLUSIONS ... 97
- 3 -
Questa Tesi di Dottorato
la dedico con tanta ammirazione
alla Dottoressa Silvia Frosini
e alle sue determinazione e forza di volontà.
- 4 -
- 5 -
Recent investigations have suggested the feasibility of establishing a species identification system reliant on the analysis of the sequence of the mitochondrial cytochrome c oxidase subunit 1 gene (cox1), the DNA barcoding tool. I assessed the effectiveness of this procedure in the most cosmopolitan, ubiquitous, and differentiated group of ciliated protists, the genus Euplotes. The availability of the largest collection of Euplotes living strains which currently exists worldwide, the result of half a century of sampling at all latitudes of the globe, allowed me to help create the basis for making this evaluation. Accordingly, I analyzed cox1 gene sequences from 81 strains belonging to 15 Euplotes species representatives of different habitats. All Euplotes strains analyzed were correctly partitioned into the 15 species, whose interspecific cox1 sequence divergence was about 60%, whereas the intraspecific sequence divergence ranged from 0.5% to 43%. Moreover, some species not only showed higher values of cox1 intraspecific divergence, but also their representative strains did not cluster together on the cox1 phylogenetic trees, suggesting the occurrence of cryptic species. Overall, my study demonstrates the feasibility of the DNA barcoding procedure to the genus Euplotes.
- 6 -
- 7 -
2.1
THE TAXONOMIC IMPEDIMENT
Biodiversity means the variety of life forms that inhabit the planet Earth. Biodiversity is our natural and, unfortunately, vulnerable resource. It is in our own interest to preserve this resource, in order to benefit from it. To be able to protect it, we must first know it. In fact, among the most urgent needs and ambitions of our society, there is to know in detail and catalog all the species of the planet Earth. This is necessary to various reasons. The first reason is because of our increasing interaction with the biodiversity that surrounds us. The most important reason is because we are facing the greatest loss of this biodiversity that has ever occurred. For this final reason the year 2010 was proclaimed by the United Nations (UN) Year of Biodiversity. We need to protect endagered species, to ensure bio-security avoiding pandemics, and to manage the natural world. The first premise of all biological researches is the correct species identification. In particular, over the past 15 years, the need to study more thoroughly the variety of life forms of microorganisms has been felt. This is due because the biological diversity of microorganisms represents the majority of biodiversity on our planet. Until a few years ago, it was not possible to study the biodiversity of microorganisms, because of the lack of methodologies to do so. The advent of modern molecular biology techniques, especially the Polymerase Chain Reaction (PCR), has overcome this obstacle. In recent years, in fact, numerous studies have been conducted on the biological diversity of microorganisms. These studies have increased the interest in biodiversity of eukaryotic microorganisms. The interest of the scientific community in the biological diversity of eukaryotic microorganisms is due to various reasons. The first reason is that they play a leading role in the biogeochemical cycles of the Earth. The second reason is that they are utilized in the research for new bioactive molecules for different purposes [1-3].
To complete this inventory of life is a gargantuan enterprise, because of the huge number of species on the Earth. To accomplish this purpose, our society needs an accurate diagnostic tool which is faster and cheaper to study our biodiversity on a large scale, in all the present environments, and possibly retrieve some information about the past and make prediction about the future. Unfortunately, we still lack this tool. It is clear that Taxonomy and Systematic, the biological disciplines that are devoted to characterizing the diversity of life and organizing our knowledge about this diversity, play a practical role in directing the preservation and development of natural systems [4]. Carl Nilsson Linnaeus (1707-1778), known to most simply as Linneo, is
- 8 -
considered the father of modern scientific classification of living organisms thanks to the introduction of binomial nomenclature. Unfortunately, during the last 250 years, we have described only a small fraction, about 1.7 million species, of the estimated biodiversity, 10-100 million species [5, 6].
The morphological species concept is the most broadly used in eukaryotic organisms. Consequently, the actual identification system of species is based primarily on the morphological approach based on morphological features or “keys”: shape, size, colour of body parts, etc… It has served us well for a little over three centuries, but is characterized by severe limitations, making it inadequate for current needs. Therefore we speak of “taxonomic impediment” (i.e., the worldwide shortage of taxonomists and their declining rate of replacement) that inhibits biodiversity research [7, 8]. Almost no taxonomic research projects are still funded. Moreover, scientific journals are becoming less interested in publishing articles in this field. Hebert and collaborators (2003) [9] discussed the limitations inherent to the morphology-based taxonomic approach summarizing them in four main points. (I) This method is particularly difficult, requires expert skills and proceeds too slowly. (II) Morphological keys that enable identification are not always present in all file stages or gender and they are not always sufficient to determine species boundaries. For example, in Diptera the species identification is mainly based on male genitalia. (III) Phenotypic plasticity greatly complicates the analyses. (IV) This approach also overlooks the morphologically cryptic taxa, which are common in many groups. Taken all together these features can lead to incorrect identifications and so misdiagnoses are common. Furthermore, if nothing is done to change the slow pace of current taxonomic efforts and practice, it will take centuries to complete even a preliminary “Encyclopaedia of life” on Earth [10]. For example, regarding unicellular eukaryotic microorganisms (protists), the relationship between morphology and species boundaries is not well understood. Furthermore, many protistan species are morphologically indistinguishable. Consequently, we speak of “cryptic diversity” (i.e. biodiversity that is not reflected in morphological features).
- 9 -
2.2
TOWARDS A SOLUTION: THE DNA BARCODING TOOL AND ITS
POTENTIAL
Tautz and collaborators (2003) [11] explored the possibility of overcoming the problems reliant on the morphology-based identification system by creating an identification system for all living organisms based on short DNA sequences, a so “DNA-based taxonomy” system. This is not new in essence; in fact there is a long history of using molecular markers: allozymes, and both nuclear and mitochondrial genes for species identification. Ribosomal DNA (rDNA) coding for ribosomal RNA (rRNA) is present in all eukaryotic cells. For this reason, nuclear ribosomal genes such as the 18S ribosomal RNA (18S rRNA) gene and ITS (Internal Transcribed Spacer) region are broadly used in phylogeny. Especially as regards the 18S gene, there is a wide literature of inferring phylogenetic relationships from this gene, mostly in animals, but also in unicellular eukaryotic microorganisms, the protist. It owes its success as a phylogenetic marker to the fact that it codes for a basic component of all eukaryotic cells, and its flanking regions allow the designing of universal PCR primers. However, after initial enthusiasm, there were also some limitations inherent in the use of the 18S gene. Mitochondrial genes coding for rRNA 12S and 16S were used too, but the prevalence of insertions and deletions greatly complicate sequence alignments. So there is nothing fundamentally new in the “DNA-based taxonomy” concept. However, all current taxonomic approaches intend to use DNA, at best, as an auxiliary criterion for identifying a species or a taxon, but have not given it a central role. The proposal of Tautz and collaborators (2003) [11] is innovative because they thought of a DNA-based identification system which is “the central pillar of taxonomy, whilst maintaining the importance of morphological criterion”.
“DNA barcodes” is an old term found for the first time in literature in 1993 [12], in a paper that has gone unnoticed. Hebert and collaborators rediscovered the DNA barcoding concepts in a paper published in 2003 [9]. The DNA barcoding is a molecular method that uses a short genetic marker (i.e. DNA barcode) in an organism's DNA to identify it as belonging to a particular species. In a very real sense, these sequences can be viewed as “genetic barcodes” that are embedded in every cells and were similar to the way a supermarket scanner distinguishes products using the black stripes of the Universal Product Code. The underlying assumption is that the genetic variation between species exceeds that within species. The Authors clearly highlighted the power of this approach to species identification when phenotypic plasticity is a concern, morphology keys are not
- 10 -
available or unknown, and cryptic species. The other main purpose of this approach is to discover new species [13].
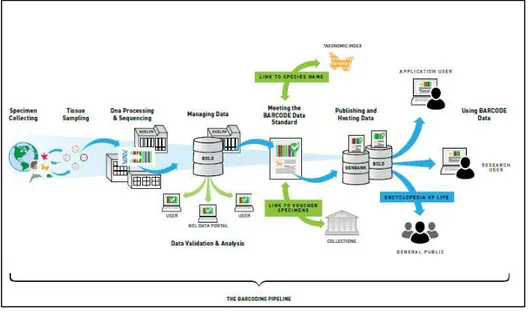
What makes the DNA barcoding technique conceived by Hebert and collaborators [9, 13] an innovative tool is the idea to radically replace classical taxonomy with this new approach, and the large scale of its technological and social ambitions. Technological, in the sense that the method uses the same standard and inexpensive experimental pipeline, the same DNA barcode, and the same criteria to mark species boundaries (Fig. 1). Social, in the sense that the DNA barcoding tool is born to be easily used by all, not only by experts, and in the desire to make the data accessible to all. In fact, the DNA barcoding is not only a new tool to identify species, but it is an ambitious international project too: the international Barcode Of Life project (iBOL, http://www.ibol.org), the largest biodiversity genomics initiative ever undertaken. The Barcode of Life Data Systems (BOLD) is a computerized workbench for the acquisition, storage, analysis and publication of the DNA barcoding records. This database was created and is maintained by the University of Guelph in Ontario. This database is public and freely available to anyone interested in DNA barcoding. Via the World Wide Web, scientists and the general public have direct access to all life form information, not only the barcode sequences: images, biology, and conservation status (Fig. 1). This allows to greatly speed up communication, making species diagnoses and new descriptions more accessible [14, 15]. The Consortium for the Barcode Of Life (CBOL, http://barcoding.si.edu)is an international project aimed to promote and coordinate the DNA barcoding research in over fifty countries by promoting workshops, conferences, training and more. The CBOL was established in 2004 and its main proposal is the rapid and inexpensive identification of the estimated 10 million species on Earth.
- 11 -
Fig. 1. The standard DNA barcoding pipeline has four components (http://www.ibol.org). (I) The first step is the collection of the specimen belonging to an unknown species. Specimens may have come from various sites: sampling, museums, collections, herbaria, zoos, aquaria, and other repositories of biological materials. (II) The second step is the laboratory analysis, in order to obtain the DNA barcode sequence. (III) Analysis of the barcode sequence allows the specimen species identification. (IV) The last step is the sharing of the data by submitting them in the on-line BOLD database.
- 12 -
2.2.1 THE DNA BARCODING TOOL AND ITS BROAD RANGE OF APPLICATIONS
The DNA barcoding tool has a wide range of applications, not only in Taxonomy and Systematic.
Ecologists in particular are great supporters of the DNA barcoding tool [16, 17]. Ecologists will be able to not only identify a single species from a specimen or an organism’s remains, but also determine the species composition of environmental samples. Several taxa have now been surveyed in their natural habitats using this technique; short DNA fragments persist in the environment and might allow an assessment of local biodiversity from soil or water [18-22]. This is especially important to study the biodiversity of microorganisms. In fact, until now the major limitation in their studying was the fact that not all microorganisms can be cultivated in the laboratory. In the rainforests, rapid DNA-based entomological inventories have been efficiently performed [16, 23-25]. In forensic sciences, the DNA barcoding can help in solving crime investigations by determining the time of death by inferring the life stage of the insect larvae within the dead body [26]. It can be used for understanding interspecies interactions, for example the DNA barcoding approach has already shown that the existence of cryptic species could mask the specialization of a parasite to a single host [27, 28].
Furthermore, the DNA barcoding can be advantageous for monitoring illegal trade in animal products: food, luxury accessories, and clothes [29-31]. In Africa, many species of mammals, especially primates, are threatened by illegal trade in bush meat. The DNA barcoding in such cases could be usefully employed to rapidly identify to which organism the minced or smoked meat belongs. It would not be identifiable in any other way. The DNA barcoding can provide useful information for governments about population sizes in order to manage and monitor natural ecosystems. Such an approach is now widely used, and is particularly useful for detecting the presence of elusive or endangered species [17]. For example, it is already being used to combat illegal hunting of cetaceans [32].
Moreover, DNA barcoding tool can be used in the field of biosecurity. For example, it can be used in the identification and surveillance of exotic species and for surveillance of disease vectors, such as invasive insects [33, 34]. Particularly, in insects, a pest at the egg or larval stage
- 13 -
might not be recognizable without DNA identification [22]. Every year millions of dollars are thrown away because of agricultural pests. It can also be usefully employed to monitor water quality. In addition, ecologists can take advantage of DNA tools when only hair, feces or urine left behind by animals are available for species identification. Even DNA-based diet composition can be estimated using faecal samples [17].
The DNA barcoding can also enhances discovery of new species [13]. Using high-throughput methods developed for genomic studies, potentially hundreds of new species could be discovered weekly from environmental samples, especially from the depths of the oceans.
Concluding, the DNA barcoding is potentially a simple, fast and effective investigative tool, and accordingly appears to be particularly interesting for those who work with the least morphologically tractable groups, that are protists [35, 36].
- 14 -
2.2.2 THE UNIVERSAL DNA BARCODE: THE cox1 GENE
In the previous paragraph I discussed the potential of the DNA barcoding tool as a universal standard method. This implies the use of the same “DNA barcode” for the identification of all animal species on the Earth. The DNA barcode is a unique segment of DNA that can identify an organism, or part of an organism. Hebert and collaborators (2003) [9] first established the utility of a ~ 650 base pair (bp) fragment of the mitochondrial cytochrome c oxidase subunit 1 (cox1) gene as universal marker (or DNA barcode) for global biological identification of animal species (Fig. 2).
The DNA barcode itself consists of a 648 bp region comprised between 58–705 bp from the 5’-end of the cox1 gene using the mouse mitochondrial genome as a reference.
The steps that led to this decision are described below. Mitochondria are characteristic organelles of eukaryotic cells. They are deputies to the production of energy in the form of ATP. They have their own genome (mtDNA), which is contained in multiple copies within the mitochondria. The mtDNA has been used extensively in the last years for inferring the genetic structure of a population. Furthermore, in recent years it has also been used for inferring phylogenetic studies. The pilot researches about mtDNA variation focused on the restriction
- 15 -
fragment length polymorphisms (RFLP) [37-39]. These researches marked the advent of the mtDNA as a molecular evolution study tool. The general features of mitochondria have been studied deeper in higher metazoa. However, animal mtDNA is now considered more variable in size and gene organization than was previously thought. Normally, it is a circular molecule, containing both coding and transcribed genes in various kinds of RNA, such as tRNA and rRNA. There are also exceptions. For example, in the ciliated protists Euplotes crassus and Euplotes minuta, and in some algae, their mitochondrial genomes are linear [40]. From the beginning, the research for the universal barcode has focused on the mitochondrial genome, because as compared to the nuclear one (nuDNA), it has features that have attracted researchers. (I) Higher rate of DNA evolution because of frequent replications, and absence of both histones and repairing mechanisms. (II) Limited exposure to recombination due to its maternal mode of inheritance. That is important because most methods of phylogenetic reconstruction assume no recombination. (III) Lack of introns, which greatly complicate sequence alignments across phyla. (IV) As it is present in higher copies number per cells allows for greater efficiency of DNA extraction [41].
Hebert and collaborators (2003) [9] justify the choice of a mitochondrial protein-coding gene because its third position nucleotides show a high incidence of base substitutions, leading to a rate of molecular evolution that is about three times greater than that of other mitochondrial non-coding genes, such as the 12S or the 16S rRNA genes [42]. Moreover, the utility of these genes in the phylogeny is curtailed by the presence of insertions and deletions, which greatly complicate sequence alignments [43]. There are 13 protein-coding genes in the animal mitochondrion genome, but Hebert and collaborators (2003) [9] point to two advantages of the cox1 gene: (I) the universality of existing primers for amplification of the 5’ end of this gene in a wide variety of animals [44, 45], and (II) the broad phylogenetic range covered by this gene. In fact, these Authors argued that the evolution of the cox1 gene is rapid enough to allow the discrimination of not only closely allied species, but also phylogeographic groups within a single species [46, 47]. Although the cox1 gene may be matched by other mitochondrial genes in resolving such cases of recent divergence, this gene is more likely to provide deeper phylogenetic insights than alternatives such as cytochrome bgene[48].
- 16 -
2.2.3 THE TWO CRITERIA FOR ASSIGNING A DNA SEQUENCE TO THE SPECIES LEVEL
The first criterion for assigning a DNA sequence to the species level is based on the monophyletic species concept. Sequences for the same species are considered to be correctly identified as long as they form a monophyletic cluster on a phylogenetic tree (Fig. 3). The DNA barcoding research only used the cox1 gene and analyzed data by only Neighbor-Joining (NJ) [49] phylogenetic inference, using the Kimura 2 Parameter (K2P) distance model of sequence evolution [50].
The second criterion is based on a threshold (Fig. 4). This threshold is set to differentiate between intraspecific and interspecific cox1 nucleotide sequence variation, the “DNA barcoding gap”. Because patterns of intraspecific and interspecific cox1 sequence variation appear similar in various animal groups, Hebert and collaborators (2004) [13] proposed a universal threshold to mark the boundaries between species: ten times the mean intraspecific variation for the group under study. If two sequences differ from each other by a value under ten times the mean intraspecific cox1 sequence variation, they are recognized as belonging to the same species. Otherwise, they are recognized as belonging to two different species.
The first papers published on DNA barcoding followed these guidelines for data analysis. However, the articles published later do not necessarily use the algorithm NJ. In fact, the Maximum Likelihood (ML) method and the Bayesian Inference (BI) are becoming increasingly used. Furthermore, not all researchers applied the threshold method. This is mainly due to the lack of possibility to establish a well-defined threshold to mark the boundaries between species.
- 17 -
Fig. 3. (A) Monophyletic group is a taxon which forms a clade on a phylogenetic tree. A clade is a group consisting of a species and all its descendant forming a single branch in phylogenetic trees. (B) Paraphyletic group includes the most recent common ancestor, but not all of its descendents. (C) Polyphyletic taxon does not include the common ancestor.
- 18 -
Fig. 4. (A) Intraspecific and interspecific cox1 gene nucleotide sequence divergence values do not overlap. Consequently, the species can be distinguished on the basis of the threshold method. (B) Intraspecific and interspecific
cox1 gene nucleotide sequence divergence values overlap. Consequently, the species cannot be distinguished on the
- 19 -
2.2.4 THE DNA BARCODING: “PHILOSOPHICAL” AND TECHNICAL
CONSIDERATIONS
The use of the DNA barcoding technique remains among the most contentious and many Authors have clearly expressed their concerns. Concerns range from the “philosophical” to the technical. Only mentioning the possibility to radically replace the traditional morphology-based taxonomic approach with the DNA-based taxonomy based on a single mitochondrial gene and on a universal threshold has generated lively debates. The taxonomists feel pushed aside and insulted by this new technology and have renamed it with colorful nicknames: the new Tower of Babel, a serious moving backwards for Science, a caricature of the real Taxonomy, and a sterile intellectual landscape [51-56]. These Authors discussed the fact that often, in literature the DNA barcoding didn’t work well and/or revealed unexpected diversity or discordance with morphology. It is true that the DNA barcoding is limited to matching DNA sequences to known species, the latter being delimited with traditional (e.g. morphological) methodologies. The role of barcodes is merely to provide a tool to assign unidentified specimens to already characterized species. The DNA barcoding is based on knowledge of Taxonomy, and cannot function without that knowledge: if species are not well defined and thoroughly sampled, the DNA barcoding is not applicable. For those groups where barcoding would be useful, the vast majority of the taxonomic work is already done, so the role of this tool is merely to give a confirmation of taxonomic work. This is true, but it helps in finding cryptic species, which are not detected by the classical approach. These Authors argued that the DNA barcoding will not help with the ‘‘taxonomic impediment’’, that can only be solved through an understanding of complex species definitions and effective and accurate biodiversity assessments. Moreover, they highlighted that in some cases the DNA barcoding also fails to distinguish between members of closely related species groups and morphologically highly similar species [57], two instances for which the DNA identifications should have had the most value. The following is an impartial discussion of the reasons why many Authors consider mtDNA divergence neither necessary nor sufficient as a criterion for delineating species boundaries.
The very first point of objection to this methodology is the assumption that one single mitochondrial gene sequence should be the primary identifier for species. In fact, many Authors agree that it must be considered in conjunction with other sources of data such as nuclears genes, morphology, and ecology [58]. First, not all organisms are equipped with mitochondria, and
- 20 -
therefore in these cases this practice cannot be applied. Rates of evolution for the same gene in different taxonomic groups may vary, making the use of any single gene problematic as “the gold standard” for molecular taxonomy across very broad phylogenetic boundaries. A combination of genes may prove useful for supporting a purely molecular taxonomy. Concerns have been expressed regarding horizontal transfers of mitochondria between divergent lineages [53]. Those transfers can occur between closely related species too, and could result in wrong diagnoses [13, 59, 60]. An additional problem with focusing on a single DNA sequence as a primary criterion for recognizing species, is that it will lead us to overlook new or rapidly diverged species [61]. For some time after the initial split, new sister species will share alleles, either because of ongoing gene flow, or because of recent ancestry. In such cases, sequences from one or few individuals will not be sufficient for an unequivocal assignment to a particular group. Yet, it is not true that mitochondrial recombination does not occur; in fact recent investigations have found significant evidence of mitochondrial recombination in various animal groups [62-64]. The recombination can affect the NJ analysis. Moreover, in mitochondria the mutation rate of a gene is a function of its physical location in the genome [41, 65]. Thus, variations in genome arrangement will affect the mutation rate of the cox1 gene, and so, the analysis. We also must consider that the substitution patterns are not constant along the length of the gene [66, 67]. Moreover, significant levels of heteroplasmy (carrying more than one mtDNA haplotype) have been reported in various animal groups [68-74]. One single different nucleotide could alter the results. Nuclear pseudogenes could be amplified by PCR instead of the real mitochondrial gene [75]. However, BOLD provides quality controls in order to reveal the presence of pseudogenes within the dataset. In addition, criticism also applies to the choice of the cox1 gene as universal barcode, because of its limited information content at deeper phylogenetic levels [76, 77]. Only two studies deal with the problem of the choice of the region of the cox1 gene to be analyzed [67, 78]. In particular, Roe and Sperling (2007) [67] emphasized that the choice of amplifying the ~ 650 bp cox1 gene fragment to the 5’ end, was merely based on the availability of the metazoan universal PCR primers of Folmer [44]. This theoretical decision is lacking any biological issue, and in the end no one used these primers, because in reality they are not universal. Consequently, researchers had to design taxon-specific primers. Accordingly, Roe and Sperling (2007) suggested to extending the analysis to a longer portion of the gene. In fact, these Authors, despite the claim of Hebert and Gregory [79] according to which “DNA barcoding is not intended to reconstruct phylogenetic relationships, but instead focus explicitly on species delimitation and diagnostics”, are worried about heterogeneous substitutions patterns along the gene, and because the
- 21 -
problem of DNA saturation. The DNA saturation is the lost of DNA information for phylogenetic purpose, due to multiple hints occurring in the same positions. Roe and Sperling (2007) concluded that the best choice, in order to reflect broader patterns of nucleotide divergence and minimize nucleotide saturation, is maximizing the analyzed sequence length. Regarding this issue, Erpenbeck and collaborators (2005) [78] demonstrated that using the 3’ portion of the cox1 gene as “gold fragment” for DNA barcoding in corals, allows species identification. Otherwise its resolution is limited to genus level. Therefore, many Authors agree that a multi-markers approach, based on both nuclear and mitochondrial genes, is the best choice in order to infer the best phylogeny. Bittner and collaborators (2010) [80] argued that such multi-markers DNA barcoding is the same of a metagenomic approach, a powerful tool to study biodiversity on large scale and on environments. The choice about the number and identity of genes necessary for sufficient resolution may be different for different clades. Furthermore, also Rubinoff and collaborators (2006) [81] stated that “good phylogenetic are absolutely essentials”.
Another line of criticism concerns how the data are analyzed. Here, again, is the problem of inferring phylogenetic trees from one single gene. It is well documented, in fact, that multiple dataset allow clearest definition of phylogenetic relationships among taxa [82-84]. Hebert and collaborators (2003) [9] proposed the use of the K2P distance model of sequence evolution and NJ phylogenetic inference. Srivathsan and Meier (2011) [85] defined as inappropriate the use of the K2P model in the DNA barcoding literature. The NJ analysis is the simplest and faster one, but reliable estimates of pairwise distances can be hard to obtain for divergent sequences [86]. Therefore, some Authors are suspicious of this type of phylogenetic reconstructions [54], suggesting other methods for inferring phylogenetic trees, such as Maximum Parsimony (MP), Bayesian Inference (BI), and Maximum Likelihood (ML) [87]. However, other Authors did not show any difference in accuracy between the NJ, MP and ML analysis of DNA barcoding of tropical butterflies [88]. Some Authors also highlighted that the threshold method lacks any biological and especially taxonomic justification. Moreover, it did not work well because there was a broad overlap of interspecific and intraspecific distances [81]. The accuracy of the DNA barcoding tool in identifying species depends on the breadth of the DNA barcoding gap, and the more overlap there is between the interspecific and the intraspecific genetic variation, the less effective the tool becomes, and then there is the need to establish a case-specific threshold [87]. Some Authors are also worried about the under sampling, both in numerical terms and in terms of
- 22 -
too geographically restricted sampling [89]. The accuracy of the threshold methods depends upon sampling multiple specimens from across the known geographic range of the species.
- 23 -
2.2.5 THE DNA BARCODING: STATE OF THE ART
Despite all the skepticism, so far the cox1 gene has been proved to be suitable for the identification of a large range of animal taxa, and the number of the DNA barcoding projects is growing up. Moreover, it has revealed the presence of a large cryptic or pseudocryptic diversity [13, 90, 91]. It follows that the cox1 gene seems to be the ideal candidate for use as the universal marker or barcode in the animal organisms, with the exception of the Cnidaria phylum. This is because the rates of mitochondrial evolution are exceptionally low in these organisms, and therefore they don’t enable species discrimination [92, 93]. The DNA barcoding worked well especially in higher metazoa: ants [24], birds [13, 94], bryozoans [95], butterflies [9, 57], crustacea [96], fish [21], gastropods [97], millipedes [98], nematodes [99], primates [100], and spiders [101]. In bryozoans, the DNA barcoding technique performed great in discriminate species. Moreover, it revealed a high degree of cryptic diversity [95]. Also Spelda and collaborators (2011) [98] explained the high intraspecific cox1 variation in some millipedes genera with the occurrence of cryptic lineages. Nijman and Aliabadian (2008)stated that the use of mitochondrial markers in studying humans and primates evolutionary biology is gaining importance. They also demonstrated that the cox1 gene allowed a clearer separation between species than the mitochondrial 16S and cytochrome b genes [100].
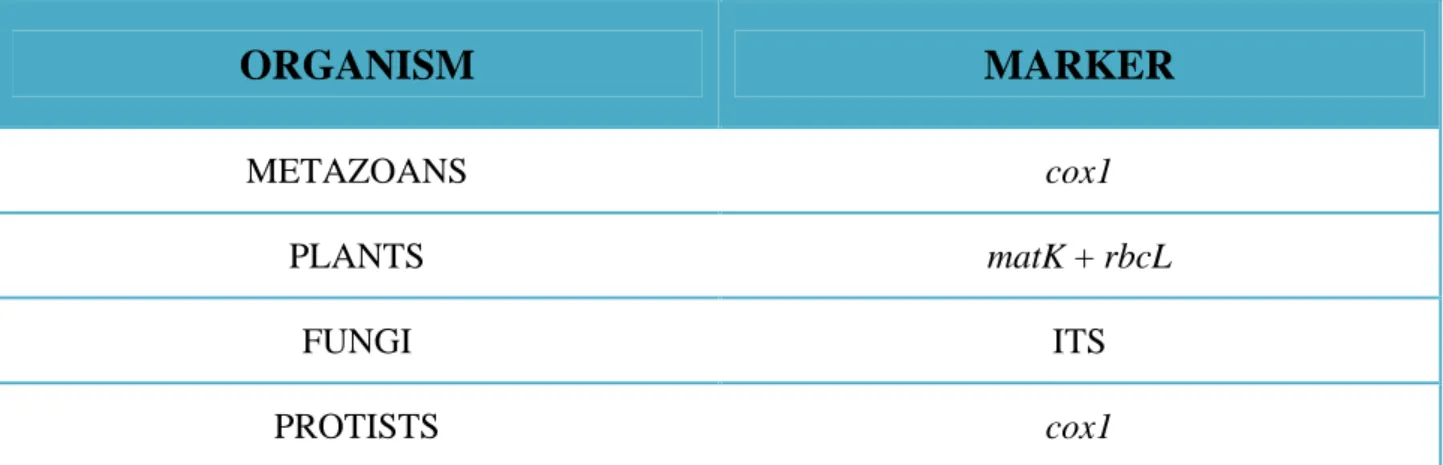
However, it is very important to point out that the cox1 gene is the selected barcode for the animal organisms. Outside those ones, it has not yet exhaustively tested if the cox1 gene will function for species discrimination. In the other living organisms the mode of inheritance, rate of divergence, and both mitochondrial genome and cox1 gene are poorly known. In any case, regarding land plants, it was well established that mitochondrial genes are generally more slowly evolving than those in animals [102]. The cox1 gene was useful only in some macroalgae [103-105]. Consequently, researchers explored other barcode in land plants. Some Authors proposed the use of a multi-markers approach [106, 107]. Plastid markers such as the megakaryocyte-associated tyrosine kinase (matk) and the ribulose bisophosphate carboxylase (rbcL) genes, were proposed as genetic barcodes for this multi-markers approach in land plants [108]. This approach has also received considerable interest from mycologists [109]. In fungi, there was a big debate about who is the ideal barcode. The cox1 gene has been proved to be suitable for the identification of fungi, suggesting that the feasibility to extend this approach to fungi is high [110]. However, other
- 24 -
Authors stated to focus the analysis on another barcode, the nuclear ribosomal ITS region [111] (Table 1).
As regards protists, the DNA barcoding worked really well in discriminate between species. However, it is only limited by the lack of the possibility to use universal primers. The primers of Folmer worked only in the study of Nassonova and collaborators (2010) [112], on naked lobose amoebae. In the other studies it was necessary to design sets of specific primers for the different groups. However, so far the DNA barcoding tool was tested only in few groups of protists: amoebae [91, 112, 113], blastocystis [114], diatoms [115-119], dinoflagellates [120-122], and the ciliated protists of the genera Paramecium [123] and Tetrahymena [124, 125]. In six amoebae morphospecies, Nassonova and collaborators 2010 [112] showed that the cox1 gene resolved inter-species relationships better than any other gene. However, the intraspecific and interspecific values didn’t allow establishing a clearly defined threshold. Heger and collaborators (2010) [113] and Kosakyan and collaborators (2011) [91] applied the cox1 gene in identify nebelid testate amoebae. The cox1 gene not only correctly separated all the studied morphospecies, but also revealed a large number of cryptic species. Regarding blastocystis, Scicluna and collaborators (2006) [114] developed the DNA barcoding identification system in these parasite, but they used the nuclear ribosomal ITS region as barcode. Also Moniz and Kaczmarska (2009) successfully utilized the nuclear ribosomal ITS region to discriminate diatoms species [118]. Evans and collaborators (2007) gave the first evidence of the applicability of the cox1 gene in discriminate diatoms species [115]. Hamsher and collaborators (2011) [119] proposed an alternative DNA barcode for diatoms species identification, the large subunit of rubisco (rbcL-3P). Stern and collaborators (2010) [122]used the cox1 gene as barcode for a large-scale environmental study on dinoflagellates, revealing a higher diversity in that microorganisms than expected. In dinoflagellates, Lin and collaborators (2009) [120] showed that a 385 bp of the cytochrome b (cob) gene had a more powerful resolution than cox1. In Paramecium, Barth and collaborators (2006) [123] showed that the cox1 gene revealed higher intraspecific variability than the nuclear 18S gene and the ITS region. In Tetrahymena, Chantangsi and collaborators (2007) [126] clearly highlighted the feasibility of establishing a Tetrahymena species identification system reliant on the analysis of the sequence of the cox1 gene (Table 2).
- 25 -
Table 1. Different marker (or barcode) for different organisms.
ORGANISM
MARKER
METAZOANS cox1
PLANTS matK + rbcL
FUNGI ITS
PROTISTS cox1
Table 2. Examples of cox1 successes. The table also highlights the method used to establish the efficacy of the
cox1 gene.
ORGANISM
METHODS
COMMENTS
AMOEBAE ML; BI Found cryptic diversity.
Lack of a clearly defined barcoding gap. NORTH AMERICA
BIRDS NJ; threshold
Paramecium NJ
Tetrahymena NJ; threshold Found cryptic diversity. TROPICAL
- 26 -
2.3
PROTISTS: GENERAL FEATURES
Protists are unicellular eukaryotic microorganisms with sizes ranging from 2 to 2000 µm. In some cases they form multicellular colonies, without specialized tissues. They are lively and fascinating organisms, showing a gargantuan variety for all they feature: size, shape, symmetries, morphology, habitat, behaviour, biochemistry, physiology, metabolism, reproduction, locomotion, and lifestyle. Above all, they are incredibly rich in species. To date more than 200000 species of protists have been described [127]. Accordingly, the phylogenetic breadth of protists far exceeds that of the multicellular organisms, and this is the problem in studying them [128-132].
Protists play a significant role in ecology, health, and biotechnology [127]. Consequently, they also have a significant role in economy. They are major constituents of benthic and planktonic communities, occurring in terrestrial, marine and freshwater environments worldwide. They play a key role in the functioning of many ecosystems. They are used as bioindicators of water quality and past climates. Protists can be both free-living and symbiotic. Free-living protists can be photosynthetic or heterotrophic. Photosynthetic protists are primary producers in many trophic chains. Protists are the protagonist of essential microbial loops, affecting the health and survival of higher animals, humans included. For example, they are the basis of the ecosystem of coral reefs. Non-photosynthetic (or heterotrophic) protists are the protagonist of all nutrient cycling. Protists establish several symbiotic relationships, with a wide range of hosts, and some species are parasitic. Symbiotic species protists are 15% of all estimated number of protists species, and occur within several protistan groups. Some protists are invasive species responsible of significant loss of biodiversity. Every year hundreds of millions of dollars are thrown away due to huge losses in farm production. Also fishes and fungi are decimated every year by parasitic protists. On the opposite side, helpful symbiotic protists actively control bacteria overgrowth in nature. Some symbiotic protists ensure the health of their hosts (humans included), because they live in their digestive tracts.
Protists play an important role in health because they are pathogens of humans too. They are pathogens of diseases with the highest mortality rates in the world, for example malaria (Plasmodium). Other examples of serious human diseases caused by protists are toxoplasmosis (Toxoplasma) and leishmaniasis (Leishmania).
- 27 -
Protist involments in food, medical, and industrial products are many. Cervia and collaborators (2006, 2007) [1, 2]demonstrated that the ciliated protozoan Euplotes crassus produce a secondary metabolite, “euplotin C”, that has a cytotoxic and pro-apoptotic action in tumor cell lines. These studies suggested the feasibility of production of new antitumor drugs from this ciliated protozoan. Fossil protists (foraminiferans) are used to determine the ages of lands to find petroleum.
Most important, protists have a great evolutionary importance. In fact, they are the first eukaryotic organisms that appeared on the Earth about two billion years ago. They are the protagonists of the biggest evolutionary step in the life story, the transition from prokaryotic cell organization to that eukaryotic, from which pluricellular organisms evolved.
The major aspects of protist biology are poorly understood and consequently contentious, for example their biodiversity and geographical distributions. The biodiversity of protists in nature is the most underestimated. The diversity of protists will be described in a comprehensive way when all geographic locations will have been sampled. The biogeography of protist is another hard issue. It is a very actual subject in scientific literature and conferences [133]. It is also a subject of debate. Some scientists argued that protists have a defined and limited geographic dispersal (endemic hypothesis) [134], while other Authors stated that protists have a global dispersion (cosmopolitan hypothesis) [135]. It is difficult to know the biogeography of protists, as not all regions have been sampled and most regions and habitats are insufficiently sampled. Furthermore, this difficulty is also due to the fact that the taxonomic resolution at the species level in protists is still unclear. Thus the rate of discovery of new species from environmental samples remains high. Indeed, most soil, freshwater, or marine samples collected contain a multitude of undescribed species [127, 136-138]. Furthermore, a methodology for studying protists on a large scale in their natural environment is still lacking [132].
- 28 -
2.3.1 PROTISTS AND THEIR TANGLED TAXONOMY
Protists, despite their importance, remain in the shadows of Science and Education. In accordance with Adl and collaborators(2005), this is due to the difficulty of classifying them and identifying them. The oldest classification scheme is that of Büschli (1880–1889), which divided Protozoa into Sarcodina (amoeboid organisms), Sporozoa (a parasitic group), Mastigophora (flagellated species), and Infusoria (ciliates). This classification system is based purely on morphology. It was abandoned decades ago by protistologists, but it is, unfortunately, still used by non-protistologists, thus generating a lot of confusion. Protists were until recently considered a Kingdom apart, the Protistan Kingdom. To date, the final proposed classification of eukaryotes is that of Adl and collaborators (2005) [129]. The purpose of these Authors was to provide a new classification system stable over time and easy to update. This classification reflects our current understanding of the evolution of protists and their phylogenetic relationships. To the contrary, all the previous classification schemes took account only of the morphology. Advancing with the study of molecular phylogeny, we assist in increasing discrepancies between morphology and molecular data. Before reaching the last classification, the name of many protist groups and genera have been changed so many times that still today it is difficult to determine which name applies, and homonyms are common. Many traditional groups are no longer valid and have been abandoned. Unfortunately, even now the problem of delimiting species borderlines for many protistan types remains [139].
At the beginning, the species of protists were identified and described solely on the basis of morphological criteria. The morphological species concept has been the most widely used since the discovery of protists. Now it is widely accepted that the morphology alone is not able to recognize all species. This is mainly due to the fact that many protistan species are morphologically indistinguishable, and so misdiagnoses are common. Moreover, we already lack an accessible storage of the samples with which to make comparisons. Today, it is well known that protistan species should be defined based on a combination of morphology, DNA sequences, physiology and ecology. Molecular biology techniques have given a new dimension to the study of protists. They have allowed us to discover that their diversity and abundance in nature are much larger than expected [132]. Furthermore molecular tools provided new insights into prostist classification. DNA-based studies often showed that traditional taxonomy underestimates diversity of both
- 29 -
macroscopic and microscopic organisms. The expectation is that the amount of cryptic diversity (i.e. genetic diversity that is not reflected in observable morphological features) in protists is very high. The most commonly used DNA sequences for phylogenetic reconstruction of protist groups are the mitochondrial 16S ribosomal RNA (16S rRNA) gene, the nuclear ITS region and the small subunit ribosomal RNA (18S rRNA) gene.
However, still today there is a lack of a fast, efficient, inexpensive and large-scale identification tool of protists.
- 30 -
2.4
CILIATED PROTIST: GENERAL FEATURES
Ciliate is the common name assigned to a protist taxon comprising the phylum Ciliophora. Over 8000 ciliate species have been described from marine, freshwater and terrestrial habitats, where they play a crucial ecological role. Ciliated protists are the most abundant phagotrophs in the biosphere. They are main actors of nutrient recycling in the ecosystems. They are distinguished on morphological basis and characterized by a nuclear dualism and body-covering cilia used for both locomotion and feeding. Ciliated protists also exhibit complex behaviours, for example predation, formation of cysts and spores, and chemotaxis. Some ciliated protozoan lines are “immortal”: they rejuvenate after sexual reproduction. In ethological researches they have been subjected to more study than any others protistan groups.
Aerobic ciliates also have the mitochondrial genome too. In GenBank databases only six mitochondrial genomes, all belonging to the genera Paramecium and Tetrahymena, were available before 2009. In 2009 de Graaf and collaborators [40] published the completed sequencing of the mitochondrial genomes of two Euplotes species, E. crassus and E. minuta. These Authors discovered that the linear mitochondrion genomes of these two Euplotes species show the same gene content of the other sequenced mitochondrial genomes of ciliated protozoa, but the gene order is completely different. Furthermore, these Euplotes species showed very long cox genes. However, there was no gene order difference between E. crassus and E. minuta.
Ciliated protozoa have been well known in literature for years as difficult organisms to classify, mainly because of the fact that “morphological conservationism is often associated with great ecological and molecular diversity”: cryptic species [140]. Over the past 10 years the classification of ciliates has been revised several times due to new information arising from phylogenetic analysis based on molecular markers (rRNA). Taken together, the new molecular data are often at odds with the morphological data and revealed unexpected complexity and diversity.
- 31 -
2.4.1 THE CILIATED PROTIST GENUS Euplotes AND ITS TAXONOMIC
IMPEDIMENT
The hypotrichous (cirri on functional ventral surface) genus Euplotes is the most cosmopolitan, ubiquitous, and specious group of ciliated protists. The genus Euplotes is defined on morphological basis. Euplotes has broadly adapted all over the face of the earth. There are about 100 described species but the rate of discovery of news species still remains high. Due to its abundance in nature and in its easiness of maintaining Euplotes strains in laboratory, the literature regarding this genus is extensive. Despite this, Euplotes is the most tangled taxonomy genus of ciliated protist, and its phylogenetic relationships were revised many times and they are still unclear. The identification of the Euplotes species requires expert skills and a lot of time. This genus, in fact, comprises of a bewildering array of sizes, morphologies, life histories, environmental tolerances and behaviours. The species identification problem in the genus Euplotes is mainly due to the fact that many of these species are morphologically indistinguishable. Species with similar morphologies may differ greatly with respect to other criteria. The most striking example of the problem concerning the identification of species of Euplotes is that of the “E. vannus-crassus-minuta complex”. Three closely related morphotypes of E. vannus, E. crassus and E. vannus-crassus-minuta were indistinguishable from each others since 1980’s. In literature we have been witnessing a great debate since the 1980’s to answer the question of whether the three are the same species or evolutionarily distinct entities. Various Authors, basing their conclusions on morphological, isoenzymatic, mating types and ecological features, were on the side of yes or no, with neither reaching a unanimous conclusion. The final demonstration that they have three distinct evolution life histories was given by the 18S rRNA gene[141].
Traditionally, also the species of Euplotes were described purely on the basis of external morphology (Fig. 5). In 1960, Tuffrau used numbers and distribution of cirri (compound ciliary organelles), shape of the macronucleus (vegetative nucleus), the dorsal agyrome patterns, the dorsal kineties, and the sylverline system. But the variability of characters based on the dorsal agyrome and numbers of cirri soon appeared insufficient for species identification. Borror (1972) revised the classification proposed by Tuffrau. Carter, in the same year added additional morphological features to species recognition, the number and shape of adoral zone of membranelles. The subsequent Euplotes revisions are those of Curds (1975), and Gates and Curds (1979), which always based their
- 32 -
classification scheme on morphological features. Borrow and Hill (1995), were the first to propose a new classification scheme of the Euplotes genus based on morphological features integrated with ecological features too.
Today it is well known that morphology alone is not adequate to distinguish Euplotes species. Di Giuseppe and collaborators (2011) [142] in a recently published paper, demonstrated that different Euplotes populations from the two poles of our planet all belonged to the E. nobilii morphospecies based on a combination of morphometric, genetic, phylogenetic and cross-breeding experiments. Furthermore, in the last two decades detailed investigation of secondary metabolites from the genus Euplotes has added “a new dimension” to the problem of their species-specific allocation via a "chemotaxonomic" approach, which is able to define protistan taxonomy to the sub specific level [3]. In fact, the huge degree of biodiversity that characterize the Euplotes genus is also highlighted by the secondary metabolites production. For example, the secondary metabolite “euplotin C” is produced only by the E. crassus morphospecies, thus enabling its identification. The other two members of the Euplotes vannus-crassus-minuta complex, E. minuta and E. vannus, produced only a precursor or did not produce any euplotin secondary metabolite respectively. E. vannus, in fact, produced a different set of secondary metabolites, which can be used to identify this species.
It would be important to have a reliable and rapid tool to distinguish Euplotes morphospecies because of their ecological, biochemical, and biotechnological relevance. We still lack suitable keys to enable Euplotes identification and little progress can be made with the purely morphological approach, for the reasons discussed so far.
- 33 -
Dorsal views Ventral views
Fig. 5. (A) Differential interference contrast microscope (DIC) of Euplotes. (B) Scanning electron micrographs (SEM) of Euplotes. (C) Silver nitrate impregnation of
Euplotes. (D)The staining method of Feulgen highlights the macronuclear shape of Euplotes. Bars 10 µm.
- 34 -
- 35 - This Doctoral thesis addressed two issues.
The major purpose of this research project was to determine whether the cox1 barcoding is an effective identification tool capable of differentiating closely related Euplotes species. This evaluation was conducted with two approaches. The first approach was to analyze the relationship between the interspecific and intraspecific cox1 sequence variation. The second approach was to verify that strains belonging to the same morphospecies form a monophyletic cluster on phylogenetic trees.
The second issue was to evaluate the ability of the cox1 gene as a phylogenetic marker. To make this evaluation, the cox1 phylogeny was compared to the 18S phylogeny, the nuclear non-coding gene normally used to infer the phylogeny in eukaryotic organisms. The 18S gene sequences for different Euplotes strains and species were already available in the laboratory where I conducted my doctoral thesis.
- 36 -
- 37 -
4.1
SOURCE OF SAMPLES AND CULTURE CONDITIONS
The availability of the largest collection of Euplotes living strains which currently exists worldwide, the result of half a century of sampling at all latitudes of the globe, allowed me to help create the basis for verifying the effectiveness of the DNA barcoding tool to identify and discriminate the Euplotes protist taxa.
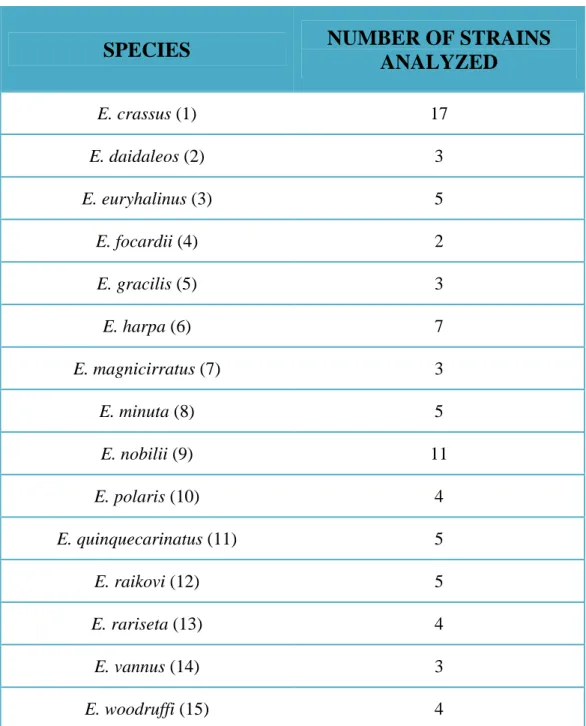
To test the feasibility of establishing a Euplotes species identification system, 81 strains belonging to 15 Euplotes morphospecies were analyzed. Table 3 shows the 81 Euplotes strains analyzed in this study and their distribution among the Euplotes morphospecies. For a more detailed list of the Euplotes strains analyzed, see Table 4. The Fig. 6 shows the huge geographical dispersal of the Euplotes strains analyzed. All the Euplotes strains collected were established starting from single naturally occurring cells to obtain cellular line clones and were fed on both microalgae and bacteria, which represent a component of the natural diet of the species concerned. Marine strains were grown in salt water (32‰ salinity) on sterilized, defined and artificial seawater prepared according to Allen’s formula1 and inoculated with both Dunaliella tertiolecta (Chlorophyceae, Dunaliellales) (algae) and Enterobacter aerogenes (bacteria), grown in the same artificial seawater as ciliate organism. The freshwater Euplotes strains were grown in S.M.C. medium2 and the freshwater micro-alga Chlorogonium sp. and the bacterium Enterobacter aerogenes were grown both in S.M.C. medium and were used as food organism. The S.M.C. medium was prepared from S.M.B. medium3. Both Dunaliella tertiolecta and Chlorogonium sp. were cultivated in aerated 5-liter Erlenmeyer flasks at 23 ± 1 °C in a 12 h light/dark cycle for at least 10 days using a daylight (Osram Daylight lamp, 36 W/10) and fluorescent (Osram Fluora lamp, 40 W/77) illuminated incubator system. Bacterial cultures were grown monoxenically either with 0.05 (w/v) protease-peptone in salt water at 4‰ for marine Euplotes species or distilled water for freshwater Euplotes, and incubated in the dark at 37 °C for 24 h. The food was added every other day in an amount that kept the cells well supplied but nevertheless avoided overfeeding (overfeeding in Euplotes easily
________________________________________________________________________________
1
1M stock of NaCl, KCl, CaCl2, MgCl2, MgSO4 and NaHCO3 2
S.M.C. medium (S.M.B. medium + 0.5 µM MnCl2, 9.0 µM FeCl3, 1.25 mM NH4NO3) 3
S.M.B. medium (1.5 M NaCl, 0.05 M KCl, 0.05M MgSO4,0.4 M CaCl2(H2O)2, 0.05 M MgCl2(H2O)6, 0.2 M NaH2PO4(H2O),
- 38 -
slows down the multiplication rate). For a few days before the extraction of the DNA, Euplotes cultures were fed only with bacteria.
Normally, Euplotes strains were maintained in culture at 23 ± 1 °C. To the contrary, the Arctic and Antarctic Euplotes strains, were cultivated at 6 ± 1°C. Both bacteria and algae were kept in the fridge at 6 °C before feeding the polar Euplotes strains, in order to avoid an increase in temperature of these strains. The polar Euplotes species are: E. euryhalinus, E. focardii, E. nobilii, and E. polaris.
- 39 -
Table 3. Number of strains analyzed in this study for each Euplotes morphospecies. The number in parentheses corresponds to the number indicating the species in Fig. 6.
SPECIES
NUMBER OF STRAINS
ANALYZED
E. crassus (1) 17 E. daidaleos (2) 3 E. euryhalinus (3) 5 E. focardii (4) 2 E. gracilis (5) 3 E. harpa (6) 7 E. magnicirratus (7) 3 E. minuta (8) 5 E. nobilii (9) 11 E. polaris (10) 4 E. quinquecarinatus (11) 5 E. raikovi (12) 5 E. rariseta (13) 4 E. vannus (14) 3 E. woodruffi (15) 4- 40 -
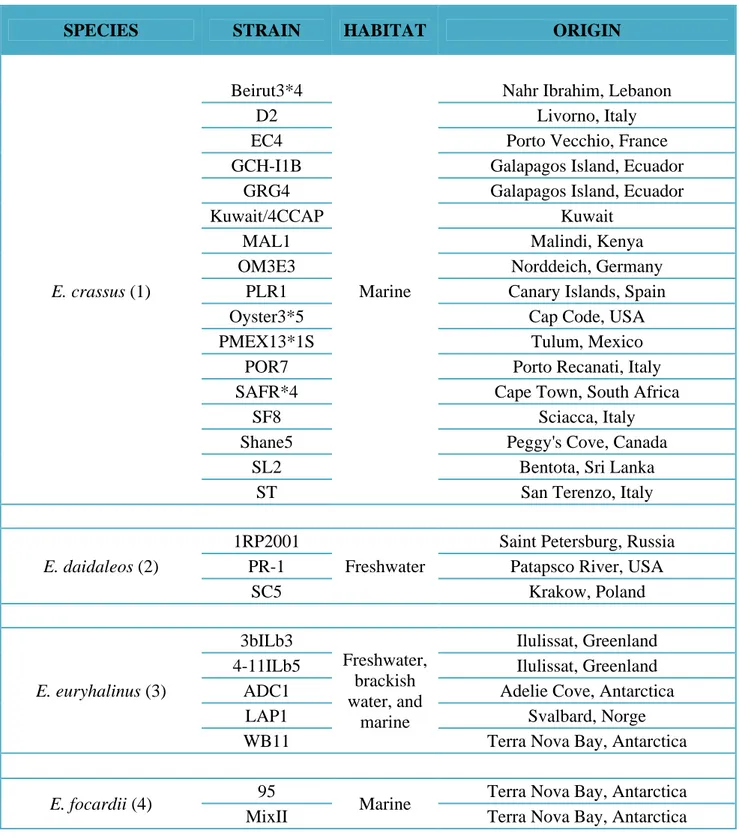
Table 4. Detailed list of the Euplotes strains examined in this study with their geographical origin. The number in parentheses corresponds to the number indicating the species in Fig. 6.
SPECIES STRAIN HABITAT ORIGIN
E. crassus (1)
Beirut3*4
Marine
Nahr Ibrahim, Lebanon
D2 Livorno, Italy
EC4 Porto Vecchio, France
GCH-I1B Galapagos Island, Ecuador
GRG4 Galapagos Island, Ecuador
Kuwait/4CCAP Kuwait
MAL1 Malindi, Kenya
OM3E3 Norddeich, Germany
PLR1 Canary Islands, Spain
Oyster3*5 Cap Code, USA
PMEX13*1S Tulum, Mexico
POR7 Porto Recanati, Italy
SAFR*4 Cape Town, South Africa
SF8 Sciacca, Italy
Shane5 Peggy's Cove, Canada
SL2 Bentota, Sri Lanka
ST San Terenzo, Italy
E. daidaleos (2)
1RP2001
Freshwater
Saint Petersburg, Russia
PR-1 Patapsco River, USA
SC5 Krakow, Poland E. euryhalinus (3) 3bILb3 Freshwater, brackish water, and marine Ilulissat, Greenland
4-11ILb5 Ilulissat, Greenland
ADC1 Adelie Cove, Antarctica
LAP1 Svalbard, Norge
WB11 Terra Nova Bay, Antarctica
E. focardii (4) 95 Marine Terra Nova Bay, Antarctica
- 41 -
SPECIES STRAIN HABITAT ORIGIN
E. gracilis (5)
ATCC50191
Marine
The American Type Culture Collection
GNI1 Sicily, Italy
GPO4(2) San Terenzo, Italy
E. harpa (6)
ALM10
Freshwater
Mughsayl, Oman
ALM3 Mughsayl, Oman
BaI5 Island of Barra, Scotland
GS-4 Okinawa Prefecture, Japan
Nap3 Naples, Italy
RB22 Berezovi Island, Russia
Serch1 Pisa, Italy
E. magnicirratus (7)
3SC10
Marine
Shelkovo City, Russia
CO Colombia
Miya3 Miyajima, Japan
E. minuta (8)
CCAP1624/13
Marine
The American Type Culture Collection
GAR4 Gerachico, Spain
IM2 Imperia, Italy
Kling4 Emerald Isle, USA
MAR11 Maratea, Italy
E. nobilii (9)
1QAA
Marine
Qaanaaq, Denmark
1QN1 Siorapaluk, Denmark
2QAN1 Thule, Denmark
3QAN7 Thule, Denmark
3QN2 Siorapaluk, Denmark
4Pyrm4 Pyramiden, Norge
5QAA15 Qaanaaq, Denmark
EurhB Edmonson Point, Antarctica
PNA-1h Tierra del Fuego, Argentina
QAN1 Thule, Denmark
- 42 -
SPECIES STRAIN HABITAT ORIGIN
E. polaris (10)
EdPoB02
Marine
Terra Nova Bay, Antarctica
Eup.Scon Ilulissat, Greenland
Ila7policlonale Ilulissat, Greenland
Split3 Terra Nova Bay, Antarctica
E. quinquecarinatus (11)
DAK5
Marine
Dakar, Senegal
GBS-I3 Galapagos, Ecuador
GBS3 Galapagos, Ecuador
MR13 Sharm el Sheik, Egypt
OMAN2 Mughsayl, Oman
E. raikovi (12)
4MNM
Marine
Manly-Wynnum, Australia
Biod2 Biodola, Italy
GA8 Gaeta, Italy
LPSA5 Lampedusa, Italy
Myy1 Manly-Wynnum, Australia
PCE1 Porto Cesareo, Italy
SMAaj3 Santa Maria Island, Portugal
E. rariseta (13)
BR1
Marine
Ubatuba, Brazil
FSl1 Pisa, Italy
MAM30 Wynnum, Australia
Smund2 Swakopmund, Namibia
E. vannus (14)
Bali6
Marine
Bali, Indonesia
SML S.Maria di Leuca, Italy
TB6 Tanabe, Japan
E. woodruffi (15)
CoMa1-5
Freshwater
Comacchio, Italy
Fane1 Favone, France
MS-3 Yamagata Prefecture, Japan
- 43 -
Fig. 6. The huge geographical dispersal of the sampling. Strains were collected at all latitude of the terrestrial globe. Numbers correspond to the Euplotes species in Table 3 and Table 4. In the bottom a detail of the Euplotes strains collected in the Italian geographycal area and in Corse.
- 44 -
4.2
DNA EXTRACTION
The DNA was extracted from Euplotes healthy cells. I tested three different protocols for DNA extraction, selected on the basis of the initial number of cells from which to extract the DNA.
a) Guanidine protocol. This extraction protocol is used in cases where the initial number of cells is a few thousand, but less than one million. This extraction protocol is useful when it is necessary to send the sample of lysed cells, since the solution containing guanidine and lysed cells remained stable for many days even at Room Temperature (RT). I used this protocol, in fact, for the strains that I did not have available in the collection. Cells were pelleted by centrifugation and resuspended in 100 µl of distilled H2O. 400 µl of guanidine chlorhydrate 8 M were added to cells and the sample was incubated at RT for 1 hour. Then, 400 µl of EDTA pH 8 were added and the DNA was precipitated with 0.1 volumes of LiCl 4 M and 1 volume of 100% ice-cold ethanol and preserved at -20 °C over night (O.N.), followed by centrifugation 15000 x g for 15 minutes at 4 °C. The pelleted nucleic acids were washed 2 times in 70% ethanol and air dried before resuspension in a suitable volume of distilled H2O (generally 20-40 µl).
b) Phenol/Chloroform protocol. This DNA extraction protocol is performed for extraction from about one million cells. Cells were pelleted by centrifugation and resuspended in 500 µl of distilled H2O. 150 µl of NDS (0.5 M EDTA, 1% SDS, 10 mM Tris-HCl, pH 9.5) at 55 °C and 65 µl of proteinase K (1 mg/ml H2O) were added to cells and the sample was incubated at 55 °C for 12-15 hours. Then, 715 µl of Polyetilenglicol (PEG) 12%/NaCl 1.2 M cold were addeded and the sample was incubated on ice for 1 hour, followed by centrifugation 15000 x g for 15 minutes at 4 °C. Then, the pelleted nucleic acids were washed 2 times in 70% ethanol and air dried before resuspension in 500 µl of distilled H2O. 5 µl of RNase A (10 mg/ml) were added and the sample was incubated at 37 °C for 1 hour. Then, 500 µl of phenol at 37 °C were addeded, followed by centrifugation 15000 x g for 2 minutes at RT. 500 µl of chloroform were added to the surnatant, followed by centrifugation 15000 x g for 2 minutes at RT. 400 µl of PEG 12%/NaCl 1.2 M were again added to the surnatant, and the sample was incubated on ice for 1 hour, followed by