UNIVERSITY OF ROME
"TOR VERGATA"
Faculty of Sciences
PhD school in Cellular and Molecular Biology
XXI cycle
Association of HS1,2A polymorphism with
several diseases and analysis of the haplotypes of
the region surrounding the enhancer
Claudia Mattioli
A.A. 2008/2009 Mentor: Prof. Domenico Frezza
TABLE OF CONTENTS
ABSTRACT...6
ABBREVIATIONS...8
INTRODUCTION...9
1. Structure of the immunoglobulin...9
2. The Immunoglobulin Heavy Chain (IgH) locus in mouse and human...10
3. B lymphocyte development ………...11
3.1 Class Switch Recombination (CSR) ………..………11
4. Long-range gene activation...13
5.Regulatory elements of the immunoglobulin heavy chain locus...15
5.1. The murine 3’ IgH Regulatory Region (3’RR)...16
5.1.1 Regulation of murine 3’RR activity...17
5.1.2 Long range activation by murine 3’RR………...19
5.2 The human 3’ IgH Regulatory Regions...20
5.2.1 Polymorphic structure of the HS1,2A and HS1,2B enhancers...23
5.2.2 Functional role of the HS1,2A enhancer...24
5.2.3 World distribution of the HS1,2A allele frequencies...25
6. Genetic variants: polymorphisms and haplotypes...27
7. Immunological diseases... ………...29
7.1 Autoimmune diseases...29
7.1.1 Organ-specific illnesses...32
7.1.2 Systemic illnesses………...……….…...32
7.2 IgA deficiency………..………...33
8. Alteration of serum immunoglobulin levels in schizophrenic patients and healthy subjects………...………...….34
9. Genetic factors influencing the progression of viral infections..……...…35
9.1 Genetic factors associated with AIDS progression……….35
9.2 Genetic factors associated with Hepatitis C progression………....37
AIMS OF PROJECT...38
MATERIALS AND METHODS...39
1.1 Solutions...39 1.2 Enzymes……….……...…...39 1.3 Primers……….…………39 1.3.1 PCR primers……….………...….39 1.3.2 Sequencing primers……….………...40 1.4 DNA samples………...41 1.4.1 Control samples………....41 1.4.2 Patients……….….41 2. Methods……….43 2.1 DNA extraction...43 2.2 HS1,2A genotyping...43 2.3 Sequencing………...44 2.4 Statistical analysis………....45 RESULTS...46
1. HS1,2A polymorphism in healthy populations...46
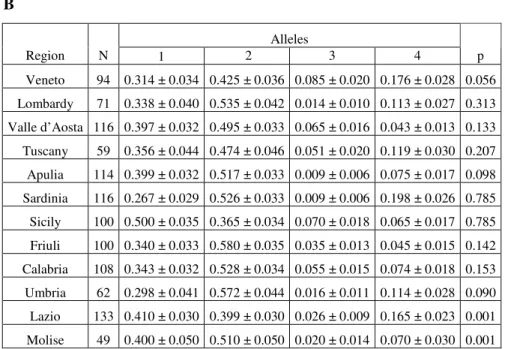
1.1 HS.1.2A allelic frequencies in Italian population...46
1.2 HS1,2A allelic frequencies in populations living in geographic isolation……….48
2. Association of HS1,2A polymorphism with immunological diseases...51
2.1 Increase of HS1,2A allele 1 enhancer frequency in selective IgA deficiency……….………..51
2.2 Increased frequency of HS1,2A allele 2 in several autoimmune diseases………..53
2.2.1. Increased frequency of HS1,2A enhancer allele 2 in Dermatitis Herpetiformis, Plaque Psoriasis and Psoriatic Arthritis………53
2.2.2 Allele 2 of the HS1,2A enhancer associates with Rheumatoid Arthritis……….56
2.2.3 Increased frequency of HS1,2A enhancer 2 allele in Rheumatoid Arthritis, Systemic Sclerosis and Lupus Erythematosus Systemicus……...59
2.2.4 Allele 2 of the HS1,2A enhancer of the Ig 3’ regulatory region associates with Crohn’s disease……….61
3. Correlation of HS1,2A polymorphism with immunoglobulin serum levels………..63
4. Association of HS1,2A polymorphism with the progression of viral infections………...67
4.2 HS1,2A allele 2 association with progressive HCV infection….……...69
5. Analysis of the haplothypes of the regions surrounding the HS1,2A and HS3 enhancers………..………....71
5.1 The SNPs of the regions surrounding the HS1,2A and HS3 enhancers………...71
5.2 The HS1,2A genotype analysis ……..………72
5.3 The Linkage Disequilibrium (LD) analysis………73
5.4 The haplotype frequency analysis………...74
5.4.1. The haplotypes of the allele 1 and allele 2 groups………..74
5.4.2. The haplotypes of the control and patients allele 1 groups………….78
5.4.3. The haplotypes of the control and patient allele 2 groups…………..79
5.5 The “analysis of molecular variance” (AMOVA)………...82
5.6 The CpG plot analysis……….84
5.7 The transcription factor binding sites analysis………85
DISCUSSION ...87
1. The HS1,2A polymorphism...87
1.1 Distribution of HS1,2A alleles in Italian population and in several European healthy populations living in geographic isolation……...87
1.2 Association of HS1,2A polymorphism with several autoimmune diseases and selective IgA deficiency………..88
1.3 Correlation of HS1,2A allele frequencies with the alteration of serum Ig concentration………...………...89
1.4 Role of HS1,2A polymorphism in the progression of HIV and HCV infections………...90
2. The genetic variants of the regions surrounding the HS1,2A and HS3 enhancers ………...………. 91
CONCLUSION……….93
ABSTRACT
In humans two regulatory regions (3’RR-1 and 3’RR-2) lying downstream of each of the two heavy chain constant α genes are able to enhance immunoglobulin transcription from the heavy chain promoters in a tissue-and-stage-specific manner. Each human regulatory region harbours three enhancer elements: HS3, HS1,2 and HS4. Among the enhancers, only HS1,2 proved to be polymorphic. The selective amplification of HS1,2A revealed the occurrence of four alleles (1; 2; 3; 4) which show variable frequencies throughout the world population. One aim of this thesis is to study the distribution of HS1,2A alleles in the Italian population. The Italian population turns out to be rather homogeneous for this locus. Nevertheless, natural barriers impair genetic flux in Sardinia in contrast to the homogeneity generally found in the rest of Italy. A similar effect is also found in Spain’s Sierra de Gredos region.
Previous studies have demonstrated the association of the HS1,2A polymorphism with some immunological diseases. Gel shift experiments have shown that two different protein complexes bind the HS1,2A alleles 1 and 2. These data suggest a role of the HS1,2A polymorphism in the regulation of B cell functions. In this thesis we extended the analysis to selective IgA deficiency and to several autoimmune diseases. We found a significant increase of allele 1 frequency in a group of patients affected by IgA deficiency in respect to the control. On the other hand, allele 2 frequency is significantly increased in individuals affected by different autoimmune diseases in respect to the control. Moreover, allele 2 associates strongly with the acute form of a given autoimmune disease in respect to the milder form. The association of HS1,2A polymorphism with the alteration of immunoglobulin serum levels was also investigated in this thesis. Allele 1 frequency increase associates significantly with immunoglobulin serum levels below the standard values, while allele 2 frequency increase correlates with immunoglobulin serum levels above the standard values. It is known that several host genetic factors influence the progression of viral pathologies. Previous studies have shown the correlation of HS1,2A polymorphism with AIDS progression in a cohort of Libyan patients. Here we found an association of HS1,2A polymorphism with the decrease of CD4+ T cell levels in a group of HIV positive subjects from South Africa. We also showed that the HS1,2A polymorphism could be involved in the
Subsequently, the analysis was extended to a region lying between the enhancers HS3 and HS1,2A of the 3’RR-1. In total, 22 single nucleotide polymorphisms in strong linkage disequilibrium with each other were identified. We found a strong significant correlation of the haplotypes with the HS1,2A alleles. We hypothesized that the HS1,2A polymorphism and the haplotypes of the 3’RR-1 could affect epigenetic changes or transcription factor binding to the regulative region, so influencing the regulative region activity in immunoglobulin germline transcription, in class switch recombination and in immunoglobulin production.
ABBREVIATIONS
AID Autoimmune disease BCR B cell receptor CD Crohn’s Disease
CH Constant region heavy chain gene
CL Constant region light chain gene
CSR Class Switch Recombination DH Dermatitis herpetiformis
DH Diversity region heavy chain gene
Eµ Immunoglobulin Heavy Chain Enhancer ERA Early Rheumatoid arthritis
GT Germline transcription
GWA Genome-wide association studies HLA human leukocyte antigen
HS DNAse I hypersensitive site I I-region promoter
Ig Immunoglobulin IGAD IgA deficiency
IgH Immunoglobulin heavy chain locus
IgHC Immunoglobulin heavy chain constant region JH Joining region heavy chain gene
LCR Locus Control Region
LSRA Long Standing Rheumatoid Arthritis MHC Major Histocompatibility Complex PA Psoriatic Arthritis
PP Plaque Psoriasis PS Psoriasis
RA Rheumatoid Arthritis RCU Rectocolitis Ulcerosis
RFLP Restriction fragment length polymorphism 3’RR 3’ Regulatory Region
S Switch region
SHM Somatic Hypermutation SLE Systemic lupus erythematosus SNP Single Nucleotide Polymorphism VH Variable region heavy chain gene
INTRODUCTION
1. Structure of the immunoglobulin
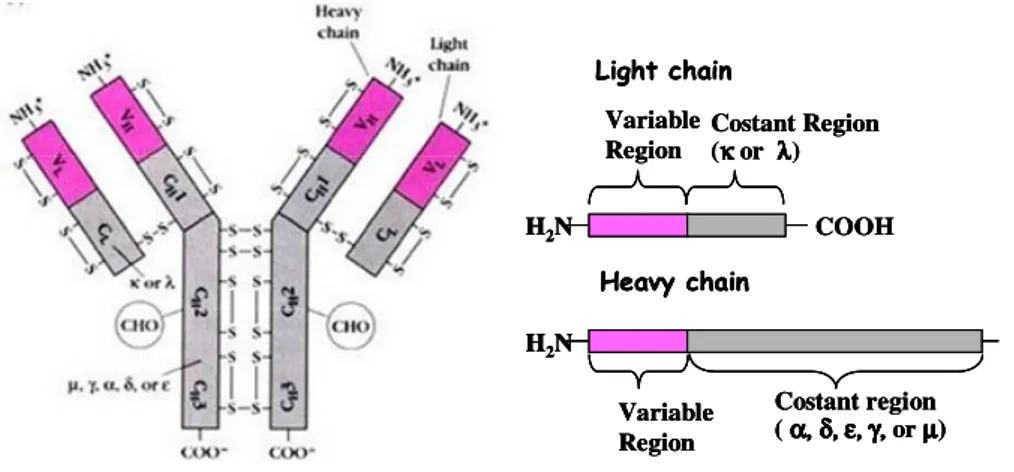
The soluble immunoglobulins (Ig) represent the 20% of total serum protein and are product by plasma cells by a tightly regulated process. The antibodies (immunoglobulins) are composed by two heavy and two light chains. Both the light chains and the heavy chains have a variable (V) and a constant (C) region which are held together by disulfide bonds (Fig. 1). The variable regions both of the heavy and light chain form the antigen binding site determining the antibodies specificity; whereas other properties of antibodies molecules such as half life, complement fixation and placental transfer, depend only on the constant region of the heavy chain. There are five different isotypes for the constant regions (α, δ, ε, γ,and µ); each isotype is encoded from a different DNA segment and defines the specific class of the antibodies (IgA; IgD; IgE; IgG and IgM).
Fig. 1. Immunoglobulin structure. Schematic representation of an antibody
molecole with two identical heavy (H) and light (L) chain. Both chain have variable (V) and constant (C) sub-domains which are hold together by disulfide bonds. The light chain have two subdomain ( VL-CL) while the heavy chain have four subdomain (VH-CH1-CH2
-CH3-CH4). H2N COOH Variable Region Costant Region (κκκκ or λλλ)λ Light chain H2N Variable Region Costant region ( αααα, , , , δδδδ, , εεεε, , , , , , γγγγ, , , , or µµµ)µ Heavy chain H2N COOH Variable Region Costant Region (κκκκ or λλλ)λ Light chain H2N Variable Region Costant region ( αααα, , , , δδδδ, , εεεε, , , , , , γγγγ, , , , or µµµ)µ Heavy chain H2N COOH Variable Region Costant Region (κκκκ or λλλ)λ Light chain H2N Variable Region Costant region ( αααα, , , , δδδδ, , εεεε, , , , , , γγγγ, , , , or µµµ)µ Heavy chain
2. The Immunoglobulin Heavy Chain (IgH) locus in
mouse and human
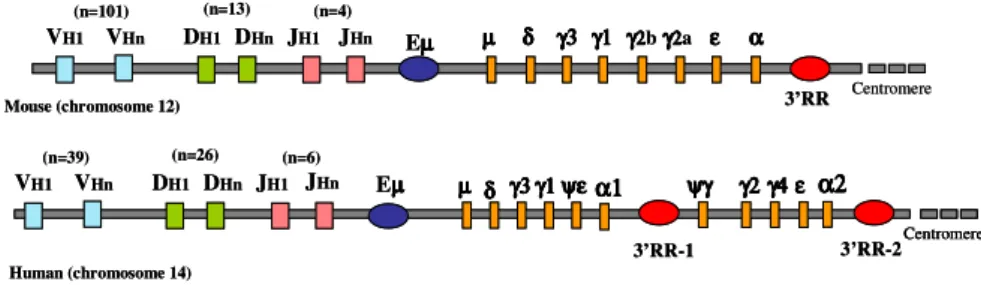
In the mouse the Immunoglobulin heavy chain gene (IgH) cluster is localized on chromosome 12 and spans ∼3 megabases. The variable region is close to the telomere and has ∼ 101 VH segments, followed by ∼13DH and 4
JH segments. The mouse heavy chain constant region gene (IgHC) cluster,
lying downstream of the variable region, is composed of eight functional genes, including four Cγ genes and one Cα gene (Cµ-Cδ-Cγ3-Cγ1-Cγ2b-Cγ2a-Cε-Cα). The human IgH locus is located on chromosome 14, spans ∼3Mb and has the same general organization of the murine IgH cluster. There are ∼39 functional VH gene segments, followed by 26 DH and 6 JH
segments. The human IgHC locus contains nine functional genes and two pseudogenes (Cµ-Cδ-Cγ3-Cγ1-Cψε-Cα1-Cψγ-Cγ2-Cγ4-Cε-Cα2), organized into two γ−γ−ε−α blocks. It has evolved through a series of duplications, followed by mutations and specialization of the new genes (Fig. 2). The locus is still evolving and up to 20% of the European population and 44% of the Asian population show duplications of single or multiple IgHC genes. The evolution of the human and mouse IgHC loci after the divergence of the two species has resulted in differences in the gene organization, the number of genes, and the function of selected IgHC genes. Thus, even if both species have the same IgG subclass encoding genes, the product of human and mouse are different in structure and function; CSR to IgG subclass or IgA is also differentially regulated in mouse and human. (Hammarstrom et al, 2007) µ µµ µ δδδδ γ3γ3γ3γ3 γ1γ1γ1γ1 ψψψεεεεψ α1α1α1α1 Human (chromosome 14) Eµµµµ ψγγγγψψψ γ2γ2γ2γ2γ4γ4γ4γ4εεεε α2α2α2α2 Centromere VH1 VHn (n=39) (n=26) (n=6) DH1 DHn JH1 JHn Mouse (chromosome 12) Eµµµµ VH1 Centromere VHn (n=101) (n=13) (n=4) DH1 DHn JH1 JHn µµµµ δδδδ γ3 γ1γ3γ3γ3 γ1γ1γ1 γγγγ2222bγγγγ222a2 εεεε αααα 3’RR 3’RR-1 3’RR-2 µ µµ µ δδδδ γ3γ3γ3γ3 γ1γ1γ1γ1 ψψψεεεεψ α1α1α1α1 Human (chromosome 14) Eµµµµ ψγγγγψψψ γ2γ2γ2γ2γ4γ4γ4γ4εεεε α2α2α2α2 Centromere Centromere VH1 VHn (n=39) (n=26) (n=6) DH1 DHn JH1 JHn Mouse (chromosome 12) Eµµµµ VH1 Centromere VHn (n=101) (n=13) (n=4) DH1 DHn JH1 JHn µµµµ δδδδ γ3 γ1γ3γ3γ3 γ1γ1γ1 γγγγ2222bγγγγ222a2 εεεε αααα 3’RR 3’RR-1 3’RR-2
Fig. 2. The Immuoglobulin Heavy Chain (IgH) Locus in Mouse and Human. The
map show the variable region (segment V-D-J), the enhancer Eµ, the constant gene and the regulative region at 3’ end of the constant region (3’RR). The human IgH constant
3. B lymphocyte development
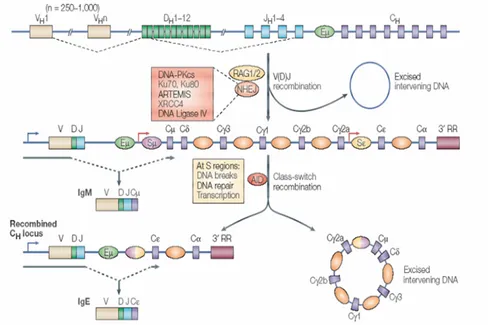
B lymphocyte development begins in the bone marrow and leads to the generation of mature peripheral B cell capable of producing secreted immunoglobulins. Developing B cells undergo an ordered V(D)J recombination process leading to productive assembly of V, D and J genes at the heavy chain locus, and assembly of V and J genes at the light chain locus (Diamant and Melamed, 2004) (Fig. 3). DH-JH rearrangements occur at the
early pro-B stage, and subsequent V-DJ rearrangement commence at the late pro-B stage. Appropriate signalling through the pre-B cell receptor (BCR) mediates heavy-chain allelic exclusion and induces proliferation of large pre-B cell. Subsequently, at the small pre-pre-B stage, light chain- rearrangement begins (Wang and Clark, 2003). At the immature stage, B cells expressing surface IgM undergo positive and negative selection events to promote the formation of signalling competent non-autoimmune repertoire. Then immature B cells emigrate to the periphery and undergo alternative splicing to produce IgD membrane form becoming mature naïve B cell. The final stage of B-lymphocyte development depends on antigenic stimulation and appropriate T-cell help provided by CD40 ligand. This process take place in the germinal center where activated B cells undergo somatic hyper mutation (SHM) and affinity maturation, and, in most cases, class switch recombination (CSR) to express IgG-IgA and IgE receptors (see below). Some of these cells differentiate into memory B cells and give rise to high affinity antigen-specific repertoire (Diamant and Melamed, 2004). Other cells differentiate into plasma-cell producing the immunoglobulin secret form in response to primary antigen exposure.
3.1 Class Switch Recombination (CSR)
Immunoglobulin (Ig) class switching, or isotype switching, is a process by which B lymphocytes shift from production of IgM to one of the IgG3, IgG1, IgG2b, IgG2a, IgE or IgA classes and subclasses in mouse, or to IgG3, IgG1, IgA1, IgG2, IgG4, IgE, and IgA2 in humans. This process is mediated by the deletional DNA recombination between the switch (S) region of the Ig heavy chain constant region µ gene (Sµ) and one of the downstream S regions located 5’ to each CH (except for the δ gene). CSR creates a novel
transcriptional unit encompassing the original variable/diversity/joining (VDJ) fragment, plus the new heavy chain constant (CH) gene, therefore
generates a new type of Ig molecule with original antigen-binding specificity and novel effector functions associated with the IgH chain. This process provides the basis for the versatile, humoral, immune functions of Ig molecules (Zhang, 2003) (Fig. 3). Transcription of the germline IgH gene, termed Ig germline transcription (GT), is the initial step for CSR. This process is activated and directed by cytokines and synergized by the costimulation of CD40. Ig GT appears to be optimized by the 3’RR via its locus control region (LCR) function providing for efficient GT and CSR. CSR process event suggest clearly that transcription through the S region plays a primary role in targeting CSR his own. Consequently, a mechanism influencing GL promoter’s transcription is involved directly in the regulation of CSR (Manis et al, 2000).
Fig. 3. Rearrangements of the immunoglobulin heavy chain locus. The variable
region of the immunoglobulin heavy chain is assembled from the component variable (VH),
diversity (DH) and joining (JH) gene segments by V(D)J recombination. Transcription across
the locus is driven by a promoter upstream of the rearranged VDJ segment (blu arrow), which allow the synthesis of a µ heavy chain. Then the heavy chain associate with a light chain forming an IgM molecule, which is display on the cell-surface of a B cell. Secondary isotypes are then produced by class-switch recombination mechanism (CSR), a process that
4. Long-range gene activation
Gene activity is regulated in a tissue- and temporal-specific manner by
cis-acting DNA elements such as promoters, enhancers and silencers; and
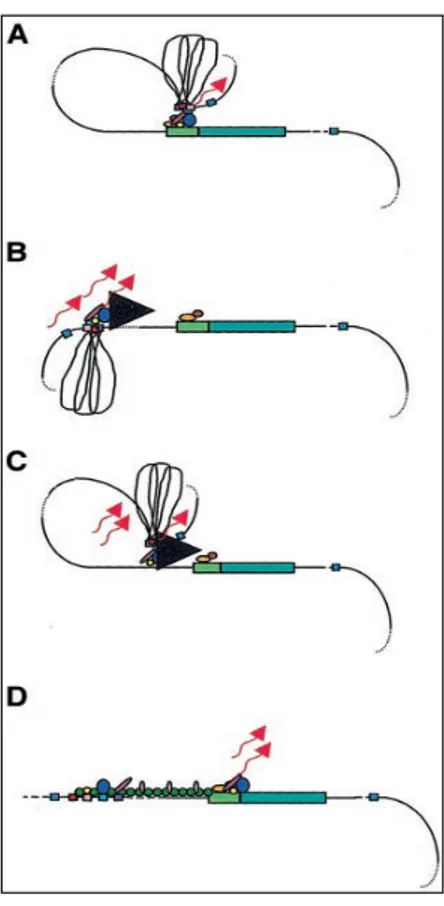
trans- acting elements such as basal transcription factors, co-activators and chromatin modifying enzymes, which work together to activate transcription upon stimulation by specific signals. Enhancer elements activate high levels of transcription of linked genes from proximal or distal location. Although most enhancers are located tens of Kilobases (kb) away, some have been found at distance of up to a megabase from their gene target. Enhancer elements, therefore, have the potential to activate a number of neighbouring genes over a large chromosomal region. Most enhancers appear to be promiscuous and their action must be restricted in order to prevent the activation of non-target gene. DNA insulators are cis-elements founded to possess both enhancer blocking and heterochromatin barrier activities (West and Fraser, 2005). Locus control regions (LCRs) were functionally defined by their ability to enhance the expression of linked genes to physiological levels in a tissue specific and copy number-dependent manner at ectopic chromatin sites. Although their composition and locations relative to their cognate genes are different, LCRs have been described in a large spectrum of mammalian gene system (Li et al, 2002). LCRs typically contain several DNase I hypersensitive sites with enhancer activity or insulators elements. The discovery of the LCR in the β-globin locus and the characterization of LCR in many other loci reinforce the idea that the regulation of gene expression is not founded only on proximal elements such as promoters, enhancers and silencers, but also on long-range interactions of various cis-regulatory elements and dynamic chromatin alterations. The mechanism of long-range transactivation by the LCRs is poorly understood. Several models have been postulated: looping, tracking, facilitated-tracking and linking model (Li et al, 2002) (Fig. 4). All the models implicate the ability of LCRs to alter chromatin conformation to allow transcription factors binding LCR element to interact with transcription factors that bind promoter elements, enhancing gene transcription. Recent studies have shown that upon their transcriptional activation, genes can migrate beyond their chromosomal territories to foci enriched of RNA polymerase II and transcriptional machinery, known as transcriptional factories. In this model, gene promoters have been observed to contact to linked enhancer elements by a chromatin loop. Trans-acting factors recruited to enhancers and promoters determine interaction between looped chromatin fibres (West and Fraser, 2005).
Fig. 4. Models of LCR function. (green rectangular box= putative gene; light green = promoter region; coloured ovals and circles = transcription factors; small coloured box = hypersensitive sites (HSs); wavy arrows = DNA transcripts. The flanking DNA sequences of the HSs are depicted as loops between the HS sites) (A) Looping model. The LCR directly interacts with the gene promoter by looping out the intervening DNA, allow the transcription factor binding the HSs to contact the transcription factor binding the promoter. (B)Tracking model. The transcription factor complex of LCR tracks down the DNA sequence (black arrowhead), until encountering transcription factor bound the gene promoter. (C) Facilitated tracking model. Looping process occurs to deliver the transcriptional factor binding the LCR proximal to gene promoter, then tracking process occur until they encounter the transcription factors bound to the gene promoter. (D) Linking model. Sequential bonding of transcription factor along the DNA directs changes in chromatin conformation and define the transcriptional domain. The transcription factors are linked to one another from the LCR to the gene promoter by non –DNA binding
5.
Regulatory elements of the immunoglobulin heavy
chain locus
The regulation of human immunoglobulin heavy chain gene expression is incompletely understood, despite clinically significant conditions in which specific isotypes are inappropriately up- or downregulated, e.g., allergies due to inappropriate IgE response, and various forms of immunodeficiency associated with low IgA expression. Clearly, cytokines and interactions between B and T cells play a role in regulate isotype switching, and cis- elements in the IgH gene locus which mediate these effects have been described in mouse and human (Mills et al, 1997). Key cis-regulators of B cell-specific expression of IgH genes are VH promoters, I region promoters
located upstream of each heavy chain constant region gene, and two sets of enhancers: the intronic enhancer (Eµ) and a complex regulatory region that lies 3’ of the IgH gene locus (3’RR) (Fig. 2). The immunoglobulin heavy chain enhancer (Eµ), located in the intron separating coding sequences for the heavy chain variable and constant regions, was the first transcriptional enhancer shown to function in a tissue-specific manner. This tissue specificity, along with the fact that Eµ was required for the efficient expression of cloned IgH genes, suggest that it was an essential controlling element in the developmentally-regulated expression of IgH genes (Lieberson et al, 1991). However, first observation in mouse myeloma cells supported the notion that additional enhancers might lie within the IgH locus (Zhang, 2003; Lieberson et al, 1991). The attention was focused on a region located downstream of the Cα gene. This region includes several elements displaying lymphoid-specific transcriptional enhancer activity in transient or stable transfection assay, and is known collectively as 3’ regulatory region (3’RR). Relative roles of the two sets of enhancers are gradually being elucidated. Analysis of B cell lines that lack Eµ have led to the conclusion that Eµ is involved early in B cell development, e.g., in V to D-J joining and in µ heavy chain gene expression, and is dispensable at later stages of B cell differentiation, i.e., in plasma cell lines (Ernst and Smale, 1995); while the 3’ enhancers are involved in process that occur late in B cell differentiation, including up-regulation of IgH expression and secretion, and class-switching (Zhang, 2003).
5.1 The murine 3’ IgH Regulatory Region (3’RR)
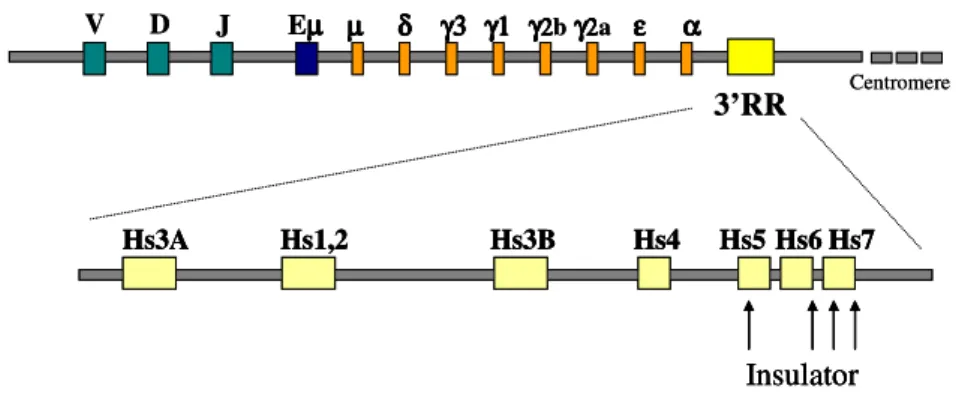
The murine 3’RR spans ∼ 28 kb downstream of Cα and harbours four enhancers, each associated with DNase I hypersensitivity : HS3a, HS1,2, HS3b and HS4 (Garrett et al, 2005). The first 3’IgH element to be identified, HS1,2, is located 13 kb downstream of the α gene membrane exon in the mouse. Whereas two DNase I-hypersensitive sites (HS1, HS2) were mapped within 3’αE, additional sites (HS3 and HS4) were identified 25 and 29 kb downstream of the α gene (Chauveau et al, 1998). The 3’ IgH regulatory region consists of a long palindrome, including two copies of the very same enhancer (HS3a and HS3b) duplicated in inverted orientation on both sites of the HS1,2 enhancer (Saleque et al, 1997). HS3A maps immediately 3’ of the Cα and upstream of HS1,2; while HS3b lies 13 kb downstream of HS1,2, and HS4 lies another 4 kb further 3’ (Ong et al, 1998). Finally, the 11-kb region immediately downstream of HS4 contained the DNase I hypersensitive sites HS5, HS6 and HS7, that have been hypothesized to serve as an insulator of the IgH locus; and several CTCF target sites, a protein associated with mammalian insulators.(Garrett et al, 2005) (Fig 5). Several studies revealed that the potential physiological function of these 3’ Igα enhancers includes regulation of the IgH locus rearrangement, transcription and Ig CSR, although additional roles could not be excluded. The individual HS fragments tested are able to synergize, although differentially, with the Vk, VH, and IgH germline promoters, including the
germline promoter for γ2b,γ3,α,and ε, and non-Ig promoters (such as the c-myc promoter) so as to enhance the promoter-directed transcription activity in transient transfection assays while demonstrating cell-type and development stage specificity (Zhang, 2003). In particular HS1,2 has been presented as specifically active in activated B lymphocytes and plasma cells and it is trans-activated by mitogens such as LPS and PMA in resting B cells (Laurencikiene et al, 2001; Andersson et al, 1998). HS3b and HS4 elements are essential in promoting both CRS and regulation of GT, and pair wise deletion of HS3b and HS4 had a dramatic effect on both the process (Pinaud
et al, 2001); while deletion of HS4 only has a moderate effect (Zhang et al, 2007). HS3a shows only weak enhancer activity. However, both pairs (HS3A-HS1,2 and HS3B-HS4) of enhancers efficiently increase expression of GL ε promoter (Laurencikiene et al, 2007). Based on transient transfection experiments, it was concluded that the four enhancers are rather
when their normal palindromic arrangement was in respected (Ong et al, 1998; Chauveau et al, 1998). Moreover, in stably transfected plasmacytoma cell lines, a cassette bearing HS1,2, HS3b, and HS4 could confer high-level, tissue–specific expression of a linked c-myc gene in a position-independent and copy-dependent manner, suggesting that the 3’ regulatory region could act as a LCR (Madisen and Groudine, 1994).
5.1.1 Regulation of murine 3’RR activity
During the immune response, B cells switch from expression of IgM to IgG, IgA or IgE. This process involves two events: activation of sterile GL transcripts from specific CH gene and DNA recombination. Gene targeting
experiments indicate that synthesis of GL transcripts is required for switch recombination to occur. External stimuli (cytokines or direct cell-cell contact) direct CSR to a particular CH gene via their ability to modulate GL
transcription. Different promoters can be activated by a different set of stimuli, in this way the specificity of CSR in response to external stimuli is assured. External signals have also varying effects on specific IgH locus
µ µ µ µ δδδδ γ3γ3γ3γ3 γ1γ1γ1γ1 γγγγ2b222 γγγγ2222a εεεε αααα 3’RR chromosome12 Eµµµµ J D V Hs3A Hs1,2 Hs3B Hs4 Hs5 Hs6 Hs7 Insulator Centromere µ µ µ µ δδδδ γ3γ3γ3γ3 γ1γ1γ1γ1 γγγγ2b222 γγγγ2222a εεεε αααα 3’RR chromosome12 Eµµµµ J D V Hs3A Hs1,2 Hs3B Hs4 Hs5 Hs6 Hs7 Insulator Hs3A Hs1,2 Hs3B Hs4 Hs5 Hs6 Hs7 Insulator Centromere
Fig. 5. Murine 3’ IgH Regulatory Region (3’RR). In the mouse IgH locus the
3’RR is located downstream of the Cα constant gene and harbours several DNase I hypersensitive sites (HS). HS3a, HS1,2; HS3b, and HS4 are enhancers involved in the expression and class switching of immunoglobulin heavy chain gene, while HS5, HS6 and HS7have been hypothesized to serve as an insulator of the IgH locus.
3’enhancers. Many transcriptional-binding sites have been identified in the 3’Igα enhancer regions, some of that confer the inducible activity of the enhancers by the external stimuli such as LPS, IL4, and αCD40, which activate the germline transcription (Laurencikiene et al, 2001).
HS1,2 contains several activation and repression elements. Proteins that bind E5; NF-κB; NFE; Oct; NF-αP (ets-like site), NF-AB (Ets/AP-1) motifs positively regulate HS1,2 in activated B and plasma cells (Laurencikiene et
al, 2001; Michaelson et al, 1996). The contribution of E5 site to enhancer activity is inhibited in early stage of development by the dominant negative regulator Id3, which is expressed in early B cells but downregulated in plasma cells (Mills et al, 1997; Zhang, 2003). NF-κB is a key regulator of B cell development. NF-κB subunits, especially p50 and c-Rel, have been shown to play critical and different roles in regulating B cell proliferation and CSR. It has been shown that p50 selectively augment HS1,2 activity in LPS activated B cells, whereas c-Rel is required for optimal HS1,2 induction in B cells activated through CD40 (Zelazowski et al, 2000). However additional transcription factors are required to allow NF-κB to act as a strong activator. For example, PU.1 interacts with NF-κB (p50/c-Rel) and the two proteins can co-operate to activate enhancer linked reporter genes (Linderson
et al, 2001). It was also been identified binding sites within the HS4 for NF-κB; Oct-1; Oct-2 and BSAP (Michaelson et al, 1996). BSAP has been shown to suppress HS1,2/HS4 activity in B cell lines that correspond to early differentiation stages. In contrast, there is evidence that HS1,2/HS4 activity is not blocked by BSAP in activated mature B cell. (Laurencikiene et al, 2001). NF-κB has been demonstrate to be important for the enhancer activity of HS4, as the HS4 fragment with the NF-κB mutation blocks the enhancer activity for c-myc promoter-directed transcription (Michaelson. et al, 1996). OCA-B is a coactivator for Oct-1 and Oct-2 also involved in the positive regulation of 3’ enhancers activity (Zhang, 2003). A number of HS3-binding common transcription factors such as OCT, NF-κB, and BSAP have been identified. In addition, YY1 is a specific activator for HS3 and Eµ enhancer. Retinoblastoma protein (Rb) inhibited the binding to HS3 in resting cells, while upon stimulation with class-switching activators, Rb becomes hyperphosphorylated, YY1 is released and can bind HS3 (Gordon et al, 2003). Therefore specific binding sites of the 3’enhancers may selectively interact with different promoter in a differential stage-specific manner; and specific factors seems to contribute to enhancer activity in different ways,
share binding of a common group of transcription factors (Michaelson et al, 1996). Epigenetic changes could also regulate the activity of the 3’ RR. Since before the discover of the structure of murine 3’RR became clear that the regulative region was hypermethylated in pre-B and T cell lines and became progressively demethylated as B cell differentiation continued (Giannini et al, 1993). Then, by measuring levels of acetylated histones H3 and H4 and of dimethylated H3 (K4) with chromatin immunoprecipitation assay, it was found that, early in B cell development, chromatin encompassing the enhancers of the 3’RR began to attain stepwise modifications typical of an open conformation (Garrett et al, 2005). It has been shown DNA methylation and histone modifications of the 3’RR are co-ordinately regulated only in B cells by the B cell-specific transcription factor BSAP and histone H1 (Giambra et al, 2008). The HS4 enhancer was associated with active chromatin initially in pro- and pre- B cells and then together with HS3A, HS1,2 and HS3b in B and plasma cells (Garrett et al, 2005). In contrast to HS4, the enhancers HS3a, HS1,2 and HS3b are demethylated only late in development, in particular demethlylation of HS1,2 was detect only in plasma cells (Giambra et al, 2008). A biphasic model for the activity of this region was proposed: one unit, consisting of the 3’-most enhancer, HS4, is active early and throughout B cell development. The second unit, which comprises HS3a, HS1,2 and HS3b, becomes active later in development, when it contributes to such processes as class switching and increased levels of Ig heavy chain gene transcription in plasma cells (Saleque et al, 1997).
Therefore the 3’RR enhancer’s activities and the specific stage and temporal activation patterns are governed by epigenetic mechanisms and proteins interacting with multiple binding sites identified within the individual elements (Andersson et al, 1998).
5.1.2 Long range activation by murine 3’RR
The 3’RR is a distal regulatory element undergoing the mechanism of long-range activation to stimulate the Ig heavy chain genes transcription. The transcription factor binding the enhancer may cooperate to form a specific activing surface. This surface would also interact with activating proteins in the promoter region and with the basal transcription machinery (Laurencikiene et al, 2001). Insertion of a PGK-neo cassette into the IgH locus short-circuits the ability of the 3’ IgH regulatory region to facilitate
germline transcription of dependent IgH genes upstream but not downstream the insertion. This observation support the existence of a long range 3’ IgH regulatory region required for Ig GL transcription and CSR to multiple IgH genes (Samara et al, 2006). The model of long range interaction of the LCR with the promoters is not clear. Recent studies show that VH-3’RR
interaction and myc-3’RR interactions involve a physical contact between the intervening DNA element, and a DNA looping process is postulated to occur (Ju et al, 2007). On the other hand, a looping model was excluded for the I-3’RR interaction, and a linking-tracking model was hypothesized to be the correct mechanism (Oruc et al, 2007). The long range interaction suggests that a chromatin remodelling mechanism and modification of the accessibility of the interacting surface occurs. Epigenetic changes are involved in CSR regulation and Ig GL transcription by cis-acting elements. Qin and Tang demonstrate that both LPS and CD40 signalling cause SWI/SNF complex (a complex altering nucleosome conformation in an ATP dependent manner) to dissociate from HS1,2 and associate with their responsive IγG2 GL promoter, suggesting a specific regulatory mode for the ATP-dependent chromatin remodeler during CSR. Increase of overall histone acetylation was parallel to the association of SWI/SNF complex at IγG2b GL promoter. Moreover, up-regulation of transcriptional activity in a linked c-myc gene by the murine 3’ RR enhancers is accompanied by a widespread increase in histone acetylation along the linked gene, indicating that the 3’ enhancers may regulate gene expression through histone hyperacetylation (Zhang, 2003).
5.2 The human 3’ IgH Regulatory Regions
The human and mouse enhancer elements in the 3’ regulatory regions share significant homology (Mills et al, 1997) and have been proposed to have similar functional properties. There are, however, significant differences (Sepulveda et al, 2005). The partial duplication encompassing the four gene γ3, γ1, ψε, α1 in apes did generate the cluster γ2, γ4, ε, α2 at the 3’ end of the ψγ gene around 60 million of years ago (Harindranath et al, 1998). The duplication of the cluster of the constant heavy genes in the evolution of primates creates new opportunities for the immunoresponse not only with a double repertoire of heavy genes but also with the new 3’
end of the Cα-2 gene (Mills et al, 1997) In respect to the mouse, HS3b enhancer element is absent and the 3’enhancers are organized differently (Sepulveda et al, 2005). The human α1 and α2 HS1,2 enhancers, known as HS1,2A and HS1,2B respectively, both reside near the centers of ∼10 kb palindromes, with each palindrome closely flanked by a single copy of HS3 immediately adjacent to the 5’end and an HS4 unit located ∼4kb downstream (HS3-HS1,2-HS4) (Hammarstrom et al, 2007) (Fig. 6). The different arrangement of the 3’α enhancers in mice and human (HS3A-HS1,2-HS3B-HS4 versus HS3-HS1,2-(HS3A-HS1,2-HS3B-HS4) may cause some functional differences in these control region. The genomic structure and the sequence of two 3'RRs is highly conserved (Fig. 7). The major structural difference between the RR-1 and RR-2 is that the DNA segment contains HS1,2 is inverted between the two loci (Mills et al, 1997). The 3’ human enhancers might be regulated differentially from that of the equivalent mouse enhancer. Similarly to the mouse, human HS4 is active from the early stages of the B cell lineage onward, but, unlike the murine model, BSAP binding is not an essential feature for HS4 activation in human pre-B (Mills et al, 1997). HS1,2A and HS1,2B fragments show equally strong enhancer activity on the GL α1 e α2 promoters in both orientations when transiently transfected into a mature B cell line. However, there is no activity in human pre-B cell line and T cell line. HS3 shows no enhancer activity by itself in any of the cell lines, whereas a modest effect is noted using HS4 in the three mature B cell lines. However, the combination of the α2HS3-HS1,2-HS4 fragments, which together form a potential locus control region, display a stronger enhancer activity than the individual fragments on α1, α2, and γ3 promoters; with a different effect on the α1 and α2 promoters as compared with the γ3 promoter (Hu et al, 2000).
The human HS1,2 elements are the strongest enhancers of the 3’RRs. The transcription factor HoxC4,Oct-1/Oct-2 (homeodomain proteins) and the coactivator Oca-B act synergistically to effect the HS1,2 enhancing activity. The complex recruitment is negligible in pro-B cells, moderate in pre-B cells and maximal in germinal center B cells and plasma cells, where HoxC4, Oct-1/Oct-2/OcaB expression correlates with HS1,2 activation (Kim et al, 2004). As HS1,2 carries a dominant role over HS3 and HS4 in the overall activity of the 3’RR, the structure and the function of HS1,2A and HS1,2B enhancers have been further investigated.
µ µ µ µ δδδδ γ3γ3γ3γ3 γ1γ1γ1 ψγ1ψψψεεεεα1α1α1α1 RR-1 Centromere chromosome14 Eµµµµ J D V α2 α2α2 α2 RR-2 γ4 γ4 γ4 γ4 γ2 γ2 γ2 γ2 ψ ψ ψ ψγγγγ εεεε HS3 HS1,2A HS4 HS3 HS1,2B HS4 µ µ µ µ δδδδ γ3γ3γ3γ3 γ1γ1γ1 ψγ1ψψψεεεεα1α1α1α1 RR-1 Centromere chromosome14 Eµµµµ J D V α2 α2α2 α2 RR-2 γ4 γ4 γ4 γ4 γ2 γ2 γ2 γ2 ψ ψ ψ ψγγγγ εεεε HS3 HS1,2A HS4 HS3 HS1,2A HS4 HS3 HS1,2B HS4 HS3 HS1,2B HS4 3’ µ µ µ µ δδδδ γγγγ3 γγγγ1 ψεψε αψεψε αα1α γγγγ2 γγγγ4 εεεε αα2αα HS3 HS3 HS1,2A HS1,2B HS4 HS4 crip1 hole crip2 mta1 5’
RR-1
AL928768 AL928762 AL928767 AL928765
HS3 U4 U5 R3 HS1,2A U1 U2 U3 U6 U7 U8 K10 retrovirus R1 R2 α1 HS4 R3i U6i Ua2 R5 Ua3 U10 Ua4 U11 Alu LTR ELK2 R4 U9 U7i R6 U12 R7 U13
R8 U14 U15 U16
NT_026437.11(35.6 kb) NT_026437.11(40 kb)
RR-2
End of omology with RR-1 α2 HS3 U2 U4 U5 R3 HS1,2B R3r U5r U1R1 U3 U6 U7 U8r U6r HS4 Ub1 U4-5 R3 U7r Ub2 R4 U9 R5 Ub3 U10 R5 U11 U12 R6 Alu U15 U16 LTR U14 U13 Ub4 AL 928742
End of omology with RR-2
Simple Repeats Enhancer
Conserved sequence in RR1 and RR2
3’ µ µ µ µ δδδδ γγγγ3 γγγγ1 ψεψε αψεψε αα1α γγγγ2 γγγγ4 εεεε αα2αα HS3 HS3 HS1,2A HS1,2B HS4 HS4 crip1 hole crip2 mta1 5’
RR-1
AL928768 AL928762 AL928767 AL928765
HS3 U4 U5 R3 HS1,2A U1 U2 U3 U6 U7 U8 K10 retrovirus R1 R2 α1 HS4 R3i U6i Ua2 R5 Ua3 U10 Ua4 U11 Alu LTR ELK2 R4 U9 U7i R6 U12 R7 U13
R8 U14 U15 U16
NT_026437.11(35.6 kb) NT_026437.11(40 kb)
RR-2
End of omology with RR-1 α2 HS3 U2 U4 U5 R3 HS1,2B R3r U5r U1R1 U3 U6 U7 U8r U6r HS4 Ub1 U4-5 R3 U7r Ub2 R4 U9 R5 Ub3 U10 R5 U11 U12 R6 Alu U15 U16 LTR U14 U13 Ub4 AL 928742
End of omology with RR-2 3’ µ µ µ µ δδδδ γγγγ3 γγγγ1 ψεψε αψεψε αα1α γγγγ2 γγγγ4 εεεε αα2αα HS3 HS3 HS1,2A HS1,2B HS4 HS4 crip1 hole crip2 mta1 5’
RR-1
AL928768 AL928762 AL928767 AL928765
HS3 U4 U5 R3 HS1,2A U1 U2 U3 U6 U7 U8 K10 retrovirus R1 R2 α1 HS4 R3i U6i Ua2 R5 Ua3 U10 Ua4 U11 Alu LTR ELK2 R4 U9 U7i R6 U12 R7 U13
R8 U14 U15 U16
NT_026437.11(35.6 kb) NT_026437.11(40 kb)
RR-2
End of omology with RR-1 α2 HS3 U2 U4 U5 R3 HS1,2B R3r U5r U1R1 U3 U6 U7 U8r U6r HS4 Ub1 U4-5 R3 U7r Ub2 R4 U9 R5 Ub3 U10 R5 U11 U12 R6 Alu U15 U16 LTR U14 U13 Ub4 AL 928742
End of omology with RR-2
µ µ µ µ δδδδ γγγγ3 γγγγ1 ψεψε αψεψε αα1α γγγγ2 γγγγ4 εεεε αα2αα HS3 HS3 HS1,2A HS1,2B HS4 HS4 crip1 hole crip2 mta1 5’
RR-1
AL928768 AL928762 AL928767 AL928765
HS3 U4 U5 R3 HS1,2A U1 U2 U3 U6 U7 U8 K10 retrovirus R1 R2 α1 HS4 R3i U6i Ua2 R5 Ua3 U10 Ua4 U11 Alu LTR ELK2 R4 U9 U7i R6 U12 R7 U13
R8 U14 U15 U16
NT_026437.11(35.6 kb) NT_026437.11(40 kb)
RR-2
End of omology with RR-1 α2 HS3 U2 U4 U5 R3 HS1,2B R3r U5r U1R1 U3 U6 U7 U8r U6r HS4 Ub1 U4-5 R3 U7r Ub2 R4 U9 R5 Ub3 U10 R5 U11 U12 R6 Alu U15 U16 LTR U14 U13 Ub4 AL 928742
End of omology with RR-2
Simple Repeats Enhancer
Conserved sequence in RR1 and RR2 Simple Repeats
Enhancer
Conserved sequence in RR1 and RR2 Enhancer
Conserved sequence in RR1 and RR2 A
5.2.1 Polymorphic structure of the HS1,2A and HS1,2B enhancers
Among the enhancers, only HS1,2 show polymorphic features, while HS3 and HS4 polymorphism were not described. Perhaps the generation of HS1,2 multiple alleles both in rodents and humans has likely been favoured by its central position within a large palindromic region (Guglielmi et al, 2004). The HS1,2A enhancer is located 9kb downstream of the human α1 gene, while HS1,2B is located 11 kb downstream the α2 gene. The selective amplification and cloning of HS1,2A and –B enhancers revealed the occurrence of four alleles of HS1,2A (1A; 2A; 3A; 4A)1 and two alleles of HS1,2B (3B; 4B). The polymorphic sequences are present immediately at the 3’ to the core of the enhancer. The alleles vary on the number of copies (one to four) of a conserved 38-bp element. The repetitions of the 38-bp element are separated by variable spacers of 20 ,16, and 14bp. In all alleles, the polymorphic sequences are bordered by two external 17-bp elements, with exception of alleles 3B, 4A and 4B. In these alleles, the external 17-bp element next to the core of enhancer HS1,2 is replaced by a 31-bp element (Giambra et al, 2005) (Fig. 7). The 135-bp HS1,2 core homology sequence contains motif important for B cell-specific enhancer’s activity identical to the murine AP1, OCT, E5, ETS, although their function has not yet been demonstrated. Additional binding sites for several transcription factors are situated outside the core, within the polymorphic sequence (Mills et al, 1997). An obvious consequence of different HS1,2 alleles resides in the variation of the number of copies of the consensus sequences for several transcription factors. The number of sites for NF-κB/P50 varies from one to four in the six alleles (Giambra et al, 2005). This can be of primarily importance because different HS1,2 alleles can influence HS1,2 activities in
1 In this thesis we refer to the HS1,2A alleles simply as 1, 2, 3 and 4.
Fig. 6. Human 3’ IgH Regulatory Regions (3’RR-1 and 3’RR-2). (A) In the human IgH
locus two 3’RR (3’RR-1 and 3’RR-2) are located downstream of each Cα constant gene (Cα1 and Cα2). Each regulative region harbour three enhancer elements: HS1,2; HS3; and HS4. HS1,2A element of RR-1 is inverted in respect HS1,2B element of RR-2. (B) The genomic structure and the sequence of two 3'RRs is highly conserved. The human 3’RRs consist of simple repeated (R); unique sequence conserved (U) and unique sequences specific for RR-1 (Ua) or RR-2 (Ub). The enhancers elements, the coding regions (i.e. ELK2) or other elements (i.e. ALU) are also shown. Four genes (hole, crip1, crip2, mta1) maps at the 3’ end of RR-2.
the regulation of germline transcription and immunoglobulin production. Preliminary data have shown that HS1,2A RFLP polymorphism contribute to the genetic predisposition to several diseases characterized by alteration of B cell activation and Ig production.
5.2.2 Functional role of the HS1,2A enhancer
Even before the discover of HS1,2A allelic polymorphism, a significant association between several HS1,2A genotype and circulating levels of IgA1
Allele *1A Sp. 17bp CORE enhancer Sp. 17bp Rp. 38bp Sp. 14bp Allele *2A Sp. 16bp Allele *3A Allele *4A Allele *4B Sp. 20bp Allele *3B Sp. 31bp Internal spacers Conserved sequence Unit Core of enhancer HS1,2 External element - 31 bp Repeated element - 38 bp External element -17 bp
14bp 16bp 20bp
Sites for :IK2; NF-kB (P50).
Sites for :CEBP; CETS1P54 (-); CMYB; HSF; MEF2; OCT1; SR-Y; STAT; TH1E47; YY1(-)
Sites for : AP4; E47; MYOD; µµE5.µµ
Sites for : NF-kB. Sites for : CMYB. Allele *1A Sp. 17bp CORE enhancer Sp. 17bp Rp. 38bp Sp. 14bp Allele *2A Sp. 16bp Allele *3A Allele *4A Allele *4A Allele *4B Allele *4B Sp. 20bp Allele *3B Sp. 31bp Internal spacers Conserved sequence Unit Core of enhancer HS1,2 External element - 31 bp Repeated element - 38 bp External element -17 bp 14bp 16bp 20bp 14bp 16bp 20bp
Sites for :IK2; NF-kB (P50).
Sites for :CEBP; CETS1P54 (-); CMYB; HSF; MEF2; OCT1; SR-Y; STAT; TH1E47; YY1(-)
Sites for : AP4; E47; MYOD; µµE5.µµ
Sites for : NF-kB. Sites for : CMYB. Sites for :IK2; NF-kB (P50). Sites for :IK2; NF-kB (P50).
Sites for :CEBP; CETS1P54 (-); CMYB; HSF; MEF2; OCT1; SR-Y; STAT; TH1E47; YY1(-) Sites for :CEBP; CETS1P54 (-); CMYB; HSF; MEF2; OCT1; SR-Y; STAT; TH1E47; YY1(-)
Sites for : AP4; E47; MYOD; µµE5.µµ
Sites for : AP4; E47; MYOD; µµE5.µµ
Sites for : NF-kB. Sites for : NF-kB. Sites for : CMYB. Sites for : CMYB.
Fig. 7. HS1,2A and HS1,2B alleles. There are four HS1,2A alleles (1A; 2A; 3A; 4A)
and two HS1,2B alleles (3B; 4B). The core of enhancer, the repeated element of 38 bp, the external elements of 31 and 17 bp and the internal spacers of 14, 16, and 20 bp are mapped. Binding sites for several transcription factors are shown (Giambra V. et al, 2005).
associated with HS1,2A polymorphism, in particular one allele is significantly correlated with a milder form of the disease, whereas another one is associated with severe evolution leading to renal failure (Aupetit. et
al, 2000). The mechanism leading to IgA dsyregulation is not known, although lymphocyte proliferation and Ig production, or hyper-production, could be related to cytokines inducing NF-κB recruitment. So NF-κB could modulate the function of HS1,2A polymorphism leading to the different clinic features of the disease. Following studies show that homozygosity of allele 2 in Celiac Disease, which is an autoimmune disease characterized by a dysregulation of IgA antiendomysium antibodies (anti-EMA), increase of 30. 8% as compared to the control group (Frezza et al, 2004). Moreover, a recent study on systemic sclerosis (SSc), an autoimmune disease characterized by an important B cell activation, shows an increased frequency of the allele 2 in the group of patients high significant in respect to the control groups (Frezza et al, 2007) These data suggest an intriguing function of HS1,2A polymorphism in the regulation of B cell activation and Ig production. One aim of this work is to investigate the role of HS1,2A polymorphism as genetic factor increasing the risk to develop several diseases associated with alteration of B cell functions (see below).
5.2.3 World distribution of the HS1,2A allele frequencies
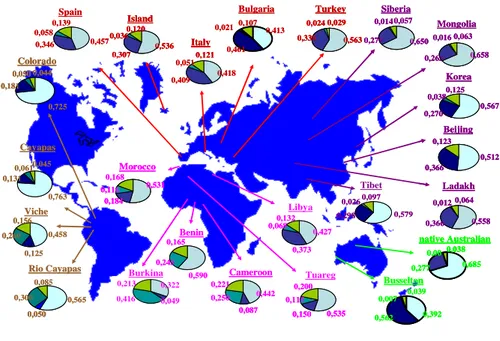
The involvement of HS1,2A in the predisposition to several immune disorders have led to know the distribution of HS1,2A variants in population from different continents, and to determine whether the polymorphism is associated to specific evolutionary factors. HS1,2A alleles 3 and 4 show the highest frequencies among African populations, and allele 2 is significantly lower in Africa in comparison with both European and, to a lesser extend, Asian population. HS1,2A allele 1 does not seem to differentiate the major human groups. Analysis of molecular variance of the allele frequencies indicate that HS1,2A polymorphism can be considered as a reliable anthropogenetic marker (Unpublished data; Giambra et al, 2006) (Fig. 8). This enhances the importance of this polymorphism in epidemiological studies related to immune-disorders, especially in view of the current environmental modifications, such as changes in diet, and exposure to pesticides, poisons, and particular drugs, to which these peoples could go towards. On the other hand, HS1,2B allelic frequencies are not variable across the continents.
One aim of this work is to investigate HS1,2A allelic distribution in several Italian regions in order to understand the genetic micro-variation of the whole of Italy. Another aim is to study the distribution of HS1,2A alleles in several European healthy populations living in geographic isolation condition in order to verify if inter-population genetic flux is impaired by natural barriers. Mongolia 0,658 0,263 0,016 0,063 Ladakh 0,558 0,366 0,012 0,064 Siberia 0,650 0,279 0,014 0,057 0,168 0,531 0,116 0,184 Morocco 0,213 0,322 0,416 0,049 Burkina 0,590 0,165 0,245 Benin 0,221 0,442 0,250 Cameroon 0,087 0,200 0,535 0,115 0,150 Tuareg 0,427 0,068 0,373 Libya 0,132 Beijing 0,512 0,123 0,366 Korea 0,567 0,270 0,0380,125 0,536 0,307 0,0360,120 Island 0,409 0,418 0,051 0,121 Italy 0,338 0,563 0,024 0,029 Turkey 0,457 0,346 0,058 0,139 Spain Cayapas 0,131 0,763 0,0610,045 Colorado 0,050 0,044 0,725 0,181 Rio Cayapas 0,565 0,300 0,050 0,085 Viche 0,458 0,125 0,260 0,156 Tibet 0,579 0,298 0,0260,097 Bulgaria Busselton 0,392 0,039 0,007 0,562 native Australian 0,685 0,277 0,000,038 0,413 0,107 0,021 0,461 Mongolia 0,658 0,263 0,016 0,063 Mongolia 0,658 0,263 0,016 0,063 Ladakh 0,558 0,366 0,012 0,064 Ladakh 0,558 0,366 0,012 0,064 Siberia 0,650 0,279 0,014 0,057 Siberia 0,650 0,279 0,014 0,057 0,168 0,531 0,116 0,184 Morocco 0,168 0,531 0,116 0,184 Morocco 0,531 0,116 0,184 Morocco 0,213 0,322 0,416 0,049 Burkina 0,590 0,165 0,245 Benin 0,590 0,165 0,245 Benin 0,221 0,442 0,250 Cameroon 0,087 0,221 0,442 0,250 Cameroon 0,087 0,200 0,535 0,115 0,150 Tuareg 0,200 0,535 0,115 0,150 Tuareg 0,427 0,068 0,373 Libya 0,132 0,427 0,068 0,373 Libya 0,132 Beijing 0,512 0,123 0,366 Beijing 0,512 0,123 0,366 Korea 0,567 0,270 0,0380,125 Korea 0,567 0,270 0,0380,125 0,536 0,307 0,0360,120 Island 0,536 0,307 0,0360,120 Island 0,409 0,418 0,051 0,121 Italy 0,409 0,418 0,051 0,121 Italy 0,338 0,563 0,024 0,029 Turkey 0,338 0,563 0,024 0,029 Turkey 0,457 0,346 0,058 0,139 Spain Cayapas 0,131 0,763 0,0610,045 Cayapas 0,131 0,763 0,0610,045 Colorado 0,050 0,044 0,725 0,181 Colorado 0,050 0,044 Colorado 0,050 0,044 0,725 0,181 Rio Cayapas 0,565 0,300 0,050 0,085 Rio Cayapas 0,565 0,300 0,050 0,085 Viche 0,458 0,125 0,260 0,156 Viche 0,458 0,125 0,260 0,156 Tibet 0,579 0,298 0,0260,097 0,579 0,298 0,0260,097 Bulgaria Busselton 0,392 0,039 0,007 0,562 Busselton 0,392 0,039 0,007 0,562 native Australian 0,685 0,277 0,000,038 native Australian 0,685 0,277 0,000,038 native Australian 0,685 0,277 0,000,038 0,413 0,107 0,021 0,461
Fig. 8. World distribution of the HS1,2A allele frequencies. The HS1,2A allele
frequencies vary through world populations according to the belong to geographical groups.
6. Genetic variants: polymorphisms and haplotypes
Genetic factors are known to have an important role in many common diseases, and the identification of genetic determinant for such disease could provide insight into disease pathogenesis, revealing new therapeutic strategies (Kingsmore et al, 2008). More than thousand genes for heritable “mendelian” disorders have been identified, in which variation in a single gene is both necessary and sufficient to cause disease. Common disorders, in contrast, are thought to be determining by the combined effects of many different DNA variants interacting with environmental factors (The International Hap Map Consortium, 2005). The case-control analysis compares the allelic frequency differences of a particular polymorphism between the case and the control groups. There are various type of polymorphisms such as deletions, insertions, restriction fragment length polymorphisms (RFLP) and single nucleotide polymorphism (SNP).
Single nucleotide polymorphisms (SNP) are the most common form of the genetic variation in the human genome. In the recent years, there has been a growing interest in using SNPs to map the susceptibility genes for complex disease (Lee et al, 2005). However, usually complex diseases have relatively low genetic components and multiple genes involved in pathogenesis. The human genome has about 10 million of SNPs, so the determination of the SNPs influencing a common disease could appear very difficult. Thankfully, there are often strong statistical associations among polymorphisms in the human genome, such that the presence of a particular variant at one site on a chromosome can predict the presence of a particular variant at another site. This correlation is known as linkage disequilibrium (LD); a particular combination of allele along the chromosome is termed “haplotype”. (Goldstein and Cavalleri, 2005). In the recent years the International Hap Map Consortium developed the HapMap Project which has had the purpose to discover the association between these variants. Thanks to HapMap project 3.1 million SNPs have been genotyped from 269 DNA samples. The resulting HapMap has a SNPs density of around one per Kilobase and is estimed to contain approximately 25-35% of all the 9-10 million common SNPs (minor allele frequency (MAF)≥0.05) of the human genome (The International Hap Map Consortium, 2005; The International Hap Map Consortium, 2007).
Genome-wide association studies (GWA) use SNPs data from the HapMap project to investigate on allelic frequency differences between cases and controls (Kruglyak, 2008). A recent work has examined around 14000 cases (2000 individuals for each of 7 common disease) and a shared set of around 3000 controls, observing association at many previously identified loci and discovering several additional susceptibility ones (The Wellcome Trust Control Consortium, 2007).
Even if the Hap Map projects have had been useful for the investigation on common variants, the rare ones will be more difficult to discover. Moreover, the variants within one Kb region will not be detected. These variants can be identified only by genome re-sequencing. In addition, whereas recognition of functional variants in coding regions is easy, detecting functional change in non-coding DNA is more difficult. This is because we do not have a ready connection between nucleotide differences and function for these sequences, and because regulatory regions can be located far from the coding region so are often difficult to identify (Kruglyak, 2008). Therefore, genetic predisposition conferred by non-coding regions such as LCR; enhancer or other regulative regions have been poorly investigated. Nonetheless, it could be very interesting to understand how sequence change can influence regulative region function. Polymorphisms or haplotypes could affect epigenetic change or transcription factor binding to 3’RR, influencing the regulative region activity in Ig germline transcription, CSR stimulation and Ig production. In this light, 3’ regulatory region polymorphisms and haplotypes could contribute to predisposition to autoimmune disease or other diseases characterized by a dysregulation of Ig production.
The central aim of my thesis is to investigate the role of HS1,2A polymorphism and other genetic variants of the 3’RR-1 in the immunity-system dysregulation of several diseases. Case-control analysis was performed comparing HS1,2A allelic frequencies of several immunological diseases in respect to the control groups. Moreover, the correlation of HS1,2A allele frequencies with the alteration of serum Ig concentrations in two different groups was investigated. The role of HS1,2A polymorphism in the progression of viral infections was also evaluated.
Finally, genome re-sequencing of the non-coding regions surrounding HS3 and HS1,2A enhancers was performed in order to discover polymorphisms and haplotypes associated with HS1,2A alleles in a control group and in a cohort of psoriatic patients.
7. Immunological diseases
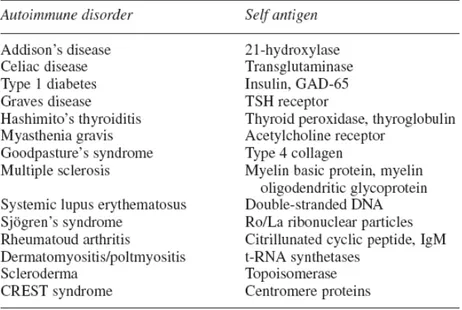
7.1 Autoimmune diseasesAutoimmune diseases (AID) are complex multisystem and multifactorial disorders. While many cell types participate and contribute to the autoimmune disorders, lymphocytes are the key regulators in the initiation and propagation of the autoimmune response. The production of pathogenic autoantibodies during an autoimmune response is an indication that one or more autoreactive B cell clones have circumvented central and/or peripheral tolerance check-points (Diamant and Melamed, 2004). Autoantibodies might not be directly responsible for many of the manifestations of autoimmune disease, but they are markers of possible future disease in presently healthy individuals (Tab. 1). Susceptibility to autoimmune disease is a multigenic phenotype affected by a variety of changeable factors as microbiological factors, smoking, diet, Vitamin D deficiency, Ultraviolet light exposure and psychological stress; and unchangeable factors such as autoantibodies, genetics factors and primary autoimmune disorders (Shepshelovich and Shoenfeld, 2006).
Numerous studies have proved that the genetic predisposition is a main factor in the susceptibility to develop AID. The heritage model of AID is complex and multiple genes are involved in its aetiology.
The most potent genetic influence on susceptibility to autoimmunity is the Major Histocompatibility Complex (MHC). The human MHC is rather small (3.6Mb), but it is densely packed with immunologically important genes in strong linkage disequilibrium with each other. More than 30 autoimmune disease show association with alleles of the ancestral HLA haplotype 8.1 (Lie and Thorsby, 2005). On the other hand, different HLA alleles are often linked to different autoimmune diseases (Tab. 2). The class II MHC allele HLA-DR4 and related alleles are known to be the major genetic risk factors for rheumatoid arthritis (RA). Early studies showed that 70% of patients with classic RA express HLA-DR4 compared with 28% of control individuals (Shepshelovich and Shoenfeld, 2006).
However, genetic predisposition conferred by HLA is not enough to the development of the autoimmune disorders. AIDs are complex diseases that require the confluence of many genes and environmental factors. Linkage studies done both in humans as in rodents have clearly indicated that non-MHC genes also contribute to the susceptibility to develop AID. (Serrano et
al, 2006). A new finding indicates that several polymorphisms affect multiple autoimmune diseases. OCTN haplotype is associated both with Crohn’s Disease (CD) and psoriatic arthritis (PA), suggesting that these 2 diseases may share some common genetic control in pathways of inflammation (Hon et al, 2005). On the other hand several pathophysiological mechanisms are specific to a particular disease. IBD5 risk haplotype within the chromosome 5q31-33 is associated with CD only (Armuzzi et al, 2003), while two distinct risk haplotypes for psoriasis on the same chromosomal region have been identified (Li et al, 2008).
In the last years GWA studies have proven powerful in identifying SNPs that are significantly associated with multi-factorial diseases. A number of putative susceptibility loci for various autoimmune diseases have been identified, but in many cases the contribution of these areas to disease phenotype are unknown. Obviously, the effect of genetic factors on the development of autoimmune disorders could not be overestimated. The presence of a specific autoantibody in an individuals serum combined with MHC haplotypes or other susceptibility loci increases exponentially the risk for that person to develop an autoimmune disease in the future. The identification of the genes and genetic pathways involved in these diseases will allow elucidating the mechanism triggering the pathogenesis and open the possibility to new therapeutic options.
One aim of this work is to study HS1,2A polymorphism association with several autoimmune disease such as organ-specific illnesses (dermatitis
herpetiformis) and systemic illnesses (rheumatoid arthritis, systemic lupus erythematosus, crohn’s disease and psoriasis).
Tab. 1. Selected autoimmune disease and characteristic autoantigens.
(Shepshelovich and Shoenfeld, 2006)
Tab. 2. MHC antigens and related autoimmune disease
7.1.1 Organ-specific illnesses
Dermatitis herpetiformis (DH) is a multi-factorial cutaneous disease like psoriasis and psoriatic arthritis. Patients with DH, which is sometime referred to as the cutaneous phenotype of CD, have asymptomatic or frank CD and a skin rash with anti-transglutaminase cutaneous IgA deposits. CD and DH both show anti-transglutaminase type 2 (TGM2) autoantibodies. So CD and DH are closely related disease which share a genetic background and a common pathogenesis characterized by gluten sensitivity and production of auto-antibodies (Karrell et al, 2002; Hervonen et al, 2000). HS1,2A polymorphism association with CD has previously been evaluated. In this thesis we investigated the role of the polymorphism as genetic factor increasing the risk to develop DH.
7.1.2 Systemic illnesses
Rheumatoid arthritis is a systemic autoimmune disease characterized by chronic inflammation of senovial tissue that often leads to a progressive joint destruction. RA patients can be divided into two cohorts: patients with early RA (ERA, disease duration<12 months) and patients with long disease duration (more than one years disease duration, long standing RA (LSRA). Studies in twins clearly show a genetic contribution to disease susceptibility (MacGregor et al, 2000)), and the most important genetic risk factor is HLA region (MacGregor et al, 1995; Huizinga et al, 2005), even if other important genetic associations have been evaluated (Begovich et al, 2004; Johansson et al, 2006). Since CSR could be important in autoimmune chronic inflammatory diseases (ACIDs) we tested the hypothesis that the HS1,2A locus polymorphism could be involved in RA pathogenesis, influencing a small or long disease duration.
Psoriasis (PS), a clinically heterogeneous disease with inherited susceptibility, is considered a T-cell mediated inflammatory skin disease, but humoral immune process has also been evaluated. PS has been variously reported associated with IgA-related disorders, such as CD, DH, IgA nephropathy and others (Lapeyre et al, 2006; Kallel Selami et al, 2006; Zadrazil et al, 2006). Up to 16% of psoriatic patients show presence of IgG and IgA celiac associated antibodies (antiendomysial, antigliadin,