UNIVERSITÀ DEGLI STUDI DEL PIEMONTE ORIENTALE
“AMEDEO AVOGADRO”
Dipartimento di Medicina Traslazionale
Corso di Dottorato di Ricerca in Medicina Clinica e Sperimentale
Ciclo XXVII
Hemodynamic evaluation of ICU patients
undergoing partial ventilatory assistance: role of asynchrony.
Settore Scientifico Disciplinare: Anestesiologia (MED41)
Coordinatore Tutor Prof.ssa Marisa Gariglio Prof. F.Della Corte
Dottorando Dott. Antonio Messina
PHYSIOLOGICAL BACKGROUND ... 3
INTRODUCTION ... 3
HOW TO PREDICT FLUID RESPONSIVENESS IN CRITICALLY ILL PATIENTS? ... 5
RESPIRATORY CHANGES IN LV STROKE VOLUME IN MECHANICALLY VENTILATED PATIENTS ... 6
RESPIRATORY CHANGES IN SYSTOLIC PRESSURE ... 8
RESPIRATORY CHANGES IN PULSE PRESSURE ... 9
LIMITATIONS OF PPV ... 12
ROLE OF ASYNCHRONY ... 14
ROLE OF ECHOCARDIOGRAPHY IN THE EVALUATION OF HEMODYNAMICALLY UNSTABLE ICU PATIENTS. .. 15
PATIENT-‐VENTILATOR ASYNCHRONY AFFECTS PULSE PRESSURE VARIATION PREDICTION OF FLUID RESPONSIVENESS DURING PRESSURE SUPPORT. ... 17
INTRODUCTION ... 18 METHODS ... 20 RESULTS ... 23 DISCUSSION ... 24 CONCLUSIONS ... 27 TABLES ... 28 FIGURES ... 31
TRANS-‐THORACIC ECHOCARDIOGRAPHIC ASSESSMENT OF CARDIAC OUTPUT IN MECHANICALLY VENTILATED CRITICALLY ILL PATIENTS BY ICU PHYSICIANS. ... 33
INTRODUCTION ... 34 METHODS ... 36 RESULTS ... 38 DISCUSSION ... 39 CONCLUSIONS ... 42 FIGURES ... 43 REFERENCES ... 45
PHYSIOLOGICAL BACKGROUND
Introduction
Volume expansion is a frequently used therapy in critically ill patients with acute circulatory failure. The expected haemodynamic benefit of volume expansion is an increase in left ventricle (LV) LV stroke volume, and hence in cardiac output. The relationship described by Frank and Starling between preload and stroke volume is not linear, but rather is curvilinear (Fig. 1)1, 2. Thus, an increase in preload will induce a significant increase in stroke volume only if
the ventricle operates on the ascending portion of the relationship (condition of ventricular preload dependence). In contrast, if the ventricle operates on the flat portion of the curve, a similar increase in preload will not induce any significant change in stroke volume (condition of preload independence). Therefore, a patient is a ‘responder’ to volume expansion only if both ventricles operate on the ascending portion of the Frank–Starling curve (biventricular preload dependence). In contrast, if one of the ventricle or both ventricles operate on the flat portion of the curves, then the patient is a ‘non-‐responder’ (ie his/her cardiac output will not increase significantly in response to volume expansion)3.
Figura 1. Schematic representation of Frank–Starling relationships between ventricular preload and stroke volume in a normal heart (A) and in a failing heart (B). A given value of preload can be associated with preload dependence in a normal heart or with preload independence in a failing heart.
In normal physiological conditions, both ventricles operate on the ascending portion of the Frank–Starling curve. This mechanism provides a functional reserve (preload reserve) to the heart in situations of acute stress. In normal individuals, increase in preload was reported to result in a significant change in stroke volume. In contrast, analysis of the literature indicates that, in patients with acute circulatory failure, the mean rate of responders to volume expansion is only around 50% 3. This finding emphasizes the need for predictive factors
of volume expansion efficacy in order to select patients who could benefit from volume expansion and to avoid ineffective or even deleterious fluid therapy (worsening of pulmonary oedema, haemodilution, etc) in ‘nonresponder’ patients, in whom inotropic and/or vasopressor support should preferentially be used3.
How to predict fluid responsiveness in critically ill patients?
In many patients with acute circulatory failure, a positive response to fluid therapy can be observed despite the lack of clinical and biological indicators of hypovolaemia. Therefore, bedside indicators of right ventricle (RV) or LV preload are usually used when deciding whether to give fluid.
A recent postal survey performed in Germany showed that central venous pressure and pulmonary artery occlusion pressure are used, respectively, by 93 and 58% of intensive care unit physicians in the decision-‐making process regarding volume expansion4. However, many
clinical studies have emphasized the poor value of right atrial pressure and pulmonary artery occlusion pressure in predicting volume expansion efficacy. Indeed, in most studies, the mean baseline value of right atrial pressure and of pulmonary artery occlusion pressure was not significantly different between responders and non-‐ responders to volume expansion4.
Even when a significant difference was reported, a marked overlap of individual baseline values was observed, so that no threshold value could help to discriminate responder and non-‐ responder patients. Other bedside indicators of preload, such as the RV end-‐diastolic volume (evaluated by thermodilution) and the LV end-‐diastolic area (measured by echocardiography) have also been tested as predictors of fluid responsiveness. Unfortunately, these parameters were not found to be able to differentiate accurately between responder and non-‐responder patients before fluid infusion was given.
All of these findings may be explained as follows. The right atrial and pulmonary artery occlusion pressures do not always reflect transmural pressures in patients with external or intrinsic positive end-‐expiratory pressure (PEEP). Pulmonary artery occlusion pressure is not always a good indicator of LV preload, in particular in patients with a decreased LV compliance. Measurement of RV end-‐diastolic volume by thermodilution is influenced by tricuspid regurgitation, which is frequently encountered in critically ill patients with pulmonary hypertension. LV end-‐diastolic area is not always a good indicator of the LV end-‐diastolic volume, and hence of the LV preload. RV dilatation may offset any beneficial haemodynamic effect of volume expansion, even in case of a low LV preload. Finally, the preload-‐induced changes in stroke volume depend also on contractility and afterload. For example, a given
value of preload can be associated with preload dependence in normal hearts or with preload independence in failing hearts (Fig. 1). Therefore, assessment of preload is of poor value in predicting fluid responsiveness in critically ill patients4.
Respiratory changes in LV stroke volume in mechanically ventilated patients
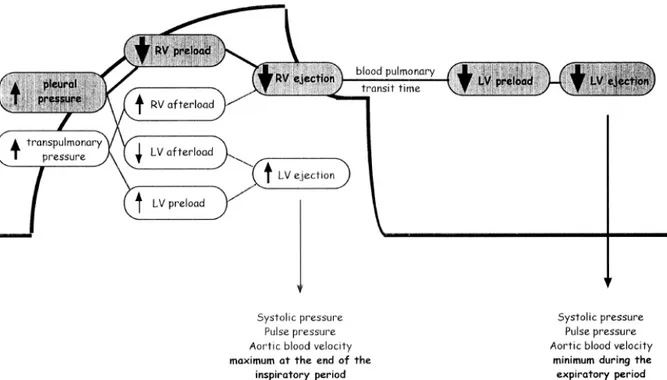
In mechanically ventilated patients, the magnitude of the respiratory changes in LV stroke volume can be used to assess fluid responsiveness. Intermittent positive-‐pressure ventilation induces cyclic changes in the loading conditions of right and left ventricles (Fig. 2). Mechanical insufflation decreases preload and increases afterload of the right ventricle4. The RV preload reduction is due to the decrease in the venous return pressure gradient that is related to the inspiratory increase in pleural pressure. The increase in RV afterload is related to the inspiratory increase in transpulmonary pressure (alveolar minus pleural pressure)4. The
reduction in RV preload and the increase in RV afterload both lead to a decrease in RV stroke volume, which is therefore at its minimum at the end of the inspiratory period. The inspiratory impairment in venous return is assumed to be the main mechanism of the inspiratory reduction in RV ejection1, 2.
The inspiratory reduction in RV ejection leads to a decrease in LV filling after a phase lag of two to three heart beats because of the long blood pulmonary transit time. Thus, the LV preload reduction may induce a decrease in LV stroke volume, which is at its minimum during the expiratory period. Two other mechanisms may also occur: mechanical insufflation may induce a squeezing of blood out of alveolar vessels, and thus transiently increase LV preload; and the inspiratory increase in pleural pressure may decrease LV afterload and thus facilitate LV ejection (Fig. 2)4. The first mechanism in hypervolaemic conditions and the second mechanism in case of LV systolic dysfunction may induce a slight increase in LV stroke volume during the inspiratory period. However, experimental data suggest that these two mechanisms are only minor determinants of the respiratory changes in LV stroke volume, even in the cases of hypervolaemia and LV dysfunction4.
In summary, intermittent positive-‐pressure ventilation induces cyclic changes in LV stroke volume (maximum during the inspiratory period and minimum during the expiratory
period), which are mainly related to the expiratory decrease in LV preload due to the inspiratory decrease in RV filling and ejection (Fig. 2)1, 2.
Figura 2. Haemodynamic effects of mechanical insufflation. The LV stroke volume is maximum at the end of the inspiratory period and minimum two to three heart beats later (ie during the expiratory period). The cyclic changes in LV stroke volume are mainly related to the expiratory decrease in LV preload due to the inspiratory decrease in RV filling and output.
Interestingly, the cyclic changes in RV preload induced by mechanical ventilation should result in greater cyclic changes in RV stroke volume when the right ventricle operates on the steep rather than on the flat portion of the Frank–Starling curve. The cyclic changes in RV stroke volume, and hence in LV preload, should also result in greater cyclic changes in LV stroke volume when the left ventricle operates on the ascending portion of the Frank–Starling curve. Thus, the magnitude of the respiratory changes in LV stroke volume should be an indicator of biventricular preload dependence.
Respiratory changes in systolic pressure
Because LV stroke volume is a major determinant of systolic arterial pressure, analysis of respiratory changes in systolic pressure has been proposed to assess the respiratory changes in LV stroke volume during mechanical ventilation. The respiratory changes in systolic pressure can be analyzed by calculating the difference between the maximal and the minimal value of systolic pressure over a single respiratory cycle (Fig. 3). This difference was called ‘systolic pressure variation’ (SPV) and was divided into two components (∆up and ∆down). These two components are calculated using a reference systolic pressure, which is the systolic pressure measured during an end-‐expiratory pause3.
∆up is the difference between the maximal value of systolic pressure over a single respiratory cycle and the reference systolic pressure. It reflects the inspiratory increase in systolic pressure, which results either from increase in LV stroke volume related to the increase in LV preload (squeezing of blood out of alveolar vessels) or a decrease in LV afterload, or both; or an increase in extramural aortic pressure related to the rise in pleural pressure3.
∆down is the difference between the reference systolic pressure and the minimal value of systolic pressure over a single respiratory cycle. It reflects the expiratory decrease in LV preload and stroke volume related to the inspiratory decrease in RV stroke volume (see above)3. In normo or hypovolaemic conditions, ∆down is the main component of SPV and
haemorrhage increases SPV and ∆down. The amount of blood loss is closely correlated with SPV and ∆down and volume expansion decreases SPV and ∆down. Finally, LV dysfunction and hypervolaemia increase ∆up, but decrease ∆down and SPV such that, in this setting, SPV is minimal and ∆up is the main component of SPV3.
In mechanically ventilated patients, haemorrhage has also been shown to increase SPV and ∆down, whereas volume expansion has been shown to decrease SPV and ∆down.
∆down can be considered as an indicator of fluid responsiveness, because the higher ∆down before volume expansion, the greater the increase in cardiac index in response to fluid infusion. However, the respiratory changes in systolic pressure result from changes in transmural pressure (mainly related to changes in LV stroke volume) and also from changes in
extramural pressure (ie from changes in pleural pressure).
Therefore, respiratory changes in systolic pressure may be observed despite no variation in LV stroke volume. In this regard, has been demonstrated that changes in systolic pressure may reflect changes in airway pressure and pleural pressure better than they reflect concomitant changes in LV haemodynamics 3.
Figura 3. Respiratory changes in systolic pressure in a mechanically ventilated patient. The difference between the maximal and minimal value of systolic pressure over a single respiratory cycle is called SPV (for Systolic Pressure Variation). The reference systolic pressure is measured during an end-‐expiratory pause (line of reference) and SPV is divided in two components: Δup and Δdown. Dup is the difference between the maximal and the reference systolic pressure. Δdown is the difference between the reference and the minimal systolic pressure.
Respiratory changes in pulse pressure
The pulse pressure (defined as the difference between the systolic and the diastolic pressure) is directly proportional to LV stroke volume and inversely related to arterial compliance1, 2. The pulse pressure is not directly influenced by the cyclic changes in pleural pressure, because the increase in pleural pressure induced by mechanical insufflation affect
both diastolic and systolic pressures. In this regard, the respiratory changes in LV stroke volume have been shown to be reflected by changes in peripheral pulse pressure during the respiratory cycle. There-‐ fore, it was recently proposed that fluid responsiveness may be assessed by calculating the respiratory changes in pulse pressure (∆PP) as follows:
where PPmax and PPmin are the maximal and minimal values of pulse pressure over a single respiratory cycle, respectively (Fig. 5).
Figura 4. Respiratory changes in airway and arterial pressures in a mechanically ventilated patient. The pulse pressure (systolic minus diastolic pressure) is maximal (PPmax) at the end of the inspiratory period and minimal (PPmin) three heart beats later (ie during the expiratory period). The respiratory changes in pulse pressure (DPP) are calculated as the difference between PPmax and PPmin, divided by the mean of the two values, and expressed as a percentage.
the following. First, ∆PP accurately predicted the haemodynamic effects of volume expansion; a threshold value of 13% allowed dis-‐ crimination between responder (defined as patients who experienced an increase in cardiac index ≥15% in response to volume expansion) and nonresponder patients with a sensitivity and a specificity of 94 and 96%, respectively. Second, the baseline value of ∆PP was closely correlated with the percentage increase in cardiac index in response to volume expansion; the higher ∆PP was before volume expansion, the greater the increase in cardiac index (Fig. 6). Third, ∆PP was a more reliable indicator of fluid responsiveness than were the respiratory changes in systolic pressure. Finally, the decrease in ∆PP induced by volume expansion was correlated with the increase in cardiac index, such that changes in ∆PP could be used to assess the haemodynamic effects of volume expansion3.
In summary, calculation of ∆PP may be of particular help in the decision-‐making process regarding whether to institute volume expansion. Indeed, if ∆PP is low (<13%), then a beneficial haemodynamic effect of volume expansion is very unlikely, and inotropes or vasoactives drugs should be pro-‐ posed in order to improve haemodynamics. In contrast, if ∆PP is high (>13%), then a significant increase in cardiac index in response to fluid infusion is very likely. However, the decision regarding whether to institute volume expansion must take into account the risk of fluid therapy (worsening in gas exchange), and a decrease in the mean airway pressure (ie a decrease in tidal volume or in PEEP) is an alternative therapeutic approach in this instance3.
Interestingly, the assessment of cardiac preload dependence is not only useful in predicting volume expansion efficacy, but also in predicting the haemodynamic effects of any therapy that induces changes in cardiac preload conditions. In this regard, ∆PP has been shown to be useful in monitoring the haemodynamic effects of PEEP in mechanically ventilated patients with acute lung injury. Indeed, the decrease in mean cardiac output induced by PEEP and the decrease in RV stroke volume induced by mechanical insufflation share the same mechanisms (ie the negative effects of increased pleural pressure on RV filling and of increased transpulmonary pressure on RV afterload). Thus, the magnitude of the expiratory decrease in LV stroke volume would correlate with the PEEP-‐ induced decrease in mean cardiac output.
demonstrated. First, ∆PP on zero end-‐expiratory pressure (ZEEP) was closely correlated with the PEEP-‐induced decrease in cardiac index; the higher ∆PP was on ZEEP, the greater the decrease in cardiac index when PEEP was applied (Fig. 7). Also, the increase in ∆PP induced by PEEP was correlated with the decrease in cardiac index, such that changes in ∆PP from ZEEP to PEEP could be used to assess the haemodynamic effects of PEEP without the need for a pulmonary artery catheter. Finally, when cardiac index decreased with PEEP, volume expansion induced an increase in cardiac index that was proportional to ∆PP before fluid infusion5.
It is likely that analysis of the respiratory changes in LV stroke volume could also be useful to monitor the haemodynamic effects of ultrafiltration during dialysis or of any change in ventilatory parameters.
Limitations of PPV
Analysis of the respiratory changes in arterial pressure is not possible in patients with cardiac arrythmias. Moreover, these parameters have been validated in sedated and mechanically ventilated patients. Therefore, whether the respiratory changes in LV stroke volume predict fluid responsiveness in non sedated and in spontaneously breathing patients remains to be evaluated6.
The respiratory changes in LV stroke volume might also result from a decrease in LV afterload caused by the inspiratory increase in pleural pressure.
Thus, the respiratory changes in LV stroke volume could theoretically be an indicator of afterload dependence, rather than of preload dependence, for example in patients with congestive heart failure. In fact, it is unlikely that the inspiratory increase in LV stroke volume can be responsible for large variations in LV stroke volume and hence in arterial pressure, even in the case of LV dysfunction. In animals, induction of an experimental cardiac dysfunction was showed to result in a decrease rather than an increase in systolic pressure variation6.
Because the pulse pressure depends not only on stroke volume, but also on arterial compliance, large changes in pulse pressure could theoretically be observed despite small changes in LV stroke volume if arterial compliance is low (elderly patients with peripheral
vascular disease). Similarly, small changes in pulse pressure could be observed despite large changes in LV stroke volume if arterial compliance is high (young patients without any vascular disease). In fact, a close relationship between baseline ∆PP and the changes in cardiac index induced by volume expansion was observed in a series of patients with a large range of ages and comorbidities, suggesting that the arterial compliance poorly affected the relationship between respiratory changes in LV stroke volume and ∆PP6.
Spontaneous respiratory movements can affect ∆PP through different pathways. First, respiratory changes in alveolar and pleural pressure are lower during spontaneous breaths than during mechanically assisted breaths. However, this factor may only account for patients breathing spontaneously through a face mask. Patients ventilated with pressure support ventilation experienced a range of driving pressures similar to those observed in other studies. Second, active expiratory movements, which can occur both during spontaneous breathing and during mechanical ventilation, can alter the cyclic changes in alveolar pressure6.
The active expiratory contraction of abdominal muscles flushes blood from the abdominal compartment into the thorax, increasing the right ventricular preload and later the LV preload. Active expiration also induces a decrease in left ventricular afterload. This may counterbalance the cyclic modifications induced by the passive changes in intrathoracic pressure occurring in mechanically ventilated patients without spontaneous breathing movements. These changes may result in both false negative and false positive tests. Third, the respiratory rate may be higher in patients with spontaneous respiratory movements, so that the number of cardiac beats per respiratory cycle may be reduced, and hence the chance to detect respiratory variations in stroke volume. Finally, patients under less sedation may also experience variations in cardiac output independently of their preload status6.
They may be more sensitive to various stimuli (such as pain, noise, anxiety, or dyspnea), resulting in transient increases in oxygen consumption and consequently in cardiac output. This could have happened at any time during the evaluation of the response to VE, affecting its interpretation.
Role of asynchrony
As previous explained, mechanical ventilation induces cyclic changes in intrathoracic and transpulmonary pressures 7-‐9 that transiently affect venous return and consequently right and left ventricular stroke volume (SV) in those patients who are preload-‐dependent 1, 2. PPV was shown to predict fluid responsiveness in patients receiving controlled mechanical ventilation (CMV), the diagnostic threshold being between 11 and 13% 4, 10, in particular for
tidal volume (VT) ≥ 8 ml/kg 11. In patients receiving partial ventilatory assistance 6, 12, however,
PPV was shown to be an unreliable predictor of volume responsiveness 13. This poor prediction
of volume responsiveness has been attributed to multiple causes such as the preload increase induced by the negative intrathoracic pressure swing during the patient’s inspiratory effort 14,
the occurrence of expiratory muscle activity flushing blood from the abdominal compartment into the thorax 6, and the characteristics of the breathing pattern, sometimes characterized by
high respiratory rate (RR) and low and/or variable VT 6, 14.
A poor patient-‐ventilator interaction determines asynchronies, which have been recently reported to be more frequent than previously considered 15-‐19, reaching up to 25% of
the total number of breaths in patients ventilated for more than 24 hours 15, and are
predominantly due to the occurrence of ineffective efforts (IEs) 15-‐17. IEs determine negative intrathoracic pressure swings with no change in lung volume that may potentially weaken the correlation between PPV and volume responsiveness.
Early discontinuation of CMV in favour of forms of partial support is nowadays a cornerstone of the management of ICU patients 20. In particular, pressure support ventilation
(PSV) is increasingly used, particularly during the weaning process 21. Only few studies investigated the efficacy of PPV during partial support in general and PSV in particular. In a heterogeneous subgroup of 19 patients receiving partial ventilatory assistance (5 in PSV and 14 in assist/control), Monnet et al found that sensitivity and specificity of PPV ≥ 12% were 75% and 46%, respectively 12. Heenen et al. 6 found a poor correlation between PPV and fluid responsiveness (AUC = 0.64 ± 0.26) in a subgroup of 9 patients undergoing PSV. Therefore, while PPV is the best available dynamic index in CMV 4, its performance in actively breathing
potentially affects the outcome of the weaning process.
We therefore designed a clinical study is to investigate the influence of patient-‐ ventilator asynchrony on PPV ability to predict fluid responsiveness in ICU patients undergoing PSV.
Role of echocardiography in the evaluation of hemodynamically unstable ICU patients.
Critical care ultrasonography, including general ultrasonography and echocardiography, is routinely used in intensive care units of many hospitals worldwide, where it is often regarded as a first-‐line diagnostic tool. Although the usefulness of ultrasound in the ICU environment is widely acknowledged, physicians who want to become proficient in ultrasound techniques often struggle to obtain adequate training. One of the difficulties is that teaching of these techniques has not yet been incorporated into the formal training curriculum of intensive care medicine, and to date only a few countries have developed specific programs for this purpose. Recently, a comprehensive list of competencies required by intensive care physicians using ultrasonography has been formulated and published in a competence statement emanating from two critical care societies 22. These competences cover the fields of
abdominal, pleural, lung, and vascular ultrasound (general critical care ultrasonography, GCCUS) as well as cardiac examination (critical care echocardiography, CCE). CCE was divided into ‘‘basic’’ and ‘‘advanced’’ levels of knowledge22.
Determining Cardiac Output (CO) is helpful to manage critically ill patients with severely impaired hemodynamics and discriminate between low (cardiogenic or non-‐cardiogenic) and high CO shock, in order to adopt the proper treatment. Many different techniques are currently available in Intensive Care Unit (ICU) to determine CO 23, 24. Accuracy and reproducibility, invasiveness and related risks, ease of use, time expenditure, and costs of the different techniques and influence their choice, which is generally consequent to considering and balancing different aspects such as clinical severity and underlying disorders.
Right heart catheterization through the pulmonary artery catheter 25 is considered a cornerstone of CO estimation 26 and a guiding treatment in severely unstable patients requiring cardiovascular support 27, 28. Its extensive application, however, did not prove to
effectively reduce mortality in a general population of ICU patients 23, 29-‐33. Furthermore, although the rate of PAC side effects and complications is relatively low 34, the invasiveness of
this technique limit its use. As a matter of fact, the use of PAC is nowadays overall declining and advised only for the most complex and severe 23, 35, 36. Several alternative techniques have been proposed in recent years to determine CO in critically ill patients 37-‐39, but in some
instances they are not free of invasiveness and are frequently more expensive 39, 40. In addition, the clinical utility of these devices in either ascertaining the determinants of hemodynamic instability and establishing a prompt and effective treatment has never been demonstrated 34. A spot evaluation of CO in patients with acute cardiovascular failure in ICU or in the Emergency setting may be sufficient in several instances to differentiate between low and high CO states and facilitate proper inotropic or vasopressive treatment.
More than 25 years ago, a fast and accurate method based on transthoracic echocardiography (TTE) was validated, when performed by experienced cardiologists, which allows non-‐invasively estimation of CO (COTTE) in clinically stable patients with chronic heart
failure 41-‐45. Surprisingly, however, to our knowledge no previous study evaluated the
possibility to use this technique in the acute setting. We therefore designed a clinical study, involving a part of our ICU equip, to compare COTTE performed by non-‐cardiologist ICU
physicians with a relatively brief training in TTE, with CO measured using the PAC (COPAC), in
ICU patients with shock requiring inotropic or vasopressive drugs and receiving mechanical ventilation.
PATIENT-‐VENTILATOR ASYNCHRONY AFFECTS PULSE PRESSURE VARIATION
PREDICTION OF FLUID RESPONSIVENESS DURING PRESSURE SUPPORT.
Antonio Messina, Davide Colombo, Gianmaria Cammarota, Marta De Lucia,Maurizio Cecconi, Massimo Antonelli, Francesco Della Corte, Paolo Navalesi.
Name of Department and Institution: The present study was performed in the ICU of the A.O.U. Maggiore della Carità, Corso Giuseppe Mazzini, 18, 28100 Novara (NO) – ITALY. SUBMITTED to ANESTHESIA AND ANALGESIA. UNDER REVISION.
Introduction
Preload assessment fails to estimate fluid responsiveness in about one-‐half of Intensive Care Unit (ICU) patients 13, 14. Predicting fluid responsiveness avoids unnecessary or even
harmful volume expansion in patients for whom inotropic agents and/or vasopressors are indicated. Static indexes, such as central venous pressure and pulmonary artery occluded pressure, are poor predictors of fluid responsiveness 13, 46, 47. Dynamic indexes have been
shown to better predict the response to fluid loading in patients under controlled mechanical ventilation (CMV)48, which induces cyclic changes in intrathoracic and alveolar pressure 7-‐9.
This affects, in patients who are preload-‐dependent, venous return and right ventricular afterload, influencing both pre-‐load and stroke volume of the left ventricle 1, 2. Pulse pressure
variation (PPV) is a dynamic index shown to predict fluid responsiveness in patients under CMV with tidal volume (VT) ≥ 8 ml/kg 4, 11.
In patients with spontaneous breathing activity, PPV is unreliable in predicting volume responsiveness 6, 13, 14, because the inspiratory decrease in intrathoracic pressure increases to
a variable extent venous return and right ventricular stroke volume, making the variations in pulse pressure no longer univocally related to the volemic status. During partial ventilatory assistance, the intrathoracic pressure is decreased by the spontaneous inspiratory effort and increased by the ventilator insufflation.
When the respiratory drive is low, consequent to a combination of factors including high support and sedation, the patient exerts a minimal effort just sufficient to trigger the ventilator and then relax. In this condition, the effect of the spontaneous effort on venous return should be minimal and, if the respiratory drive is constant, stable in rhythm and magnitude. An altered respiratory drive, however, worsens patient-‐ventilator interaction and causes asynchronies, recently recognized to be more frequent than previously considered 15-‐18,
49_ENREF_14
The most common form of asynchrony are first the ineffective triggering (IT), a negative intrathoracic pressure swings with no change in lung volume, and then double-‐triggering, two consecutive ventilator insufflations separated by a very short expiratory time, and auto-‐
triggering, mechanical assistance unrelated to patient’s effort 15-‐17. We hypothesize that, although through different mechanisms, these asynchronies affect the cyclical changes in intrathoracic pressure, resulting in unpredictable and persistent variations of right ventricular preload and left ventricular stroke volume, altering the reliability of PPV in assessing fluid responsiveness. We therefore designed this study 1) to evaluate in patients receiving partial ventilatory support the effect of asynchronies on PPV ability to predict fluid responsiveness, and 2) to assess their influence on PPV reliability, compared to other respiratory variables, such as VT and respiratory rate, insofar considered the most influential.
Methods
Patients
The study was performed in the ICU of the University Hospital “Maggiore della Carità” in Novara, in accordance with the principles outlined in the Declaration of Helsinki. The institutional ethics committee approved the study. Patient informed consent was written and obtained according to the Italian regulations. Patients were enrolled from September 2012 to June 2013.
All patients were ventilated in Pressure Support Ventilation (PSV) mode using last generation ICU ventilators displaying online flow, volume and airway pressure waveforms. Inclusion criteria were: 1) clinical indication to fluid challenge, as defined by the presence of at least one of the following: a) heart rate ≥ 100/min), b) systolic blood pressure ≤ 90 mmHg (or a decrease ≤ 50 mmHg in hypertensive patients), c) need for vasoactive drugs (dobutamine or dopamine ≥ 5 mcg/kg/min; epinephrine or norepinephrine irrespective of the dose), d) urine output ≤ 0.5 mL/kg/hr for 2 consecutive hours; 2) Positive End Expiratory Pressure (PEEP) ≥ 5 cmH20 and ≤ 10 cmH20 and inspiratory support level ≥ 10 and ≤ 15 cmH20, 3) stable ventilatory
pattern. Exclusion criteria were: 1) age < 18 years, 2) New York Heart Association (NYHA) class III or IV, 3) severe valvular diseases, 4) any cardiac arrhythmias, 5) moderate to severe ARDS 50,
6) need for haemodialysis or continuous hemofiltration, 6) inclusion in other research protocols, 7) consent denied.
Two experienced ICU physicians of our group (DC and GC), previously involved in several studies evaluating patient-‐ventilatory asynchrony, independently and blindly assessed the occurrence of IT, double-‐triggering and auto-‐triggering, by visually inspecting ventilator waveforms during 3 consecutive minutes just before the fluid challenge. When the two examiners agreed that no asynchrony occurred, the patient was considered synchronous (Synch); when they both counted a number of asynchronies of at least 10% of the overall breaths the patient was considered asynchronous (Asynch) 15-‐17, 51. When the asynchronous events were less than 10% of the overall breaths or there was no agreement between the two blinded examiners on the presence and extent of asynchronies, the patient was excluded.
Asynch, whose demographic and clinical characteristics at enrolment are shown in Table 1.
Protocol
Sedation and analgesia were administered according to standard ICU protocols and included remifentanil, propofol and/or midazolam. The fluid challenge consisted in the infusion of 500 mL of saline over a 10-‐minute period 12. Patients who showed an increase in cardiac index (CI) ≥ 15% after fluid infusion were considered responders 10. Ventilator settings, vasoactive and sedative infusions were kept constant throughout the study period. The physician who infused the fluids and performed the hemodynamic measurements was blinded to AI the assessment of asynchronous events. Hemodynamic measurements were obtained with the patient lying supine through arterial waveform analysis by PRAM® (pressure recording analytical method; MOSTCARE system; Vygon Health, Padua, Italy) through a catheter introduced within either the femoral or the radial artery. PRAM® provided beat-‐by-‐beat
systolic, diastolic and mean arterial pressure, heart rate, and calculates CI and PPV 52-‐54. All these values are automatically averaged over a 30-‐second period, as recommended by the manufacturer. The hemodynamic data recorded by PRAM® were transferred on a data card
and then exported into a spreadsheet through dedicated software (MOSTCARE Data Card Reader® 4.0.11). Hemodynamic measurements were determined and averaged over one
minute before (baseline) and immediately after fluid challenge.
Statistical analysis
Based on a previously reported value of the area under the curve (AUC) of 0.64 in patients undergoing PSV 6, we calculated that enrolling 27 patients for each of the two groups
would allow detecting an increase in AUC up to 0.85, a priori considered clinically relevant, with type 1 and 2 errors of 0.05 and 0.20, respectively. Data are expressed as mean ± standard deviation or median (25–75% interquartile range) according to distribution. To ascertain differences between baseline Synch and Asynch data, independent sample t-‐test or Mann-‐
Whitney U test were used, as indicated. To detect differences between hemodynamic variables before and after fluid challenge we used the paired t-‐test or Wilcoxon test, as indicated. We determined the overall Receiver Operator Characteristic (ROC) and compared
AUC (5-‐95% confidence interval) for Synch and Asynch groups. Post-‐hoc ROC analysis with
backward logistic regression was performed to assess whether PPV prediction of fluid responsiveness was affected by occurrence of asynchronies, VT (cut-‐off 8 ml/kg)11, RR (cut-‐off
14 breaths/min)55.
A 2x2 contingency table was used to ascertain the percentage of correct classification ([true positive + true negative] / total number of patients) for a VT cut-‐off of 8 ml/kg, both in
Synch and Asynch groups of patients. The patients with PPV ≥ 13% 5 and CI increase ≥ 15% 10
were considered true positive, while those with PPV < 13% and CI increase < 15% true negative.
For all comparisons, p values < 0.05 were considered significant.
Results
Demographic and other baseline characteristics were similar in the two groups of patients (Table 1). In the Asynch group, IT was the most common form of asynchrony (81.5%), while the rates of double-‐triggering and auto-‐triggering were 11% and 7.5%, respectively. The hemodynamic response to the fluid challenge is presented in Table 2 for responders and non-‐ responders. Overall, 23 patients (42.5%) resulted to be fluid responders, 9 in the Synch group and 14 in the Asynch group (p = 0.27).
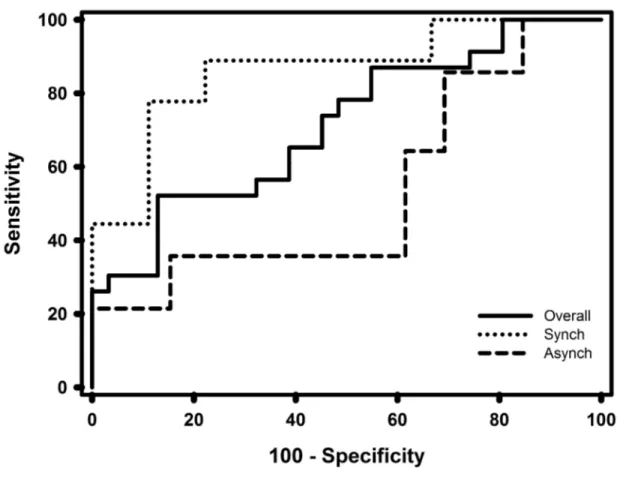
Figure 1 displays ROCs for PPV in the overall population (solid line), Synch (dotted line), and Asynch (dashed line). The AUCs were 0.71 (IC 0.57 – 0.83) for the overall population, 0.86 (IC 0.68 – 0.96) and 0.53 (IC 0.33 – 0.73) for Synch and Asynch, respectively (p = 0.018). The best cut-‐off based on ROC curve analysis was 10% for Synch (sensitivity 89% and specificity 72%) and 11% for Asynch (sensitivity 36% and specificity 38%). When considering PPV ≥ 13%,
which is the PPV threshold utilized during CMV 10, sensitivity was 78% in the Synch group and
36% in the Asynch group, and specificity 89% and 46% respectively.
Worth remarking, regardless of the occurrence of asynchrony, the AUCs for VT ≥ 8
ml/Kg (0.78 [IC 0.53 – 0.94]) and < 8 ml/Kg (0.65 [IC 0.47 – 0.80]), and for RR ≤ 14 breaths/min (0.82 [IC 0.67 – 0.94]) and > 14 breaths/min (0.62 [IC 0.42 – 0.79]) were not significantly different (p = 0.40 and p = 0.16 for VT and RR, respectively). In addition, backward logistic
regression showed that the variable presence/absence of asynchrony was the only parameter affecting PPV efficacy in predicting fluid responsiveness [p < 0.005; OR 7.3 (1.8 – 29.0)].
In the Synch group, the rate of correct classification was 100% for the 12 patients (9 non-‐responders and 3 responders) with VT ≥ 8 ml/Kg and 73% for the 15 patients with VT < 8
ml/Kg. Ten patients in the Asynch group also had a VT ≥ 8 ml/Kg, but the rate of correct
Discussion
Our study shows that patient-‐ventilator asynchrony is one of the factors affecting PPV ability to predict fluid responsiveness during partial ventilatory support.
In the Synch group the best sensitivity (89%) was reached when the PPV was ≥10%, while the highest specificity (89%) was achieved when PPV was ≥ 13%. The cut-‐off values for partitioning between responders and non-‐responders may vary and a higher sensitivity or specificity may be preferred depending on the clinical scenario 11. The rate of fluid responders
in our population was 42.5%, a value similar to the one reported in previous studies 10, 56, but
lower than the average 50% 3, 14, which can be explained by the fact that some of our patients had previously received fluid resuscitation for hemodynamic instability.
PPV is a valuable dynamic index during CMV under certain conditions 4, 11, 55, 57, but it
performs poorly in actively breathing patients 14. This greatly limits its clinical use because
early discontinuation of CMV in favour of forms of partial support is nowadays a cornerstone of the management of ICU patients 20 and PSV is increasingly used, particularly during the
weaning process 21. It has been recently shown by a multicenter point-‐prevalence study that
PPV can be properly used to evaluate fluid responsiveness only in a small fraction of ICU patients who satisfy all the validity criteria for this index 58. In this study, of 121 rhythmic
patients undergoing invasive mechanical ventilation 77 were excluded a priori because of partial ventilatory support with spontaneous breathing activity 58. Only two small studies,
however, provide some information on PPV performance during partial ventilatory assistance in general and PSV in particular. In a subgroup of 19 patients receiving partial ventilatory assistance, 5 in PSV and 14 in assist/control (A/C), Monnet et al found that sensitivity and specificity of PPV ≥ 12% were 75% and 46%, respectively 22. Heenen et al. observed a poor correlation between PPV and fluid responsiveness in a subgroup of 9 patients undergoing PSV
6.
Consistent with these previous studies 6, 12, the AUC of our overall population was much lower than that reported in patients undergoing CMV 4. This discrepant PPV behaviour between forms of partial support, i.e., PSV and A/C, and CMV has been attributed to either the characteristics of the breathing pattern and the respiratory muscles activity 11, 14. No study has