Anno Accademico 2016- 2017
UNIVERSITÀ DEGLI STUDI DI SASSARI CORSO DI DOTTORATO DI RICERCA
Scienze Agrarie Curriculum
Scienze e Tecnologie Zootecniche Ciclo XXX
Use of multivariate discriminant methodologies in the analysis of
phenotypic and genomic data of cattle
dr.ssa Elisabetta Manca
Coordinatore del Corso Prof. Antonello Cannas Referente di Curriculum Dr. Gianni Battacone Docente Guida Dr. Corrado Dimauro
Anno Accademico 2016-2017
Università degli Studi di Sassari
Dipartimento di Agraria
Dottorato di ricerca in Scienze Agrarie
Curriculum
Scienze e Tecnologie Zootecniche
XXX CICLO
_____________________________
La presente tesi è stata prodotta durante la frequenza del corso di dottorato in Scienze Agrarie dell’Università degli Studi di Sassari, anno accademico. 2016/2017 – XXX ciclo, con il sostegno di una borsa di studio cofinanziata con le risorse del P.O.R. SARDEGNA F.S.E. 2007-2013 - Obiettivo competitività regionale e occupazione, Asse IV Capitale umano, Linea di Attività l.3.1 “Finanziamento di corsi di dottorato finalizzati
alla formazione di capitale umano altamente specializzato, in particolare per i settori dell’ICT, delle nanotecnologie e delle biotecnologie, dell'energia e dello sviluppo sostenibile, dell'agroalimentare e dei materiali tradizionali”.
A mio padre e mia madre
con amore e gratitudine
Elisabetta Manca - “Use of multivariate discriminant methodologies in the analysis of phenotypic and
genomic data of cattle” - Tesi di Dottorato in Scienze Agrarie—Curriculum “Scienze e Tecnologie
Zootecniche” -Ciclo XXX -Università degli Studi di Sassari
Anno Accademico 2016-2017 ACKNOWLEDGEMENTS
I would like to thank all members of Animal Science Section (Department of Agricultural Science, University of Sassari, Italy), professors, researchers and technicians, for their scientific and human support.
I would like to express my special thanks to my supervisor Dr. Corrado Dimauro for huge and constant human support, teachings and help through scientific advice and full availability.
I would to thank to Prof. Nicolò Pietro Paolo Macciotta, Dr. Giustino Gaspa, Dr. Silvia Sorbolini, Dr. Alberto Stanislao Atzori and Dr. Massimo Cellesi for their precious help during my experimental work.
I want to sincerely thank my colleagues for their essential help, collaboration, human sustain and for their sincere friendship.
Thanks to Dr. Attilio Rossoni and Dr. Enrico Santus (ANARB, Bussolengo, Italy), Dr. Enrico Costa (Società Bonifiche Sarde, Arborea, Italy) and Dr. Sergio Beltrame (CHJAVIZA Kft, Tiszaalpar, Hungary) for their essential collaboration and for data provided.
Elisabetta Manca - “Use of multivariate discriminant methodologies in the analysis of phenotypic and
genomic data of cattle” -Tesi di Dottorato in Scienze Agrarie -Curriculum “Scienze e Tecnologie
Zootecniche” - Ciclo XXX -Università degli Studi di Sassari
Anno Accademico 2016-2017 TABLE OF CONTENTS
CHAPTER 1. Introduction 1
1.1 Multivariate Statistical Analysis 2
1.2 Principal Components Analysis 5
1.3 Canonical Discriminant Analysis 7
1.4 Stepwise Discriminant Analysis 10
1.5 Use of discriminant techniques in animal science 11
1.6 References 16
CHAPTER 2. A new multivariate approach for Genome-wide Association Studies 20
2.1 Abstract 21
2.2 Introduction 22
2.3 Material and methods 25
2.4 Results 28
2.5 Association analysis 32
2.6 Discussion 35
2.7 Conclusions 42
2.8 References 43
CHAPTER 3. Genome-wide Association Study on residual concentrate intake in brown swiss young bulls by using the multivariate DAM approach 48
3.1 Abstract 49
3.2 Introduction 50
3.3 Materials and methods 53
3.4 Results 58
3.5 Discussion 70
Elisabetta Manca - “Use of multivariate discriminant methodologies in the analysis of phenotypic and
genomic data of cattle” -Tesi di Dottorato in Scienze Agrarie -Curriculum “Scienze e Tecnologie
Zootecniche” - Ciclo XXX -Università degli Studi di Sassari
Anno Accademico 2016-2017
3.7 References 76
CHAPTER 4. Use of Discriminant Analysis to early detect lactation's persistency in
dairy cows 84
4.1 Abstract 85
4.2 Introduction 86
4.3 Materials and methods 89
4.4 Results 93
4.5 Discussion 105
4.6 Conclusions 108
Elisabetta Manca - “Use of multivariate discriminant methodologies in the analysis of phenotypic and
genomic data of cattle” -Tesi di Dottorato in Scienze Agrarie -Curriculum “Scienze e Tecnologie
Zootecniche” - Ciclo XXX -Università degli Studi di Sassari
Anno Accademico 2016-2017 LIST OF TABLES
CHAPTER 1
Table 1. General interpretation of correlation values 3 CHAPTER 2
Table 1. GWAS, DAM SNPs, number common markers and minimum number of discriminant DAM SNPs
30
Table 2. Number of selected markers shared by two phenotypes and, in bold, the Pearson correlations between corrected phenotypes
31
Table 3. Name, range of analysis and relative gene associated for 105 most discriminant markers
37
CHAPTER 3
Table 1. Chemical composition of concentrate diet 53 Table 2. List of 88 selected markers and their canonical coefficients (CC). Negative and positive black markers refer to the low (L) and high (H) class whereas grey markers indicate the medium (M) class
61
Table 3. List of the 88 top discriminant markers and relative genes surrounding them. Superscripts L, M and H refers to CC classes (L =low, M =medium, H =high)
64
Table 4. Candidate protein-coding genes within 2.5 Mb of significant Markers for traits underlying nutrient repartitioning
69
CHAPTER 4
Elisabetta Manca - “Use of multivariate discriminant methodologies in the analysis of phenotypic and
genomic data of cattle” -Tesi di Dottorato in Scienze Agrarie -Curriculum “Scienze e Tecnologie
Zootecniche” - Ciclo XXX -Università degli Studi di Sassari
Anno Accademico 2016-2017
Table 2. Correlations between milk yield at 305 DIM and at 400, 500 and 600 DIM
96
Table 3. Differences of Wood’s parameters and their combinations between lactations belonging
97
Table 4. Differences of Wood’s parameters and their combinations between lactations belonging to low (LC), medium (MC) and high (HC) production classes for primiparous (FPG) and multiparous (MPG) cows
98
Table 5. Average AdjRSQ for each model among classes at 150,120 and 90 DIM for FPG
99
Table 6. Average AdjRSQ for each model among classes at 150, 120 and 90 DIM for MPG
100
Table 7. Mahalanobis distances between lactations belonging to the low (LC) and the high (HG) classes of production evaluated at 90, at 120 and 150 DIM for FPG
102
Table 8. Mahalanobis distances between lactations belonging to the low (LC) and the high (HG) classes of production evaluated at 90, at 120 and 150 DIM for MPG
102
Table 9. Percentage of incorrect assignment of lactations belonging to LC and HC at 150,120 and 90 DIM for FPG and MPG
Elisabetta Manca - “Use of multivariate discriminant methodologies in the analysis of phenotypic and
genomic data of cattle” -Tesi di Dottorato in Scienze Agrarie -Curriculum “Scienze e Tecnologie
Zootecniche” - Ciclo XXX -Università degli Studi di Sassari
Anno Accademico 2016-2017 LIST OF FIGURES
CHAPTER 1
Figure 1. Scatterplot of (a) the original x1 and x2 variables and of (b) the PC1
and PC2
6
Figure 2. Fisher 1936, Iris data: Plot of Canonical Variables 8 Figure 3. Differences between new axes extracted by PCA and CAN 9 Figure 4. Plot of the two canonical functions (CAN1 and CAN2) obtained by using 48 high discriminant markers Brown and Simmental
14
CHAPTER 2
Figure 1. Distribution across the genome of 1,031 DAM selected markers for all seven studied traits
29
CHAPTER 3
Figure 1. Automatic feeding system 54
Figure 2. Distribution of DAM selected markers across the genome 58 Figure 3. Graph of the canonical function (CAN) obtained in a genome-wide canonical discriminant analysis using a selected number (382) of SNP variables
59
Figure 4. Graph of the canonical function (CAN) obtained in a genome-wide
canonical discriminant analysis using a restricted number (88) of SNP variables 60
Figure 5. Graph of the canonical coefficients of the canonical function (CAN) obtained in a genome-wide canonical discriminant analysis using a selected number (88) of SNP variables
Elisabetta Manca - “Use of multivariate discriminant methodologies in the analysis of phenotypic and
genomic data of cattle” -Tesi di Dottorato in Scienze Agrarie -Curriculum “Scienze e Tecnologie
Zootecniche” - Ciclo XXX -Università degli Studi di Sassari
Anno Accademico 2016-2017 CHAPTER 4
Figure 1. Average lactation curves obtained by fitting the Wood’s model for FPG and SPG
93
Figure 2. Lactation distribution among the three classes of production (LC <20 kg, MC >20 kg and >32 kg, HC >32 kg) at 305 DIM, for the two parity groups (SPG and MPG)
94
Figure 3. Average lactation curves obtained by fitting the Wood’s model to the three classes of production in FPG
95
Figure 4. Average lactation curves obtained by fitting the Wood’s model to the three classes of production in MPG
95
Figure 5. Plot of the CAN for the two parities (FPG and MPG) at 150 DIM 103
Elisabetta Manca - “Use of multivariate discriminant methodologies in the analysis of phenotypic and
genomic data of cattle” -Tesi di Dottorato in Scienze Agrarie -Curriculum “Scienze e Tecnologie
Zootecniche” - Ciclo XXX -Università degli Studi di Sassari
Anno Accademico 2016-2017 GENERAL ABSTRACT
The present thesis deals with different application of multivariate discriminant procedures both in the analysis of phenotypic and genomic data. This dissertation is organized in 4 main chapters.
The Chapter 1 is the general introduction and essentially regards the use of the multivariate statistical techniques in animal science, with a particular emphasis on the discriminant analysis. This technique, specifically conceived to classify different observations in already existent groups, become very useful when classification is developed by using characters that singularly are not able to classify observations.
In Chapter 2, a new statistical method called Discriminant Association Method (DAM) was proposed. Data used in the present research were previously analyzed by Sorbolini et al. (2016) who carried out an ordinary GWAS on seven growth, carcass and meat quality phenotypes. Involved animals were 409 young Marchigiana bulls genotyped with the Illumina’s 50K BeadChip. The DAM approach, developed by using multivariate statistical techniques, overcomes most of problems that affect the single SNP regression technique used in the ordinary GWAS. The DAM was able to highlight the associations reported by Sorbolini et al. (2016) and to propose new associated markers often related to interesting genes.
In Chapter 3, a new index to evaluate feed efficiency was defined: the residual concentrate intake (RCI). The RCI identifies efficient and inefficient bovines in converting the concentrate. Unlike the residual feed intake (RFI), the RCI is quite simple to measure and therefore it could be easily included in genomic breeding programs. A useful contribute
Elisabetta Manca - “Use of multivariate discriminant methodologies in the analysis of phenotypic and
genomic data of cattle” -Tesi di Dottorato in Scienze Agrarie -Curriculum “Scienze e Tecnologie
Zootecniche” - Ciclo XXX -Università degli Studi di Sassari
Anno Accademico 2016-2017
to breeding programs that include RCI could be offered by the detection of genomic regions and of candidate genes which regulate RCI. In the present research, in addition to the ordinary single SNP regression approach, the DAM method (previously explained in chapter II of this dissertation) was applied to develop a GWAS for selecting markers associated to RCI.
The research reported in Chapter 4 was aimed to develop an algorithm able to early identify dairy cows that, having a persistent lactation, might be destined to have a long lactation. Four different lactation curve models (Wood, Ali & Schaeffer, Legendre Polynomials and 4th Degree Polynomials) were fitted to individual lactations by using the first 90, 120 and 150 DIM (days in milking). Estimated regression parameters were used to develop two multivariate techniques: the canonical discriminant analysis (CDA) and the discriminant analysis (DA). The proposed algorithm combines the talent of curve models in depict features of the lactation and the ability of multivariate statistical techniques in distinguishing differences between groups. In this case, groups consisted of lactations with low (LC) and high (HC) persistency. Only milk production data recorded in early lactation (not more than 150 DIM) was used in all analyses. The algorithm developed could help farmers to early select a quota of their herd to be destined to a long lactation.
Elisabetta Manca - “Use of multivariate discriminant methodologies in the analysis of phenotypic and
genomic data of cattle” - Tesi di Dottorato in Scienze Agrarie—Curriculum “Scienze e Tecnologie
Zootecniche” -Ciclo XXX -Università degli Studi di Sassari
Anno Accademico 2016-2017
CHAPTER 1
Elisabetta Manca - “Use of multivariate discriminant methodologies in the analysis of phenotypic and
genomic data of cattle” - Tesi di Dottorato in Scienze Agrarie—Curriculum “Scienze e Tecnologie
Zootecniche” -Ciclo XXX -Università degli Studi di Sassari
Anno Accademico 2016-2017 1.1 Multivariate Statistical Analysis
The main objective of univariate statistical analysis is to decompose the variance of a dependent character (y) in its components. The total variance of y is given by:
𝜕2 = ∑ (𝑦𝑛 𝑖 𝑖 − 𝑦̄)2 n − 1
The analysis of variance (ANOVA) is a statistical technique used to test differences between two or more means by decomposing the total variance into several components depending on one or more factors of variation. These factors can be both categorical or continuous variables. Despite several characters can be involved in the ANOVA, this technique is however numbered among the univariate statistical analyses because the object of the study is the variability of the y variable.
The bivariate statistical analysis is instead focused on two variables, x and y, that are analyzed simultaneously by decomposing their covariance defined as:
𝜕𝑥𝑦 =
∑ (𝑥𝑛 𝑖 𝑖 − 𝑥̄)(𝑦𝑖− 𝑦̄) n − 2
The covariance is analogue to the variance in the univariate approach. The variance describes the variability of a certain character y, whereas the covariance explains how much the variability of y is influenced by the variability of x.
The variance is always positive (𝜕2>0), while the covariance can be positive or negative. If, on average, when x increases also y increases then 𝜕𝑥𝑦 >0. On the contrary, if, on average, when x increases y decreases then 𝜕𝑥𝑦 <0.
Elisabetta Manca - “Use of multivariate discriminant methodologies in the analysis of phenotypic and
genomic data of cattle” -Tesi di Dottorato in Scienze Agrarie -Curriculum “Scienze e Tecnologie
Zootecniche” - Ciclo XXX -Università degli Studi di Sassari
Anno Accademico 2016-2017
Another index used to evaluate the relationship between two characters is the Pearson linear correlation (Person 1896):
𝜌𝑥𝑦= 𝜕𝑥𝑦 𝜕𝑥𝑥𝜕𝑦𝑦
where 𝜕𝑥𝑦 is the covariance, 𝜕𝑥𝑥 and 𝜕𝑦𝑦 are the standard deviations (i.e. the square root of the variance) of the two variables. The correlation is able to evaluate and understand the linear links between two continuous variables (Mukaka, 2012). It assumes values ranging from -1 (perfect negative correlation), 0 (when there is not a correlation) to 1 (perfect positive correlation) (Mukaka, 2012). Table 1 shows the different degrees of correlation between two variables.
Table 1. General interpretation of correlation values (Mukaka 2012) Range (negative or positive)
From To Interpretation (positive or negative)
± 0.9 ± 1.0 Very High Correlation
± 0.7 ± 0.9 High Correlation
± 0.5 ± 0.7 Moderate correlation
± 0.3 ± 0.5 Low Correlation
0 ± 0.3 Negligible Correlation
However, it is important to note that the interpretation of the correlation coefficient may change depending on the involved characters; hence, the interpretations in the table may vary. A statistical t-test can be developed to test if the two variables are significantly related or not (i.e. if 𝜌≠0 or not).
Elisabetta Manca - “Use of multivariate discriminant methodologies in the analysis of phenotypic and
genomic data of cattle” -Tesi di Dottorato in Scienze Agrarie -Curriculum “Scienze e Tecnologie
Zootecniche” - Ciclo XXX -Università degli Studi di Sassari
Anno Accademico 2016-2017 Ha: 𝜌≠0
The test is based on the t-statistics with n-2 degree of freedom (d. f.):
t=
𝑟√𝑛−2√1−𝑟2
where r is the value of the correlation and n is the number of involved data.
Multivariate analysis consists of a collection of methods that can be used when several characters are observed on the same individual or object.
This approach allows to gain information besides the study of the single variable. In the multivariate analysis, variables are simultaneously analyzed to highlight dependences among them (Ricci 2003). The main objectives of all multivariate techniques are both the synthesis of the data and the study of mutual relation among the different variables. As in univariate and bivariate analysis, the starting point of multivariate techniques is the variability, i.e. the matrix of variance and covariance of data:
11 21 1 12 22 2 1 2 ... ... : : ... : ... p p p p pp
In this matrix
ii is the variance of the variable i and
ij is the covariance between the ithand jth variables.
The main multivariate techniques are:
Elisabetta Manca - “Use of multivariate discriminant methodologies in the analysis of phenotypic and
genomic data of cattle” -Tesi di Dottorato in Scienze Agrarie -Curriculum “Scienze e Tecnologie
Zootecniche” - Ciclo XXX -Università degli Studi di Sassari
Anno Accademico 2016-2017 2. Multivariate Factor Analysis;
3. Partial Lest Squares Regression; 4. Cluster Analysis;
5. Discriminant Analysis.
In the present thesis, we focused our attention on the principal component analysis and the discriminant procedure. These two techniques were described in details.
1.2 Principal Components Analysis
Principal component analysis (PCA) is the most popular multivariate statistical technique and it has been widely exploited by almost all scientific disciplines. It is also the oldest among the multivariate techniques that are currently used. Kearl Pearson, in 1901, was the first to develop this technique. It was, however, formalized in its modern instantiation by Hotelling (1933) who also coined the term Principal Components. PCA is a statistical technique whose main objective is the reduction of the space variables. The basic idea of PCA is very simple and its development involves the matrix algebra. Suppose we have a set of n-variables,
x x
1, ,...,
2x
n, measured on m objects. If we have only twocharacters, the profile of involved objects can be visualized by the scatter plot of
1
v.s.
2x
x
, as displayed in Figure 1a where each point represents one object underElisabetta Manca - “Use of multivariate discriminant methodologies in the analysis of phenotypic and
genomic data of cattle” -Tesi di Dottorato in Scienze Agrarie -Curriculum “Scienze e Tecnologie
Zootecniche” - Ciclo XXX -Università degli Studi di Sassari
Anno Accademico 2016-2017
Figure 1. Scatterplot of (a) the original x1 and x2 variables and of (b) the PC1 and PC2
As generally happens, data-points in the graph are arranged on the direction of the maximum variation. In a multivariate space variable, with a number of variables n >3, points group as an ellipsoid whose axes represent the directions of maximum variation. PCA consists in a rotation of axes on the directions of the maximum variability. In the bivariate space (Figure 1b), PC1 and PC2 are the new rotated axes. The rotated variables, i.e. the principal components, can be obtained by solving an eigenvalues problem applied to the variance and covariance matrix of data. This algebraic procedure extracts new orthogonal axes, also called eigenvectors, whose direction clashes with the maximum variation of data. The total variation of data is therefore reallocated along the new directions and is given by the eigenvalues that are extracted as eigenvectors are obtained. The PC1, usually, summarizes most of the variability, the PC2 a lower value and so on with the others PCs. The number of PCs that are retained depends on the cumulative explained variation. Usually the procedure stops when the extracted components show a cumulative explained variation around 80-85%. The consequence is a drastic reduction
-2.0 -1.5 -1.0 -0.5 0.0 0.5 1.0 1.5 -2.0 -1.5 -1.0 -0.5 0.0 0.5 1.0 1.5 2.0 x 1 x 2 a b x 2
Elisabetta Manca - “Use of multivariate discriminant methodologies in the analysis of phenotypic and
genomic data of cattle” -Tesi di Dottorato in Scienze Agrarie -Curriculum “Scienze e Tecnologie
Zootecniche” - Ciclo XXX -Università degli Studi di Sassari
Anno Accademico 2016-2017
of the number of variables. Scores of objects in the rotated axes are obtained as linear combinations of the original variables:
PC1 =α1 x1 + ... + αn xn
where αi are the loadings of each extracted eigenvector (Macciotta et al., 2010).
Actually, PCA is often used to solve algebraic problems in developing more sophisticated multivariate techniques as principal component regression, factorial analysis or discriminant procedures.
1.3 Canonical Discriminant Analysis
The multivariate discriminant techniques were first formulated by Ronald A. Fisher in 1936. He applied those procedures starting from a dataset of fifty Iris flowers that belong to three different species: two (I. setosa and I. versicolor) coming from the same colony and one (I. virginica) coming from another colony. The considered characters were the sepal length, petal length and petal width. Singularly, the three variables were not able to separate the three groups. When they were analyzed simultaneously, in a discriminant analysis, the three groups were well highlighted, as showed in Figure 2.
Elisabetta Manca - “Use of multivariate discriminant methodologies in the analysis of phenotypic and
genomic data of cattle” -Tesi di Dottorato in Scienze Agrarie -Curriculum “Scienze e Tecnologie
Zootecniche” - Ciclo XXX -Università degli Studi di Sassari
Anno Accademico 2016-2017
Figure 2. Fisher 1936, Iris data: Plot of Canonical Variables (www.supportsas.com)
The canonical discriminant analysis (CDA) is a dimension-reduction technique that is related to principal component analysis and canonical correlation. Given a classification variable and several interval variables, CDA derives a set of new variables, called canonical functions (CAN) that are linear combinations of the original interval variables. As in PCA, CANs are obtained by solving an eigenvalues problem. The substantial difference between the two multivariate techniques is that PCs summarize the total variation in the data, whereas CANs summarize the between-groups variation. PCA analyzes the variance-covariance matrix of data to rotate axes in the direction of the maximum variation. CDA analyzes a different variance-covariance matrix obtained by the combination (the ratio) of the between-groups and within-groups variance-covariance matrices. The new axes extracted by CDA highlight differences between groups better then PCs.
Elisabetta Manca - “Use of multivariate discriminant methodologies in the analysis of phenotypic and
genomic data of cattle” -Tesi di Dottorato in Scienze Agrarie -Curriculum “Scienze e Tecnologie
Zootecniche” - Ciclo XXX -Università degli Studi di Sassari
Anno Accademico 2016-2017
Figure 3. Differences between new axes extracted by PCA (a) and CAN (b)
Figure 3 displays these differences. Suppose we have two groups of objects in a bidimensional space variable. When objects are projected along the PC, the two groups appears are not separated (Figure 3a). On the contrary, when the CAN is extracted, the two groups are perfectly separated (Figure 3b). If k-groups are involved in the study, CDA derives k – 1 CANs, each one accounting for a decreasing quota of the between- groups variation. As in PCA, the procedure stops when the variation explained by CANs is around 80-85%. The distance among groups can be measured through the Mahalanobis distance (De Maesschalck et al., 2000). Finally, the effective separation between groups can be tested by using the Hotelling’s t-square test (1933). This test, however, can be developed only if the (co)variance matrix is not singular. In a multivariate dataset, with objects in the rows and variables in the columns, the number of columns would be lower than the number of rows to obtain a full rank variance and covariance matrix. If this does not happen, the number of involved variables should be reduced (or the number of objects should be enlarged). Stepwise algorithms can help to solve the problem. Finally, CANs
Elisabetta Manca - “Use of multivariate discriminant methodologies in the analysis of phenotypic and
genomic data of cattle” -Tesi di Dottorato in Scienze Agrarie -Curriculum “Scienze e Tecnologie
Zootecniche” - Ciclo XXX -Università degli Studi di Sassari
Anno Accademico 2016-2017
are also used to develop a discriminant criterion to classify observations into one of the involved groups. In practice, CANs are applied to each object and a discriminant score is produced. An individual is assigned to a particular group if its discriminant score is lower than the cutoff value obtained by calculating the weighted mean distance among group centroids (Mardia et al., 2000).
1.4 Stepwise Discriminant Analysis
The stepwise discriminant analysis (SDA) is a multivariate technique specifically conceived to reduce the number of variables involved in the CDA. The rationale behind SDA is similar to those in the stepwise regression. The objective of a regression is to predict, for each involved individual, values of an unknown continuous variable using one or more known continuous characters. The objective of CDA is to predict the group membership of involved individuals using one or more continuous variables. When a dataset presents a high number of variables, it is possible that some of them are not essential to predict the unknown variable or to assign objects. Moreover, some of those useless variables could ruin the analysis. To avoid this problem the stepwise technique is often applied. It reduces the number of variables erasing those that are not-informational, i.e. that do not add useful information to predict the unknown variable or to assign objects to the true group. SDA can be developed through three different algorithms:
-Forward stepwise selection: where variables are included into the model one at time and those that do not improve the model are not considered;
Elisabetta Manca - “Use of multivariate discriminant methodologies in the analysis of phenotypic and
genomic data of cattle” -Tesi di Dottorato in Scienze Agrarie -Curriculum “Scienze e Tecnologie
Zootecniche” - Ciclo XXX -Università degli Studi di Sassari
Anno Accademico 2016-2017
-Backward stepwise selection: which starts from the complete dataset and remove from the model useless variables;
-Bidirectional stepwise selection: that is a combination of the first two procedures.
1.5 Use of discriminant techniques in animal science
The use of discriminant techniques is becoming very popular in animal science, from animal genetics to food quality.
Herrera at al. (1996) applied the stepwise discriminant analysis (SDA), the canonical discriminant analysis (CDA) and the discriminant analysis (DA) to some zoometrical variables (withers height, chest depth, body length, shoulder point width, rump length and width, head length and width, chest girth, and shank circumference) of five Andalusian goat breeds (Malaga, Granada, Florida, Andalusian white and black breeds), to test their discriminating power. The DA was applied to estimate the probability to assign each animal to its breed of origin by using the considered variables. This study showed that zoometric measures as head length, shin circumference and rump length could be used as discriminant characters in differentiating these goat breeds, instead chest girth, chest depth and rump width are traits with low discriminate power. Furthermore, values of Mahalanobis distance showed that most different breeds were Florida and Malaga, whereas, Granada and Malaga were the most similar breeds.
Dossa et al., (2007) used the DA to discriminate four groups of goats raised in four different vegetation zones from South to North Benin (Africa) by using morphological characters. The best discriminant model used in this study has identified only five best
Elisabetta Manca - “Use of multivariate discriminant methodologies in the analysis of phenotypic and
genomic data of cattle” -Tesi di Dottorato in Scienze Agrarie -Curriculum “Scienze e Tecnologie
Zootecniche” - Ciclo XXX -Università degli Studi di Sassari
Anno Accademico 2016-2017
discriminant variables on 12 considered (height at withers, neck length, rump height, tail length and auricular index). Mahalanobis distances among vegetation groups were significant and the two discriminant functions obtained by CDA correctly classified the 76.6% of animals to correct zone, showing that vegetation zone influence the goat ecotype.
Yakubu et al. (2010) used discriminant procedures on fifteen morphometric traits of two different Nigerian breeds of goat (West African Dwarf and Red Sokoto, both males and females). CDA selected seven most discriminant traits that were able to allocate, in average, the 99.7% of animals to respective breed (99.4% of West African Dwarf and 100% of Red Sokoto).
Several authors used DA to identify adulteration of products in dairy sector. For example, Gutiérrez et al. (2009) applied the DA on different triacylglycerol profile to distinguish between milk fat and other fats (not-milk fat in proportions of 5, 10, 15 and 20%). The discriminant procedures were able to discriminate 94.4 % of samples with level of adulteration <10%.
Dias et al. (2009) proposed a simple and economical procedure to ascertain whether a sample of goat milk is adulterated with adjunct of bovine milk. Authors developed an electronic system with 36 cross-sensibility sensors able to recognize the five different basic tastes. This system was applied on different raw skimmed milk samples of goat, cow and goat/cow. After the space variables was reduced by using the PCA, a linear discriminant model has been developed to obtain a differentiation among the different proportions of cow and goat milk. Errors in assigning some samples to goat and cow milks were probably due to the small number of the samples analyzed (19 and 16
Elisabetta Manca - “Use of multivariate discriminant methodologies in the analysis of phenotypic and
genomic data of cattle” -Tesi di Dottorato in Scienze Agrarie -Curriculum “Scienze e Tecnologie
Zootecniche” - Ciclo XXX -Università degli Studi di Sassari
Anno Accademico 2016-2017
respectively), compared to the large number of samples of goat/cow milks (142). Results of this work showed that this new electronic procedure, together with linear discriminant analysis, could be used to find adulterations in dairy industry.
Pillonel et al. (2005) used the DA to assign 183 samples of Europen Emmental Cheeses to the respective regions of origin (Western Austria, Switzerland, South Germany, Finland, France Savoie, France Brittany and France East-Central). At the first, backward SDA procedure was used to select the best discriminant factors on the base of 25 factors previously analyzed. By using the selected variables, the DA correctly assigned the 95% of samples to the true geographic group in the validation set.
Vasta et al. (2011) conducted a research to evaluate the effect of different diets on the presence of volatile organic compounds in meat beef. The researchers used four different diets to fed different groups of heifers. Ninety-four volatile compounds were used as discriminant variables. The SDA selected 16 compounds able to separate the four diets and CDA was applied on these to obtain the respective CANs. The DA correctly assigned all samples to the true respective dietary group.
Sometime DA procedures have been exploited to validate others estimation methods (Basarab et al., 1993) or to help veterinary in predicting diseases (Hailemariam et al., 2014).
With the availability of high-throughput SNP platforms for several livestock species, the discriminant techniques have been also used to analyze genomic data. The enormous number of involved variables (the SNPs) limits however the use of DA in this field. Jombart et al. (2010), to overcome this problem, introduced a new methodology of DA called Discriminant Analysis of Principal Components (DAPC) where, in developing DA,
Elisabetta Manca - “Use of multivariate discriminant methodologies in the analysis of phenotypic and
genomic data of cattle” -Tesi di Dottorato in Scienze Agrarie -Curriculum “Scienze e Tecnologie
Zootecniche” - Ciclo XXX -Università degli Studi di Sassari
Anno Accademico 2016-2017
the original variables were replaced by PCs. Solberg et al. (2009) used the PCA to reduce the dimension of the space variable in applying Bayesian methods to evaluate the genomic breeding value.
Dimauro et al. (2013) applied discriminant procedures to SNP-genotypes data of three breeds of bulls: Holstein, Brown Swiss, and Simmental. The SDA selected 48 high discriminant SNPs that in a genome wide CDA yielded a significant separation among groups. Figure 4 displays the CAN1 vs. CAN2 scatter plot in which the three breeds are clearly differentiated. All animals were correctly assigned to the group of origin.
Figure 4. Plot of the two canonical functions (CAN1 and CAN2) obtained by using 48 high discriminant markers Brown and Simmental (Dimauro et al., 2013)
Nishimura et al. (2013) studied two cattle populations, the Japanese Black and the Holstein, to detect breed label falsification in retail beef. Eighteen highly discriminant
Elisabetta Manca - “Use of multivariate discriminant methodologies in the analysis of phenotypic and
genomic data of cattle” -Tesi di Dottorato in Scienze Agrarie -Curriculum “Scienze e Tecnologie
Zootecniche” - Ciclo XXX -Università degli Studi di Sassari
Anno Accademico 2016-2017
SNPs have been used to separate the Japanese Black from Holstein and Japanese Black x Holstein (F1). The selected SNPs were able to separate the groups.
Biffani et al. (2015) used two multivariate statistical techniques to identify haplotype carriers in a cattle population. In this study, 3645 Italian Brown Swiss cows and bulls, genotyped with the Illumina’s BovineSNP50 v2 (54k) BeadChip, were divided in two groups: carriers or non-carriers of the BH2 haplotype on BTA19. Authors used the backward SDA to select SNPs that better fit the model. The error rate of classification with linear DA it was around 1% (or lower) using both two panels of SNP-chips (7K and 54K).
Elisabetta Manca - “Use of multivariate discriminant methodologies in the analysis of phenotypic and
genomic data of cattle” -Tesi di Dottorato in Scienze Agrarie -Curriculum “Scienze e Tecnologie
Zootecniche” - Ciclo XXX -Università degli Studi di Sassari
Anno Accademico 2016-2017 1.6 References
Basarab, J. A., L. M. Rutter and, P. A. Day. 1993. The efficacy of predicting dystocia in yearling beef heifers: II. Using discriminant analysis. Journal of Animal Science. 71(6):1372-1380.
Biffani, S., C. Dimauro, N. P. P. Macciotta, A. Rossoni, A. Stella and, F. Biscarini. 2015. Predicting haplotype carriers from SNP genotypes in Bos taurus through linear discriminant analysis. Genetics Selection Evolution. 47(1):4.
De Maesschalck, R. D. Jouan-Rimbaud and, D. L. Massart. 2000. The Mahalanobis distance. Chemometrics and Intelligent Laboratory Systems. 50(1):1-18.
Dias, L. A., A. M. Peres, A. C. Veloso, F. S. Reis, M. Vilas-Boas and, A. A. Machado. 2009. An electronic tongue taste evaluation: Identification of goat milk adulteration with bovine milk. Sensors and Actuators B: Chemical. 136(1):209-217.
Dimauro, C., M. Cellesi, R. Steri, G. Gaspa, S. Sorbolini, A. Stella and, N. P. P. Macciotta. 2013. Use of the canonical discriminant analysis to select SNP markers for bovine breed assignment and traceability purposes. Animal Genetics. 44(4):377-382.
Dossa, L. H., C. Wollny and, M. Gauly. 2007. Spatial variation in goat populations from Benin as revealed by multivariate analysis of morphological traits. Small Ruminant Research. 73(1):150-159.
Elisabetta Manca - “Use of multivariate discriminant methodologies in the analysis of phenotypic and
genomic data of cattle” -Tesi di Dottorato in Scienze Agrarie -Curriculum “Scienze e Tecnologie
Zootecniche” - Ciclo XXX -Università degli Studi di Sassari
Anno Accademico 2016-2017
Fisher, R. A. 1936. The use of multiple measurements in taxonomic problems. Annals of Human Genetics.7:179-188.
Gutiérrez, R., S. Vega, G. Díaz, J. Sánchez, M. Coronado, A. Ramírez and, B. Schettino. 2009. Detection of non-milk fat in milk fat by gas chromatography and linear discriminant analysis. Journal of Dairy Science. 92(5):1846-1855.
Hailemariam, D., R. Mandal, F. Saleem, S. M. Dunn, D. S. Wishart and, B. N. Ametaj. 2014. Identification of predictive biomarkers of disease state in transition dairy cows. Journal of Dairy Science. 97(5):2680-2693.
Herrera, M., E. Rodero, M. J. Gutierrez, F. Pena and, J. M. Rodero. 1996. Application of multifactorial discriminant analysis in the morphostructural differentiation of Andalusian caprine breeds. Small Ruminant Research. 22(1):39-47.
Hotelling, H. 1933. Analysis of a complex of statistical variables into principal components. Journal Education Psychology. 25:417–441.
Jombart, T., D. Pontier and, A. B. Dufour. 2009. Genetic markers in the playground of multivariate analysis. Heredity. 102(4):330.
Macciotta, N. P. P., G. Gaspa, R. Steri, E. L. Nicolazzi, C. Dimauro, C. Pieramati and, A. Cappio-Borlino. 2010. Using eigenvalues as variance priors in the prediction of genomic breeding values by principal component analysis. Journal of Dairy Science. 93(6):2765-2774.
Elisabetta Manca - “Use of multivariate discriminant methodologies in the analysis of phenotypic and
genomic data of cattle” -Tesi di Dottorato in Scienze Agrarie -Curriculum “Scienze e Tecnologie
Zootecniche” - Ciclo XXX -Università degli Studi di Sassari
Anno Accademico 2016-2017
Mardia, K.V., J.T. Kent and, J. M. Bibby. 2000. Multivariate Analysis. Academic Press, London Morrison, F. 1976. Multivariate statistical methods. McGraw-Hill, New York, NY.
Mukaka, M. M. 2012. Statistics Corner: A guide to appropriate use of Correlation coefficient in medical research. Malawi Medical Journal. 24(3):69-71.
Nishimura, S., T. Watanabe, A. Ogino, K. Shimizu, M. Morita, Y. Sugimoto and, A. Takasuga. 2013. Application of highly differentiated SNPs between Japanese Black and Holstein to a breed assignment test between Japanese Black and F1 (Japanese Black x Holstein) and Holstein. Animal Science Journal. 84(1):1-7.
Pearson, K. 1901. LIII. On lines and planes of closest fit to systems of points in space. The London, Edinburgh, and Dublin Philosophical Magazine and Journal of Science. 2(11):559-572.
Pillonel, L., U. Bütikofer, H. Schlichtherle-Cerny, R. Tabacchi and, J. O. Bosset. 2005. Geographic origin of European Emmental. Use of discriminant analysis and artificial neural network for classification purposes. International Dairy Journal. 15(6):557-562.
Ricci, R. 2003.Appunti di Statistica. Università di Firenze, Facoltà di Psicologia, Corso di Laurea in Scienze e Tecniche di Psicologia del Lavoro e delle Organizzazioni.
Solberg, T. R., A. K. Sonesson, J. Woolliams and, T. H. E. Meuwissen. 2009. Reducing dimensionality for prediction of genome-wide breeding values. Genetic Selelection Evolution. 41(1):29.
Elisabetta Manca - “Use of multivariate discriminant methodologies in the analysis of phenotypic and
genomic data of cattle” -Tesi di Dottorato in Scienze Agrarie -Curriculum “Scienze e Tecnologie
Zootecniche” - Ciclo XXX -Università degli Studi di Sassari
Anno Accademico 2016-2017
Vasta, V., G. Luciano, C. Dimauro, F. Röhrle, A. Priolo, F. J. Monahan and, A. P. Moloney. 2011. The volatile profile of longissimus dorsi muscle of heifers fed pasture, pasture silage or cereal concentrate: Implication for dietary discrimination. Meat Science. 87(3):282-289.
Yakubu, A., A. E. Salako, I. G. Imumorin, A. O. Ige and, M. O. Akinyemi. 2010. Discriminant analysis of morphometric differentiation in the West African Dwarf and Red Sokoto goats. South African Journal of Animal Science. 40(4):381-387.
Elisabetta Manca - “Use of multivariate discriminant methodologies in the analysis of phenotypic and
genomic data of cattle” -Tesi di Dottorato in Scienze Agrarie -Curriculum “Scienze e Tecnologie
Zootecniche” - Ciclo XXX -Università degli Studi di Sassari
Anno Accademico 2016-2017
CHAPTER 2
A NEW MULTIVARIATE APPROACH FOR
GENOME-WIDE ASSOCIATION STUDIES
Elisabetta Manca - “Use of multivariate discriminant methodologies in the analysis of phenotypic and
genomic data of cattle” -Tesi di Dottorato in Scienze Agrarie -Curriculum “Scienze e Tecnologie
Zootecniche” - Ciclo XXX -Università degli Studi di Sassari
Anno Accademico 2016-2017 2.1 Abstract
Traditionally, GWAS are carried out by using a single marker regression model. However, due to the multiple testing error rate, as the number of SNPs increases, the probability to obtain false positive associations enlarges. In this research, an alternative multivariate statistical method, called Discriminant Association Method (DAM), able to overcome those limitations was proposed. Genomic and phenotypic data of 409 young Marchigiana bulls, previously analyzed in a traditional GWAS were used. Seven growth, carcass and meat quality traits were measured: body weight, average daily gain, carcass weight, dressing percentage, shank circumference, head weight and pH at slaughter. Animals belonging to the tails of the phenotypic distribution (25th and 75th percentile) of each trait were selected and flagged as low (LP) or high phenotype (HP). The canonical discriminant analysis (CDA) was developed by using markers as predictors and the LP and HP groups as categorical variable. Around 190 markers for each trait were enough to significantly differentiate LP from HP. Considering SNPs selected in the ordinary GWAS, around 63% of them were confirmed by the DAM approach. The minimum number of DAM selected SNPs able to significantly discriminate groups ranged from 139 for average daily gain to 94 for body weight. The most significant markers, i.e. those with canonical coefficient greater than 0.2 were submitted to gene discovery. Thirty-three interesting loci were highlighted for the seven traits under study. This new information may be useful to better understand the genetic architecture of growth and body composition in cattle.
Elisabetta Manca - “Use of multivariate discriminant methodologies in the analysis of phenotypic and
genomic data of cattle” -Tesi di Dottorato in Scienze Agrarie -Curriculum “Scienze e Tecnologie
Zootecniche” - Ciclo XXX -Università degli Studi di Sassari
Anno Accademico 2016-2017 2.2 Introduction
Genome wide association studies (GWAS) are mainly aimed at understanding the genetic background of complex traits by relating large number of marker genotypes to observed phenotypes. Traditionally, GWAS are carried out by using a single marker regression model that includes both fixed and random effects. However, the larger the number of markers involved in the study, the greater the number of significant SNPs that could be false positives. One of the most popular methods to correct p-values for multiple testing is the Bonferroni’s approach. In practice, if k is the number of statistical tests developed in the study, the Bonferroni’s correction adjusts the α =0.05 significance threshold to α =0.05/k. So, with a SNP platform of 700 K, a marker can be declared significant if its p-value is lower than 7*10-9. The consequence is that few SNPs result significant. The Bonferroni’s correction, however, requires that all tests are independent of each other (Bush and Moore, 2012). In the GWAS contest, this hypothesis generally does not fit because as the marker density increases, tests become more correlated, due to the linkage disequilibrium among adjacent SNPs. This leads to an overcorrection applying the Bonferroni’s approach. A less-stringent chromosome-wide significance threshold is often considered: the classic p-value = 0.05 is divided by the number of SNPs in each chromosome (Li et al., 2015). So, for example, for BTA1, the significance threshold is reduced to 1.7*10−6.
A common alternative to the Bonferroni correction is the use of false discovery rate (FDR) (Benjamini and Hochberg, 1995; Osborne, 2006; Bolormaa et al., 2010). This procedure, essentially, corrects for the number of expected false discoveries. However,
Elisabetta Manca - “Use of multivariate discriminant methodologies in the analysis of phenotypic and
genomic data of cattle” -Tesi di Dottorato in Scienze Agrarie -Curriculum “Scienze e Tecnologie
Zootecniche” - Ciclo XXX -Università degli Studi di Sassari
Anno Accademico 2016-2017
also FDR can be too much conservative, depending on the fraction of discoveries that are tolerated to be false.
The test statistic distribution could be calculated using permutations (Churchill and Doerge, 1994). Under the null hypothesis that a marker has no effect on the phenotype, data are permuted by randomly assigning phenotypes to each individual thus breaking the genotype-phenotype relationship in the dataset. The procedure is repeated a prefixed number of times (generally 5,000 or 10,000). However, when the number of markers is large as in medium or high density chips, the computational time required becomes a limiting factor.
Apart from the Bonferroni’s correction, methods used to control the multiple testing error rate are, however, useful compromises that allows detecting some candidate regions that possibly affect the trait under study.
Each significant SNP obtained with the single marker regression approach explains only a small fraction of the genetic variance of quantitative traits (Maher B., 2008; Visscher et al., 2010). In fact, genetic differences usually are not located in a single locus but often involve also the surrounding part of the genome. Signatures of selection, for example, originates both from the selection pressure on a specific locus but also from the linkage disequilibrium with adjacent loci (Sorbolini et al., 2016). Thus, the analysis of the correlation structure between SNPs located in a particular genomic region or in a chromosome may offer useful insights for finding chromosomal segments associated to phenotypic expression of traits of interest. An alternative could be to develop a statistical method able to simultaneously analyze multiple markers thus accounting for most of the
Elisabetta Manca - “Use of multivariate discriminant methodologies in the analysis of phenotypic and
genomic data of cattle” -Tesi di Dottorato in Scienze Agrarie -Curriculum “Scienze e Tecnologie
Zootecniche” - Ciclo XXX -Università degli Studi di Sassari
Anno Accademico 2016-2017
genetic variance (Hayes et al., 2010; Fan et al., 2011). One example, that have obtained encouraging results, is the Bayesian regression methods that, although originally proposed for whole genomic prediction (Meuwissen et al., 2001), can be used for GWAS as well (Fan et al., 2011; Sun et al., 2011; Erbe et al., 2012).
In this paper, a statistical approach able to analyze simultaneously hundreds of SNP-genotypes based on multivariate statistical analysis is proposed. The idea is that, individuals belonging to the tails of the phenotypic distribution of a trait of interest share different allelic combinations for genes involved in its determinism. In consequence, some genes, and related markers, would act differently in the two groups. Genetic differences could be highlighted by using the canonical discriminant analysis (CDA), a multivariate technique that is able to enhance the differences between predefined groups. CDA has already been used to detect pool of markers to be used for traceability purposes in cattle and sheep (Dimauro et al., 2013, 2015), to study signatures of selection (Sorbolini et al, 2016), and to detect carries of recessive haplotypes (Biffani et al., 2015).
In the present research, a method called Discriminant Association Method (DAM), which exploits multivariate statistical techniques, was proposed to highlight possible associations between seven meat phenotypes and SNP-markers. The proposed algorithm was developed and validated by using data previously analyzed in an ordinary GWAS (Sorbolini et al., 2016). The DAM and the GWAS results were then compared.
Elisabetta Manca - “Use of multivariate discriminant methodologies in the analysis of phenotypic and
genomic data of cattle” -Tesi di Dottorato in Scienze Agrarie -Curriculum “Scienze e Tecnologie
Zootecniche” - Ciclo XXX -Università degli Studi di Sassari
Anno Accademico 2016-2017 2.3 Material and methods
The data
Data used in the present research were analyzed by Sorbolini et al. (2016) who carried out a GWAS on 409 young Marchigiana bulls belonging to 117 commercial herds. Aim of that study was the detection of markers significantly associated with carcass and meat traits. Animals were slaughtered at an age ranging from 16 to 24 months. In the GWAS, the following seven out of ten traits investigated showed markers significantly associated: body weight (BW), average daily gain (ADG), carcass weight (CW), dressing percentage (DP), shank circumference (SC), head weight (HW) and pH at slaughter (pH). Only data belonging to these seven traits were analyzed by using the DAM algorithm.
Animals were genotyped by using the Illumina’s 50 K BeadChip assay. After data editing, 43,313 markers were retained (for more details see Sorbolini et al., 2016). Phenotypes were adjusted as in the GWAS, by using the following mixed linear model:
Y D bAGE a h e
where Y =the considered phenotype (7 traits); D =fixed effect of slaughter date (46 levels); bAGE =fixed covariable of age at slaughter in month; a =random effect of animal; h =random effect of herd (117); e =random residuals. The animal effect was assumed to be distributed as ~N(0,𝜎𝑎2) where G is the genomic relationship matrix and 𝜎𝑎2 is the additive genetic variance. G was calculated according to VanRaden (2008).
For each phenotype, animals belonging to the first and the last quartile were selected and flagged as the high (HP) and low phenotype (LP) group, respectively.
Elisabetta Manca - “Use of multivariate discriminant methodologies in the analysis of phenotypic and
genomic data of cattle” -Tesi di Dottorato in Scienze Agrarie -Curriculum “Scienze e Tecnologie
Zootecniche” - Ciclo XXX -Università degli Studi di Sassari
Anno Accademico 2016-2017 The DAM algorithm for SNP association
Two multivariate discriminant techniques were in sequence applied to the data: the canonical discriminant analysis (CDA) and the discriminant analysis (DA). The CDA is a multivariate dimension-reduction technique whose main objective is the determination of relationships among a categorical variable and a list of independent variables. In particular, CDA tests if the independent variables are able to identify groups listed in the categorical variable. In our research, categories were the HP and LP groups, whereas the independent variables were the SNP-genotypes. The CDA derives a set of new variables, called canonical functions (CAN) that are linear combinations of the original characters. In general, if k-groups are involved in the CDA, k-1 CANs are extracted. In this research, having two groups for each phenotype, only one CAN was obtained. Canonical coefficients (CC) are the correlations between CAN and original variables. The greater is a CC, the larger the SNP contribution to the CAN. The separation of the two groups was assessed by means of the Mahalanobis distance and the corresponding Hotelling’s T-square test (De Maesschalcket al. 2000). This test, however, can be developed only if the pooled (co)variance matrix of data is not singular. In our research, the number of involved animals (rows of data matrix) was lower than the number of SNPs (columns), even for each single chromosome. In this condition, any multivariate technique becomes meaningless because the (co)variance matrix does not have a full rank (Dimauro et al. 2011). A reduction of the space-variables is, therefore, required. Following the suggestions of Dimauro et al. (2013), CCs of CAN extracted for each chromosome were ranked according to their absolute value. Then, SNPs whose CCs exceeded an arbitrary fixed threshold were retained. Markers selected in the 29 autosomes were joined and
re-Elisabetta Manca - “Use of multivariate discriminant methodologies in the analysis of phenotypic and
genomic data of cattle” -Tesi di Dottorato in Scienze Agrarie -Curriculum “Scienze e Tecnologie
Zootecniche” - Ciclo XXX -Università degli Studi di Sassari
Anno Accademico 2016-2017
ranked according to their CCs. Given, in general, the matrix of data, if n denotes the number of row (the animals involved in the study), at best, only n-1 variables (the SNPs) are linearly independent (Dimauro et al., 2011). However, due to the very low variation of each marker (a SNP has only 0, 1 or 2 as values) the number of linearly independent variables could be lower than n-1. The optimum space of the variables was therefore obtained by deleting SNPs with the lower CCs in an iterative process. The process stopped when the maximum number of linearly independent markers, for each phenotype, was obtained. In this condition, when the GW-CDA is developed, both the Mahalanobis distance and the Hotelling’s test can be evaluated.
The DA was used to classify animals in the two groups. In DA, the CAN is applied to each individual thus producing a discriminant score. An animal is assigned to a particular group if its discriminant score is lower than the cutoff value obtained by calculating the weighted mean distance among group centroids (Mardia et al., 2000).
Both CDA and DA were used to select the most discriminant markers. They were obtained by reducing, in a new recursive procedure, the number of SNP-variables till obtain the minimum subset of markers able to significantly discriminate the two groups (Hotelling’s test p-value <0.0001) and to 100% correctly assign animals to the true group of origin.
Statistical analyses were developed by using the PROC MIXED, CANDISC and DISCRIM of SAS (SAS Institute, Inc.).
Elisabetta Manca - “Use of multivariate discriminant methodologies in the analysis of phenotypic and
genomic data of cattle” -Tesi di Dottorato in Scienze Agrarie -Curriculum “Scienze e Tecnologie
Zootecniche” - Ciclo XXX -Università degli Studi di Sassari
Anno Accademico 2016-2017 Annotation and gene discovery analysis
For all the considered phenotypes, a gene discovery was performed in the genomic regions located around most discriminant SNPs. Annotated genes were identified from the UCSC Genome Browser Gateway (http://genome.ucsc.edu./) and National Centre for Biotechnology Information (NCBI) (www.ncbi.nlm.nih.gov) databases. Intervals of 0.25 Mb upstream and downstream of each SNP were considered. Gene-specific functional analyses were performed by GeneCards (www.genecards.org) and NCBI databases consultation. The biological function of each annotated gene (and related proteins) contained in the significant genomic regions was studied by means of an accurate literature search. Gene names and symbols were derived from the HUGO Gene nomenclature database (www.genenames.org).
2.4 Results DAM selected SNPs
The DAM procedure selected, for the all the seven studied traits, 1,031 markers spanning the entire genome. As showed in Figure 1, their distribution was not uniform. The largest number of markers (73) was found on BTA2 followed by BTA6 (59). The lowest number (15) was located on BTA29. No significant markers were observed on BTA 5.
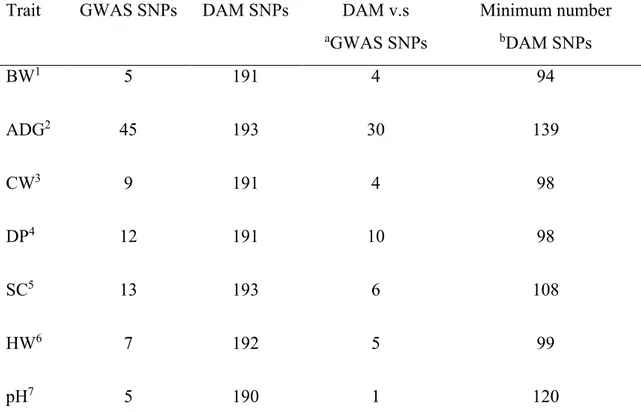
On average, around 190 linearly independent SNPs (Table 1) for each phenotype were retained. The subsequent GW-CDA developed for each trait significantly separated the
Elisabetta Manca - “Use of multivariate discriminant methodologies in the analysis of phenotypic and
genomic data of cattle” -Tesi di Dottorato in Scienze Agrarie -Curriculum “Scienze e Tecnologie
Zootecniche” - Ciclo XXX -Università degli Studi di Sassari
Anno Accademico 2016-2017
HP from the LP (p-value <0.0001) and the DA correctly assigned all animals to the true group.
Considering the GWAS selected markers (Table 1), around 63% of them were confirmed by DAM approach. For example, most of GWAS SNPs were identified by DAM for BW, DP and ADG. Only 1 over 5 markers for pH, and 6 over 13 SNPs for SC were obtained by DAM.
Figure 1. Distribution across the genome of 1,031 DAM selected markers for all seven studied traits
Some of DAM SNPs were shared by two phenotypes, as displayed in Table 2. For example, BW and ADG shared 113 SNPs, whereas for HW and DP, or PH and SC, no
0 10 20 30 40 50 60 70 80 1 2 3 4 5 6 7 8 9 10 11 12 13 14 15 16 17 18 19 20 21 22 23 24 25 26 27 28 29 N u m b er o f M ar kers BTA
Elisabetta Manca - “Use of multivariate discriminant methodologies in the analysis of phenotypic and
genomic data of cattle” -Tesi di Dottorato in Scienze Agrarie -Curriculum “Scienze e Tecnologie
Zootecniche” - Ciclo XXX -Università degli Studi di Sassari
Anno Accademico 2016-2017
common marker was found. Observing the correlations between corrected phenotypes (Table 2), the higher the correlations the greater the number of shared markers.
The minimum number of DAM SNPs able to significantly discriminate groups is reported in Table 1. These markers represent, for each phenotype, the most discriminant SNPs and their number ranges from 139 for ADG to 94 for BW.
Table 1. GWAS, DAM SNPs, number common markers and minimum number of discriminant DAM SNPs
Trait GWAS SNPs DAM SNPs DAM v.s aGWAS SNPs Minimum number bDAM SNPs BW1 5 191 4 94 ADG2 45 193 30 139 CW3 9 191 4 98 DP4 12 191 10 98 SC5 13 193 6 108 HW6 7 192 5 99 pH7 5 190 1 120
BW1 =body weight, ADG2 =average daily gain, CW3 =carcass weight, DP4 =dressing percentage, SC5 =shank circumference, HW6 =head weight, pH7 =pH at slaughter aGWAS SNP =significant markers reported by Sorbolini et al., 2016
Elisabetta Manca - “Use of multivariate discriminant methodologies in the analysis of phenotypic and
genomic data of cattle” -Tesi di Dottorato in Scienze Agrarie -Curriculum “Scienze e Tecnologie
Zootecniche” - Ciclo XXX -Università degli Studi di Sassari
Anno Accademico 2016-2017
Finally, a restricted group of top discriminant SNPs (105 for all traits) was selected by using a CC threshold equal to 0.25 (Table 3). Only these top discriminant markers were submitted to gene discovery.
Table 2. Number of selected markers shared by two phenotypes and, in bold, the Pearson correlations between corrected phenotypes.
BW1 ADG2 CW3 DP4 SC5 HW6 PH7 BW1 0.988 0.960 0.144 0.444 0.734 0.001 ADG2 113 0.946 0.131 0.441 0.722 -0.006 CW3 88 94 0.414 0.412 0.675 -0.049 DP4 3 3 17 0.016 0.002 -0.183 SC5 8 12 13 4 0.429 0.029 HW6 33 33 26 0 8 -0.015 pH7 0 1 2 1 0 3
BW1 =body weight, ADG2 =average daily gain, CW3 =carcass weight, DP4 =dressing percentage, SC5 =shank circumference, HW6 =head weight, pH7 =pH at slaughter
Elisabetta Manca - “Use of multivariate discriminant methodologies in the analysis of phenotypic and
genomic data of cattle” -Tesi di Dottorato in Scienze Agrarie -Curriculum “Scienze e Tecnologie
Zootecniche” - Ciclo XXX -Università degli Studi di Sassari
Anno Accademico 2016-2017 2.5 Association analysis
Shank Circumference (SC)
Twenty-six significant markers were found to be associated with SC (Table 3). BTA 2 showed a large number of candidate genes: close to ARS-BFGL-NGS-71755 was found the gene Titin (TTN) that encodes a large protein of striated muscle; close to marker BTB-02054371 there is Protein Activator Of Interferon Induced Protein Kinase (EIF2AK2) and close to marker Hapmap25114-BTA-49906 there is Oxysterol Binding Protein Like 6 (OSBPL6). Also still on the BTA2, close to marker BTB-000831208 (at 20 813 843 bp), several members of the Homeobox family (HOXD1, HOXD3, HOXD4, HOXD9, HOXD10, HOXD11, HOXD12, HOXD13) were located. Finally, close to marker ARS-BFGL-NGS-98126, there is the Tripartite Motif Containing (TRIM63), which plays a key role in the atrophy skeletal muscle.
Carcass Weight (CW)
Eighteen SNPs were found significantly associated with this trait (Table 3) but only one marker (UA-IFASA-6018 on BTA22) was associated to two interesting genes: the Transketolase (TKT) and Protein Kinase C Delta (PRKCD). This SNP was also found associated with the BW trait.
Elisabetta Manca - “Use of multivariate discriminant methodologies in the analysis of phenotypic and
genomic data of cattle” -Tesi di Dottorato in Scienze Agrarie -Curriculum “Scienze e Tecnologie
Zootecniche” - Ciclo XXX -Università degli Studi di Sassari
Anno Accademico 2016-2017 Average Daily Gain (ADG)
Seventeen top discriminant SNPs associated with ADG distributed across ten chromosomes were selected (Table 3). On BTA 3, four candidate genes close to marker ARS-BFGL-NGS-119955 were considered as interesting: PAS Domain Containing Serine/Threonine Kinase (PASK), the High Density Lipoprotein Binding Protein (HDLBP), the Inhibitor Of Growth Family Member (ING5) and the Deoxythymidylate Kinase (DTYMK). On BTA10 instead, two putative genes were found close to marker ARS-BFGL-NGS-116295: Lactase Like (LCT) and a member of Small Nuclear RNA Activating Complex Polypeptide 5 (SNAPC5). Finally, on BTA15, close to marker BTB-00619772 the gene of Apelin Receptor (APLNR) is annotated.
Dressing Percentage (DP)
Seventeen SNPs (Table 3) were found significantly associated with DP. On BTA1 at 54.2 Mb the Developmental pluripotency- associated protein 2 (DPPA2) gene is annotated. On BTAs 18 and 22 two loci were identified as candidate genes, the Syntrophin beta 2 (SNTB2) and the Solute carrier family 6 member 6 (SLC6A6), respectively.
Head Weight (HW)
In this study, twelve significant markers (Table 3) were found associated with HW. On BTA 7 at 44.8 Mb three putative candidate genes involved in the brain biology were annotated, the Basigin (OK blood group) (BSG), the hyperpolarization activated cyclin