SAPIENZA
UNIVERSITÀ DI ROMA
Department of Social and Economic Sciences
PhD Course in Applied Social Science, XXXI
Curriculum in Research Methods for Socio-Economic AnalysisComposite Indicators for Measuring Well-being of
Italian Municipalities
PhD Course’s Director: Prof. Antimo Luigi Farro Tutor: Prof. Filomena Maggino
Student: dr. Matteo Mazziotta
3
INTRODUCTION ... 6
PART I – THEORIES AND METHODS ... 9
1. THEORETICAL FRAMEWORK: GDP VERSUS WELL-BEING ... 10
1.1 GDP: definition and uses ... 10
1.2 Beyond GDP: scientific and political context ... 13
1.3 The role of Italian studies ... 17
1.4 GDP is not well-being: an application to real data ... 28
2. COMPOSITE INDICATORS: THEORIES AND METHODS ... 45
2.1 Manage the complexity ... 45
2.2 Formative versus Reflective model ... 46
2.3 How to construct a composite indicator ... 49
2.3.1 Mission “Replace GDP” ... 51
2.3.2 The use (good and bad) of the composite indicators ... 53
2.3.3 The “perfect” composite indicator does not exist ... 54
2.3.4 The steps characterizing the composite indicators construction ... 56
2.3.4.1 The definition of the phenomenon ... 56
2.3.4.2 The selection of the indicators ... 57
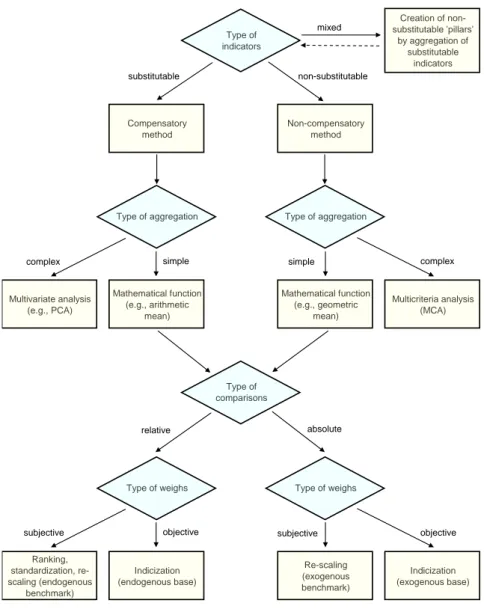
2.3.4.3 The normalization ... 57
2.3.4.4 The aggregation ... 64
2.3.4.5 The validation ... 74
2.4. Best practices ... 77
2.5. AMPI method ... 81
2.5.1 Method and formulas ... 81
2.5.2 Properties and observations ... 82
2.5.3 A variant for space-temporal comparisons ... 85
2.5.4 Theoretical aspects ... 86
2.5.4.1 The positive penalty index ... 87
2.5.4.2 The negative penalty index ... 89
2.5.5 Consideration about the method ... 92
PART II – APPLICATION TO ADMINISTRATIVE DATA ... 94
3. ADMINISTRATIVE DATA SOURCES ... 95
3.1 Introduction ... 95
3.2 Pros and cons ... 97
4
3.3.1 Data base “Labour” ... 99
3.3.2 Data base “Socio-economic conditions of the households” ... 100
3.3.3 Data base “Persons and Places” ... 105
4. WELL-BEING OF ITALIAN MUNICIPALITIES ... 110
4.1 Introduction ... 110
4.2 Domains, Individual indicators and composite indicators ... 111
4.2.1 Population and Households ... 115
4.2.2 Health ... 119
4.2.3 Education ... 121
4.2.4 Labour ... 125
4.2.5 Economic Well-being ... 130
4.2.6 Environment ... 134
4.2.7 Economy on the territory ... 139
4.2.8 Research and innovation ... 143
4.2.9 Infrastructure and mobility... 147
4.3 Analysis of the results ... 148
CONCLUSIONS ... 167
REFERENCES ... 170
6
Introduction
Well-being is a complex phenomenon. Multidimensionality is recognized in literature as its main feature. This phenomenon is in some aspects elusive and difficult to monitor, and the definition is the combination of heterogeneous components, which assume different meanings in different contexts. A universally accepted definition of well-being does not exist (yet): each country (or areas) attributes importance to dimensions that for others may not be as relevant, consistent with their culture and social dynamics. Accurate measurement of well-being is a prerequisite for the implementation of effective welfare policies, which, through targeted actions in the most critical areas, are geared to the progressive improvement of living conditions. Until some time ago, such a plurality of components was poorly valued, believing that the only income dimension could represent in an exhaustive way such a complex reality. For many years, GDP (Gross Domestic Product) has been an indisputable landmark for states all over the world, playing the key role in defining, implementing and evaluating the effects of government action. Recently, the international debate has questioned the supremacy of GDP, and initiatives have been launched which, through the involvement of a growing number of countries, aim to develop alternative ways of measuring well-being that assign the same value to its components, Economic, Social and Environmental.
Since well-being, as mentioned above, is a multidimensional phenomenon then it cannot be measured by a single descriptive indicator and that it should be represented by multiple dimensions. It requires, to be measured, the “combination” of different dimensions, to be considered together as components of the phenomenon (Mazziotta and Pareto, 2013). This combination can be obtained by applying methodologies known as composite indicators (Salzman, 2003; Mazziotta and Pareto, 2011; Diamantopoulos et al., 2008).
In this ever-evolving scenario, the Italian experience is represented by the BES (Equitable and Sustainable Well-Being) project that is now considered globally as the most advanced experience of study and analysis. It consists in a dashboard of 134 individual indicators distributed in 12 domains. In the last three BES reports, published in December 2015, 2016 and 2017 by Istat (Italian Institute of Statistics) (Istat, 2015; Istat, 2016; Istat 2017), composite indicators at regional level and over time were
7
calculated for the 9 outcome domains, creating a unique precedent in the official statistics at international level.
Recently, the debate has become from a scientific to a policy scope: parliamentary and local administrators are affirming the necessity to link the Istat well-being indicators to interventions/actions in the socio-economic field, thus constructing an even stronger connection between official statistics and policy evaluation. In fact, the Italian Parliament has finally approved on 2016 July 28 the reform of the Budget Law, in which it is expected that the BES indicators, selected by an ad hoc Committee, are included in the Document of Economics and Finance (DEF). The new regulations also provide that by February 15th of each year Parliament receives by the Minister of Economy a report on the evolution of the BES indicators. A Committee for equitable and sustainable well-being indicators is established, chaired by the Minister of Economics and composed by the President of Istat, the Governor of the Bank of Italy and two experts coming from universities or research institutions (Mazziotta, 2017).
The project, from national, is becoming local and already several local authorities, although they not have legislative obligations, are studying the well-being indicators of their territory. With these assumptions, it seems necessary to calculate well-being measures for all Italian municipalities so that administrators and citizens can dispose of them to understand and decide better policies. Since the current statistical surveys do not provide socio-economic indicators disaggregated at municipalities level (Census is the only source, every ten years and it does not collect all the information contained in the BES), it is necessary to use administrative sources, hopefully, collected in informative systems.
The thesis wants to present an experimental statistics conducted on all the municipalities of Italy where nine domains of BES are selected (Population, Health, Education, Labour, Economic well-being, Environment, Economy on the territory, Research and Innovation, Infrastructure and Mobility) and the twenty individual indicators are selected so that they can represent the phenomenon at the municipal level. The individual indicators are calculated starting from administrative sources and then composite indicators are computed in order to have a unidimensional measure. The theoretical framework adopted is represented, therefore, by the conceptual and methodological one developed by Istat and CNEL (National Council of Economy and Labour) for the BES project (Istat, 2015). The structure of the domains and the selection of indicators are derived from the national BES. In each of the domains, some
8
individual indicators are selected so that the starting matrix has 7,998 rows (the municipalities) and a variable numbers of columns (the indicators). A Composite indicator for each domain is calculated and then a unique composite indicator that synthesizes all the composite indicators is computed. Different composite indicators are calculated in order to assess the robustness of the methodologies. The results present interesting reflections also in the key of economic planning.
Therefore, the aim of the thesis is to provide socio-economic indicators for measuring well-being at the municipal level. To achieve this goal it is necessary to define a theoretical framework, to build indicators matrix at the municipal level, to calculate composite indicators in order to obtain a simpler reading and interpretation of the data. The four chapters of the paper are designed to answer these research questions.
The thesis is divide in two parts. The first, Theories and Methods, is composed by two chapters: “Theoretical framework: GDP versus being” in which recent well-being theories are presented with a view to supporting GDP; “Composite indicators: theories and methods” in which all the techniques for constructing composite indicators are presented in order to understand how synthesize data and measure multidimensional socio-economic phenomena. The second part, “Application to administrative data”, is composed by two chapters: Administrative data sources in which the data base ARCHIMEDE is described; Well-being of Italian municipalities where a robust composite indicator is applied to the domains and individual indicators in order to have a measure of well-being for all Italian municipalities. The analysis of the results leads to original conclusions in which the application of particular data classification methodologies contributes to the discussion concerning the use of databases from administrative sources for local economic planning based on well-being.
9
10
1. Theoretical framework: GDP versus Well-being
1.1 GDP: definition and uses
The Gross Domestic Product (GDP), still today, represents the fundamental measure of the production of each economic system.
This important index was born during the years of the Great Depression when, following the crisis of 1929, US President Franklin Delano Roosevelt commissioned the Department of Commerce to produce a standardized measuring instrument that would be able to constantly monitor the country's general economic conditions over time.
In 1934, this index was presented to the American Congress by its inventor, Nobel Prize in Economics in 1971, Simon Kuznets. Although it has been its creator to point out its limits, saying that "The well-being of a nation cannot be deduced from a measure of national income", GDP has since become a benchmark for all advanced economies. For this reason, a brief description of its main features is presented below.
GDP is the monetary value of all the finished goods and services produced within a country's borders in a specific time period. Although GDP is usually calculated on an annual basis, it can be calculated on a quarterly basis as well (in the United States, for example, the government releases an annualized GDP estimate for each quarter and also for an entire year). GDP includes all private and public consumption, government outlays, investments, private inventories, paid-in construction costs and the foreign balance of trade (exports are added, imports are subtracted). Put simply, GDP is a broad measurement of a nation’s overall economic activity – the godfather of the indicator world.
Intermediate goods are excluded from the calculation to avoid double counting errors. For this reason, only the added value generated at each stage of the production process is considered. In other words, the value of the product is considered net of the cost of intermediate goods. Hence, GDP can also be defined as the sum of added values of all production units in a given time span. GDP is the value of current production, and does not take into account pre-existing exchanges of products.
11
Two different measures of GDP are considered: nominal GDP and real GDP. Nominal GDP is the value of production at current prices. Real GDP is calculated at constant prices and is used to compare production in different years.
Through this index, it is possible to measure the effective variation in the wealth of a country, depurating the nominal GDP value from the incidence of the inflation rate. For example, an increase in nominal GDP could have been caused by both an increase in the amount of goods and services produced by the country and an increase in the level of prices. Real GDP ensures that this increase is due only to the first component, and not to the second, as the price level remains anchored to a reference year referred to as the "Base year".
Unfortunately, GDP is improperly used not only as a measure of a country's production, but also for the well-being of its inhabitants. Improperly because there are several problems associated with calculating this index. GDP only considers the value of goods and services traded on the market. All the others are ignored. A classic example is domestic work: its value for the calculation of GDP is zero. In addition, for some goods and services, the price is not determined by the market: the value of public services depends on the subjective assessment assigned by the citizens at the expense of the Public Administration, which may be overestimated or underestimated.
While some activities are attributed a positive value to GDP estimates, they are not directed at the production of new goods and services, but are intended to limit some "evils" such as crime. Likewise, GDP should be reduced by the value of all those phenomena whose production has negative externalities. For example, if GDP was a measure of a country's well-being, its value should be lowered by the pollutant produced.
The value of goods and services produced is measured by reference to their price, though it is not always indicative of their quality. To explain this, one can refer to the technology sector: for most products, performance improvements are not accompanied by a corresponding increase in prices. Nevertheless, a comprehensive index should always take into account the improvement of the quality of the goods.
Often GDP per capita is used to measure the amount of goods and services that each citizen may have on average on a given year. This is a completely inappropriate use that does not consider the way resources are distributed within the society. The growth of the GDP per capita value is not a sign of a corresponding increase in well-being levels, if the new wealth produced benefits only a few groups of the population rather than
12
distributing it fairly among the citizens. On the contrary, such phenomena have as their only consequence the growth of inequalities.
In fact, when measuring countries’ development using GDP, we also ignore the effects of economic growth on the environment and also the fact that ecosystems provide us with free services that, at a cost, we try to restore. These services - such as the regulation of climate and atmospheric gases, decomposition and absorption of waste, flood control, soil formation, pollination, etc. - are invaluable. No account of these services - which lack a market price, are non-negotiable and not calculated in the GDP - creates a net loss for present and future generations. If we focus attention only on the GDP, we would be blindly looking at the loss of biodiversity, deforestation and their consequent effects on the soil (erosion, geomorphic instability, desertification, salinization, etc.), on the atmosphere (climate regulation at different scales) and on human communities (mass migration due to desertification). Actually, we see that the exponential growth of population and consumption is leading towards an ecological collapse causing rapid mass extinctions (Ciommi et al., 2016).
Around the 70s, various institutions (research centres, public and private institutions) are being set up in Europe and the United States with the aim of studying and deepening the effects of organizing work on individuals. The concepts developed and carried out in those years are those of working conditions, quality of working life (QWL), and, in part, quality of life, outside the strictly productive concept.
In the last decades this indicator has been used also as a metric for the standard of living of people. However, a high level of GDP per capita in a country does not automatically mean that people living there are better off compared with those living in a country with lower GDP per capita. Moreover, the increase in income per person is not associated with the growth of the happiness (Easterlin, 1974) or well-being (Stiglitz et al., 2009).
Moreover, GDP ignores the distributional issues, the contribution of non-market goods and services such as health, education, security and governance. Attention to other aspects of well-being is, therefore, crucial (Stiglitz et al., 2009).
13 1.2 Beyond GDP: scientific and political context
The issues outlined above and the arrival of the economic crises, that have been exacerbated recently in all the countries of the world, have prompted scholars of all nationalities to question the possibility of developing alternative indicators that are most representative of the state of health and progress of a society, even for the purpose of their use in support of decisions taken by policy makers. Economists, statisticians, sociologists, ecologists and even doctors and psychologists have shown great interest in the subject.
The use of GDP, as an indicator of well-being, has not always been the wrong choice: for many years, income has been an effective measure of progress of the society. If income levels had not increased, there would not have been so much progress in the sectors of health, education and social cohesion. In short, income has been the key to progress for a long time, and a measurement of progress through income could only be considered appropriate. Once satisfied with elementary needs, however, others become the needs of individuals. Progress is evolving along new lines, and income can no longer be the only guide. In fact, the relationship between GDP and happiness is not linear: if income increases happiness increases to an extent less than proportional, and an indicator of well-being based only on that dimension would be completely misleading (Giovannini, 2011).
Researchers of all fields have contributed to the development of new measures that are in line with the complexity and variability of the reality around us. After the first OECD Forum on "Statistics, Knowledge and Politics", which took place in Palermo in 2004 and from which the Global Project on Measuring Society Progress was launched, a second was held in Istanbul in 2007, with a much higher participation, this showed a growing interest in the subject. On that occasion, the Istanbul Declaration was presented, which launched a genuine global movement regarding the issue of progress and the most appropriate methods for its estimation.
This document was signed by the European Commission, the Oecd, the Islamic Conference Organization, the United Nations, the United Nations Development Program and the World Bank, who agreed on the need to go "Beyond conventional economic measures", converting to a multidimensional approach that takes many aspects simultaneously into consideration. The opportunity to have ever-increasing amounts of statistical data relevant to every aspect of human life should have facilitated
14
this process of transition to an assessment of progress, which does not forget the importance of environmental and social factors, as well as those economic.
The Istanbul Declaration brought a first international consensus on the need to undertake a change in this regard. The most important step forward, which should be mentioned in this context, is in February 2008. Joseph Stiglitz, Amartya Sen and Jean-Paul Fitoussi gave birth to the Commission for Measuring Economic Performance and Social Progress (Commission Stiglitz-Sen-Fitoussi) at the request of then-President of the French Republic, Nicolas Sarkozy, with the aim of understanding whether and to what extent GDP could still be considered a reliable indicator of a country's wealth. Twenty-two other world-renowned scholars participated in the Commission, and eight dimensions were identified to be taken into account for accurate assessment:
1. material living conditions; 2. health;
3. education; 4. labour;
5. participation in political life and governance; 6. social relationships;
7. environment;
8. economic and personal insecurity.
The Commission was divided into three subgroups, each of which was tasked with developing a thematic specificity: measurement, quality of life and sustainability. With regard to the first, it is possible to refer to the problem-related issue of calculating the GDP. The second involves the issue of resource allocation, and the inadequacy of GDP capita, which, as we have already pointed out, undeniably represents an ineffective indicator. The third is the most important, since it is a dimension not entirely considered in the determination of GDP.
These analyses produced the following twelve recommendations:
1. material well-being should be assessed on the basis of income and consumption, rather than on the basis of production;
2. consideration should be given to the family perspective;
15
4. the distribution of income, consumption and wealth should be of greater importance;
5. a good indicator should also refer to activities not directly related to the market; 6. quality of life should be improved by considering also objective conditions and
capabilities; the assessment of health, education and environmental conditions should be improved;
7. quality of life indicators should take into account the differences between individuals and social groups, by gender and by generation;
8. through appropriate research and studies, it is important to analyze how changes in a sector of quality of life can influence others;
9. national statistical institutes should produce a composite indicator that combines different components of quality of life;
10. quality of life should be measured both in objective terms and in subjective terms. Statistical institutes should take into account how people evaluate their lives, their level of satisfaction, and their emotional state, so as to enrich the measurement of factors, for some aspects, most significant of income;
11. a set of indicators for the measurement of sustainability should be defined as an indication of the possibility of benefiting in the future of the same level of well-being in the present. The peculiarity of this perspective should require a separate assessment;
12. a set of environmental sustainability indicators should be defined with the aim of monitoring the level of environmental damage.
These guidelines were included in the Stiglitz-Sen-Fitoussi report, which the Commission published in September 2009.
In the same year, on 20 August 2009, the European Commission addressed to the Council and the European Parliament a communication entitled "Not only GDP. Measuring progress in a changing world, with the specific objective of criticizing the ability of GDP to measure dimensions such as environmental sustainability and social inclusion, affirming the need to take these limits into account when using this indicator in analysis and political debates (European Commission, 2009). Overcoming GDP becomes a matter of paramount importance as the effectiveness of measures taken by policy makers also depends on the quality of the indicators they use to support their
16
decisions. The Commission opens up cooperation with all the countries wishing to engage in the project in order to identify shared and applicable international indices.
In order to obtain the most suitable indicators for the measurement of well-being in an ever-changing context, five actions were defined.
First of all, GDP must be completed with environmental and social indicators. The
environmental index will have to measure the level of pollution and damage to the environment: therefore, a decrease in this value will be a positive sign of the steps forward in this direction. The index should consider aspects such as climate change and energy consumption, nature and biodiversity, air pollution and its effects on health, water use and pollution, and finally waste generation and the exploitation of resources. The Commission also proposes the possibility of drawing up a further index, which measures this time the quality of the environment and not the damage it produces. As far as social indicators are concerned, measuring the quality of life and the well-being of citizens is indispensable for policy makers to respond more in their own way.
The decision-making process needs accurate, almost real-time, information.
Environmental and social data are updated at times that are totally inappropriate to government needs. It is therefore recommended to use tools such as satellites, automatic detection stations and the Internet to ensure the availability of reliable data on environmental conditions. Social data, obtained in most cases by sample surveys, will need to be published in a timely manner, minimizing the time elapsed from the collection phase.
Distributions and inequalities should be subject to more accurate measurements,
since, as the Committee reiterates, social and economic cohesion is one of the objectives of the Union and cannot be overlooked. Per capita GDP is a superficial indicator, which gives no information on the disparities between citizens.
The Commission should develop, together with the Member States, an evaluation table for sustainable development, with particular attention to the environmental
sustainability thresholds that should in no way be exceeded. For such thresholds, risk areas should be defined so as to alert policy makers before they reach a non-return point.
National accounts should be extended to cover environmental and social issues,
pursuing that experiment already attempted by the Commission in 1994, concerning the so-called "green accounting". Since then, Eurostat and Member States have begun to develop methods for calculating environmental accounts.
17
In 2010, these goals were welcomed by the Conference of Presidents and Directors General of the National Statistical Institutes of Europe with the Memorandum of Sofia, following which a Sponsorship Group was established to "Measure Progress, Well-being and Sustainable Development". This committee should have contributed to identifying more effective ways of using existing statistics to produce indicators that are more responsive to the intended purpose. The final report contained a list of indications that the ESSC, the European Statistical Systems Committee, should have adopted by 2020.
In this context, three domains were considered:
1. the perspective of households and aspects regarding income distribution, consumption and wealth;
2. multidimensional measures of quality of life; 3. environmental sustainability.
1.3 The role of Italian studies
The experiences described are the cornerstone of the path that has been officially launched in Italy since 2010 and has evolved into an inter-institutional colLabouration agreement between Cnel and Istat. The two administrations should "…develop a shared definition of the progress of Italian society, expounding the most important economic, social and environmental areas for the well-being of citizens, by selecting and disseminating a set of indicators of high statistical quality representative of different domains". They should have been expressed in numerical terms so that the non-experts can better understand.
To achieve this goal, an address committee was set up, consisting of members designated by Cnel and Istat and led by two coordinators, one representing Cnel and one representing Istat; a Support Group, which should have been responsible for coordinating the two administrations and supporting the Committee in its work; a Scientific Commission (the author was member of this Commission) that, keeping in mind the international developments, should have developed the most appropriate statistical indicators for our country. This process should have directly involved
18
members of civil society and the scientific community to ensure democratic legitimacy and, at the same time, scientific validity.
The first step is to deepen the concept of Equitable and Sustainable Well-Being, which gives the name to that project. Giving a definition of well-being is an arduous task. This term assumes different meanings with varying times, places, and cultures, and each country should have its own measurement parameters different from those of others. In order to understand the fundamental determinants of well-being, we start from the analysis of the framework published by the Ocse (Hall, J. et al., 2010), which was taken over by Cnel and Istat as a benchmark for their activity.
In this conceptual framework (Istat, 2015), the life of humans takes place in two related systems: the human system and the ecosystem. Through the management of the resources made available by the ecosystem, man is fed by increasing his well-being at individual and social level. Individual well-being is based on attributes such as physical and mental health, understanding of the world in which it lives, its work, while social well-being is focused on relationships between individuals and their degree of trust and mutual cohesion. Humanity could not live in the absence of political and economic institutions that govern its development, and a cultural environment functional to its growth. Unlike what happens to the human system, which, as we have just seen, derives its well-being from a variety of conditions, the health of the ecosystem is measured by a single domain, which sums up the situation of the earth, the waters, the atmosphere, and the biodiversity.
For real well-being, resources must be equally distributed not only among individuals of the same generation, but also between different generations, with a view to future sustainability. From here, the expression Equitable and Sustainable Well-being
19
is more clear, which we can at this point synthetically define as the well-being of today's society, measured in function of that of future generations.
This framework was adapted to the Italian case through extensive consultation, which took place in February 2011 and was part of one of the most important social surveys carried out by Istat: Annual Multipurpose Survey on Aspects of Daily Life. This is a sample survey that Istat has been carrying out annually since 1993, and it is designed to detect the lifestyles of Italian citizens and their degree of satisfaction with the functioning of public services that should improve the quality of their life. Inside the 2011 survey, in the "Daily Life" section, a question was asked for people over the age of 14, with the purpose of understanding what the major well-being dimensions were. A list of 15 conditions was predisposed and respondents were asked to express a significance score from 0 to 10 for each of them.
The interviewed sample, representative of the entire Italian territory, was made up of 45,000 people of different social extraction: a large sample size, which confirms the reliability of the results obtained and represents a unique case on the international scenario. The collected data was used by the Steering Committee for the construction of the Italian theoretical framework, which currently consists of two groups of domains (Istat, 2016). The first group consists of so-called "outcome" domains, the dimensions that directly affect human and environmental well-being. The second includes so-called "contextual" or "instrumental" domains, which, while not having a direct impact on well-being, are functional to its improvement. The domains are 12. The outcome domains include 9 dimensions: health, education and training, work and life-time reconciliation, economic being, social relationships, security, subjective well-being, landscape and cultural heritage and the environment.
Health can be considered as the starting point in the definition of individual well-being: absence of health can lead to the inability of the individual to access other dimensions of wellbeing such as work, economic well-being, social relationships and subjective well-being. All aspects of human life are affected by health. Disease can lead to alienation from work, increased spending to address the need for medication, care and assistance, less sociality, and less opportunity to interact with others. This will imply low probability that the individual will be satisfied with his condition. The centrality of this domain also stems from the finding that health conditions accompany the person at all stages of his existence, from his birth to his death. For example, while working conditions affect the individual only once he has entered his workplace, the
20
need to preserve the health and the search of physical and psychic well-being occurs at all ages.
Education qualifies the person: it is his bag of experience, the system of knowledge and skills acquired during his life. Through training, the individual matures his own view of reality, and develops his own attitude towards the world. Education is the key to accessing the political, economic and social life of your country. Ignorance in the sense of lack of education implies a distorted and only partial understanding of the phenomena that affect the community and prevents man from confronting others in a civil and constructive manner and to contribute to the cultural growth of the country. Ignorance, in other words, is synonymous with isolation, neglect, degradation and in any case it is a symptom of the decay of the image of the country.
Labour is more of a source of livelihood for the individual. Participation in the world of work represents the most striking goal of a lifetime, the natural outcome of a course of study and training that the individual has started since his earliest age, the currency with which the country should repay 'the contribution that the individual can give to society in terms of acquired knowledge and skills. Working means to realize oneself, making sense of one's own existence. Work ennobles man, elevating him from his individual condition and becoming part of a collective, makes it useful, putting him in the service of the needs of others, and enriches it through experience and social exchange. As enshrined in our Constitutional Charter, it represents for the person a right and at the same time a duty (Article 4). Our Republic is "Founded on work" (Article 1) And, in the Italian case, it can only represent an indispensable dimension of individual well-being. This domain measures not only the employment levels of the country, but also the quality of work and the ability of individuals to reconcile work and family needs.
Economic well-being has over time become an elusive dimension for many individuals and for many families. The economic crisis has falsified the purchasing power, making in many cases impossible even the same survival. Economic resources are an indispensable tool for achieving adequate standards of living, a fundamental determinant of human dignity. Having an income greatly affects the perception of individual satisfaction with your life: an individual who does not have sufficient economic resources will not be able to buy the goods needed to meet his needs, will not have access to public and private services which improve the quality of life, will have fewer opportunities for social interaction and less opportunities for fun and leisure. In
21
addition to income and capacity of consumption, this domain also takes into account other dimensions, such as wealth and the possession of durable goods.
In an increasingly dynamic society, social relationships are a decisive component of wellbeing. They refer to the way in which the individual relates to the other members of society, to his network of contacts, and to the influence that he exerts and receives. Social relationships are an investment: through interaction with others, the individual can profit from his potential, making him known and appreciated in social life and the world of work. Relationships have a direct influence on subjective well-being and perception of the individual's realization.
Security inevitably affects the quality of life. This domain wants to measure the level of crime of the country, which, if too high, can have negative effects on social relations, on subjective well-being and on economic well-being. Law enforcement should protect individuals and should be a tool of defence: when no one respects it, the individual has the perception of being alone, having to be careful of himself, precluding the possibility of establishing relationships with others, increasing spending to protect themselves from crime (immediate example is the railing or armoured doors to defend their home) and, above all, by changing their lifestyle. In many circumstances, victims of crimes have serious psychological damages: they have difficulty re-entering the social context and lead a normal life, they must be supported and guided in this recovery path of their own person. The fear and the perception that law enforcement does not preserve a climate of security and stability in everyday life has significant repercussions on the well-being of the population.
Subjective well-being can be considered as a transversal dimension. It represents a subjective assessment of the individual condition as a whole, based on the analysis of aspects related to other domains, such as health status, job position, economic availability, community of affiliation, the environment in which the individual lives and works, the quality of the services at his disposal, and so on. In short, the subjective data supports the objective data. If the purpose of BES is to detect the well-being of a country, then measurement cannot be ignored by examining the attitudes, perceptions, and feelings of the community. The peculiarity of the BES is the desire to give social legitimacy to indicators that, unlike GDP, must reflect the actual status of living conditions of the population, rather than translate into abstract data and, in many cases, completely meaningless. Of course, the objective aspect cannot be missed, to overcome the possibility of distorted, conditioned and unrealistic evaluations. Objectivity, if not
22
accompanied by social feedback, can become theoretical, close to reality and inadequate to represent phenomena of everyday life.
The landscape and the cultural heritage represent the distinctive features of our country. The Article 9 of the Italian Constitution Charter states that the Republic "Protects the countryside and the historical and artistic heritage of the nation". This means that they should be the subject of continuous valorisation. The degradation, the lack of attention, the lack of attention to the variety and the beauty of our territories and our past and our cultural and artistic tradition can negatively affect the well-being of a country whose economy, as many have said, could only live with tourism. Of the 193 countries that have acceded to the UNESCO Convention, Italy is the country with several heritage sites of humanity (currently 51, of which 47 cultural sites and 4 natural sites) and 41 other sites are part of the so-called "Tentative list", advanced by the Italian state to the World Heritage Centre. “Heritage is our legacy from the past, what we live
with today, and what we pass on to future generations. Our cultural and natural heritages are irreplaceable sources of life and inspiration”. This thought encompasses
the essence of this domain, permeating it with obvious references to the theme of sustainability: cultural and natural heritage become "irreplaceable sources of life and inspiration", a legacy of generations passed on to the future, a capital very precious of which we are fortunate heirs.
The environment is the cornerstone of our lives. In the environment, we move every day and from it we draw our livelihood from the air we breathe to the resources that feed the production processes of the industry without stopping. In recent years, the need for an efficient use of natural resources has become an impetus. Many of the non-renewable sources of energy, such as oil, carbon and natural gas, are running out of use. They need very long regeneration times and companies to survive must use alternative sources. The secondary sector is moving more and more towards renewable energy sources such as the sun, wind, water, and so on and in Italy, the share of electricity consumed by renewable sources on gross domestic consumption rose to 33.4%, higher than the European average (27.5%) (Istat, 2016). This domain also detects the environmental impact of productive activities, taking into account aspects such as CO2 and other pollutants, the problem of waste disposal, the protection of land and sea.
The domains of context are three: policy and institutions, research and innovation, quality of services. Politics and institutions should be the pillars of a country. Institutions should ensure balance and stability, and politics should be at the service of
23
citizens by using public money to provide services that improve the quality of life. This domain takes into account issues such as citizen trust in institutions (parliament, parties, local institutions, etc.) and their degree of participation in the country's political life through the exercise of the right to vote. Being a context dimension, politics and institutions do not represent themselves a determinant of well-being, but they can increase or reduce it by acting on each of the outcome domains described above. Government action, through ministries, laws, regulations, intervenes in areas such as health, education, work, country security and all other factors that contribute to the definition of well-being of the population.
Research and innovation are the engine that drives the progress of a nation. If these two dimensions were not sufficiently valued, the country would risk losing ground in a constantly evolving context, which does not allow any hesitation. Article 9 of the Italian Constitution Charter states that "the Republic promotes the development of culture and scientific and technical research". This implies that it is a primary duty of the State to invest in research, both basic and applied, so that the country can advance in knowledge, making its contribution to this path of scientific and technological evolution involving all people in the world.
The quality of services greatly influences the well-being and quality of life of citizens. This domain involves different dimensions, taking into consideration heterogeneous services such as health services, childcare or mobility.
In the construction of the twelve domains, the Address Committee wanted to exploit all the available statistical information, but only the disaggregated indicators at the regional level, in order to have a better understanding of the phenomena considered. The indicators have been selected by the Scientific Commission taking into account the following general rules (Istat 2015):
for each domain, a small group of indicators had to be identified that only measured the aspects of greater interest in the determination of individual and social well-being;
the indicators must have a non-ambiguous polarity with respect to the concept of well-being;
in order to be able to analyse the evolution of phenomena over time, the indicators with time series available should be preferred;
24
each individual indicator should be used within a single domain, avoiding overlapping with others;
all the individual indicators had to be disaggregated at regional level.
The individual indicators identified were 130. Citizens, institutions, research Centres, associations and companies were directly involved in this process, who were able to fill out an online questionnaire and participate in a blog through the www.misuredelbenessere.it website, developed with the aim of spreading information about the project. Through these initiatives the legitimacy of the indicators was further strengthened.
In the last three BES reports, published in December 2015, 2016 and 2017 by Istat (Istat, 2015; Istat, 2016; Istat, 2017), composite indicators at regional level and over time were calculated for the 9 outcome domains, creating a unique precedent in the official statistics at international level.
Recently, the debate has become from a scientific to a policy scope: parliamentary and local administrators are affirming the necessity to link the Istat well-being indicators to interventions/actions in the socio-economic field, thus constructing an even stronger connection between official statistics and policy evaluation. In fact, the Italian Parliament has finally approved on 2016 July 28 the reform of the Budget Law, in which it is expected that the BES indicators, selected by an ad hoc Committee, are included in the Document of Economics and Finance (DEF). The new regulations also provide that by February 15th of each year Parliament receives by the Minister of Economy a report on the evolution of the BES indicators. A Committee for equitable and sustainable well-being indicators is established, chaired by the Minister of Economics and composed by the President of Istat, the Governor of the Bank of Italy and two experts coming from universities or research institutions (Mazziotta, 2017).
"Equitable and Sustainable Well-being" must be part of economic planning from 2018, as envisaged by Law 163/2016 (Amendments to Law N. 196 of 31 December 2009 concerning the content of the budget law in implementation of Article 15 of 243 of 24 December 2012) with 12 indicators provided for in a decree of the Ministry of the Economy (Act of Parliament submitted to Parliament's opinion N. 428). The objective is to complement the Gross Domestic Product (GDP) with a set of indicators that take into account the fundamental variables of well-being which, especially for developed
25
countries, are not correlated to the GDP trend. Italy is the first European country and the first in the G7 to include well-being indicators in economic programming.
The proposed indicators are 12:
1. Adjusted Average income per capita. Relationship between the adjusted gross disposable income of households (consumers and producers) (i.e. inclusive of the value of services provided by public and non-profit institutions), and the total number of people resident in Italy (nominal values in euro). It allows you to estimate the total amount of income available to people resident in Italy, including the value of services;
2. Inequality Index of Available (disposable) Income. The ratio between the total income received by 20% of the population with the highest income and that received by 20% of the lowest income population. The index provides information on the distance in terms of income among the richest and the poorest who, considering equivalent income, takes into account the different family composition (different needs between children and adults, economies of scale realized with coexistence);
3. Absolute Poverty Index. Percentage of people belonging to households with total spending on consumption below the absolute poverty threshold, on the total number of residents. It represents the percentage of people who fail to acquire a predetermined set of goods and services. The thresholds for absolute poverty are differentiated by family size, age classes of components, macro-area and size of the municipality of residence, and reflect territorial differences in the cost of living;
4. Life Expectancy in good health at birth. The average number of years a child born in the reference year can expect to live in good health, assuming that the risks of illness and death at the different ages observed in the same year remain constant over time. The indicator is calculated as the ratio between the cumulated years of good health from birth onwards and survivors. The indicator allows to evaluate the quality of survival, which is particularly relevant in the current phase of the demographic and health transition, characterized by population aging and the spread of chronic-degenerative pathologies;
5. Excess Weight. Standardized proportion of people over the age of 18 and overweight or obese over the total age of 18 and over. The indicator refers to the
26
World Health Organization (OMS) classification of the Body Mass Index (BMI: ratio between weight, Kg, and height square, in meters), which identifies people overweight (25 <= BMI <30) or obese (BMI => 30). The indicator is standardized using the European standard population by 2013. Excess weight is an important health risk factor. It is associated with cerebral and cardiovascular disease and musculoskeletal, diabetes, hypertension, cancer, liver disease or gallbladder disease;
6. Early exit from the education and training system. Percentage of population aged 18 to 24 years with the highest secondary school diploma), who is not in possession of regional vocational qualifications obtained in courses lasting at least 2 years and does not attend education courses in other training activities. Reducing the proportion of people who abandoned the education and training system early is essential to increasing the level of skills of the population and reducing the risk of social exclusion. The indicator is a target measure of the Europe 2020 strategy, which aims to reduce the drop-out rate below 10% by 2020 at European level (national target: 16%);
7. Lack of participation at work Index. Relationship between the sum of unemployed and inactive "available" (people who have not been looking for work in the last 4 weeks but are available to work), and the sum of work forces (both employed and unemployed) and inactive "available"; the quantities refer to the population between 15 and 74 years. The indicator expresses a measure of unsatisfied work supply wider than the unemployment rate since it also captures that part of the inactive population who declares themselves available to work while not looking for work within the 4 weeks preceding the interview, thus giving account of the phenomena of discouragement and "attendant" behaviours due to the results of past research actions;
8. Relationship between the employment rate of women aged 25-49 with preschool children and women without children. Relationship between the employment rate for women of 25-49 years with at least one pre-schooler (0-5 years) and the employment rate of 25-49 years-old without children per 100. The quality of employment is also measured by the fact that women with young children are able to reconcile paid work with family care work. In this sense, the indicator is an indirect measure of the adequacy of welfare services aimed at reconciling home-work commitments;
27
9. Predatory Crime Indicator: Number of victims of home burglaries, pick-pocketing and robberies per 1000 inhabitants. The number of victims of home burglaries is calculated by multiplying, for each year, the average family size for the number of home burglaries. The calculation of the indicator is based on the data of the reports of the crimes from the police statistics (source Ministry of the Interior), corrected with the quota average of shadow of the victims of crime, for each type of crime, deduced from the surveys on the citizens' security (2008/2009) carried out by Istat;
10. Efficiency Civil Justice Index (effective average duration in days of ordinary civil court proceedings defined by the courts). The figure takes into account the ordinary and first-degree civil proceedings (litigation + non-litigation) of the SICID area (Sistema Informatica Contenzioso Civile Distrettuale - Computer System District Civil Litigation), net of the activity of the tutelary judge and of the preventive technical assessment in matters of social security. The SICID area includes registers of civil litigation, voluntary jurisdiction and labour litigation. The indicator can be considered an indirect measure of the efficiency of civil justice, an essential condition both for the proper functioning of the economic system and for the trust of citizens in the institutions;
11. CO2 Emissions and other altering climate gasesTons of CO2 equivalent emitted on an annual basis from agricultural, urban and industrial activities per inhabitant. Emissions of carbon dioxide (CO2), methane (CH4) and nitrous oxide (N2O), expressed in "tons of CO2 equivalent" are included, with weights that reflect the heating potential in relation to carbon dioxide: 1 for CO2 ; 298 for N20; 25 for CH4. The compensatory effect linked to the presence of woods and other plant cover is not considered;
12. Index of Illegal Construction: Number of illegal buildings per 100 buildings authorized by the Municipalities. The indicator expresses a direct measure of the deterioration of the landscape, but can also be read as a proxy of the "rule of law" in the use of the territory, in fact the collective well-being and the cohesion of local communities depend significantly on a correct balance between public and private interests.
Four of the indicators outlined above are already included in the Document of Economy and Finance (DEF) 2017: average adjusted income per capita; income
28
inequality index available; rate of non-attendance at work and CO2 and other gaseous emissions. The decree will still have to be applied from 2018 onwards. The Budget Committee of the House of Representatives has also suggested, among other observations, to analyse the possibility of introducing a composite indicator in the upcoming revisions of the indicator list.
The project, from national, is getting local and already several local authorities, although they not have legislative obligations, are studying the well-being indicators of their territory. With these assumptions, it seems necessary to calculate well-being measures for all Italian municipalities so that administrators and citizens can dispose of them to understand and decide better policies. Since the current statistical surveys do not provide socio-economic indicators disaggregated at level of municipalities (Census is the only source, every ten years and it does not collect all the information contained in the BES), it is necessary to use administrative sources, hopefully, collected in informative systems.
1.4 GDP is not well-being: an application to real data
As written above, for several years the discussion about the role of Gross Domestic Product (GDP) compared to the measurement of well-being and quality of life of citizens is extensive, continuous and involves experts of different disciplines at the international level. Whereas in the past the debate was focused mainly on developing countries, however, confined to the academic world, in recent years the focus has shifted towards the high-income countries and involving national and international institutions.
Many statistical offices, as well as non-governmental organizations, think tanks and research centres have proposed new indicators that exceed the traditional view of economicist being. The assumption, discussed in the literature, that GDP and well-being are positively correlated is disavowed. However, it seems to increase the belief that an increase of one can match the contraction of the other. Or, even better, the two measures explain different aspects of the socio-economic reality by a geographical area or a specific sub-population.
The publication by Italian Institute of Statistics (ISTAT), in December of 2015, of the third report on Equitable and Sustainable Well-being (BES) has marked a unique
29
case in international official statistics since methods, known in the literature as composite indices (OECD, 2008) in order to synthesize the individual indicators for each pillar (Mazziotta and Pareto, 2013; Mazziotta and Pareto, 2016) have been used. The goal is to measure the well-being as a multidimensional phenomenon and interpretation of a latent factor making it, therefore, one-dimensional and visible. The resolution of the complexity represented by a "classical" dashboard opens the way to new statistical analysis to compare among them the composite indices of each domain by understanding the reciprocal influences (correlations) as well as the relations between these composite indices and the GDP. The aim of the section 2 of the paper is to analyse the mutual influence among composite indicators of the domains and measure how much the GDP fails to explain the latent factor well-being, based not on economic theories but using statistical models in order to quantify precisely the percentage of this divergence.
In fact, the correlation matrix among the composite indicators of the BES domains is presented below; furthermore, it should be noted that the factors generated from the Principal Components Analysis, applied to the composite indices of the BES, placed in relation to GDP, showing its partial informative capacity to explain wellbeing.
The well-being composite indicators used in this section are selected from BES 2015 report (Istat, 2015). In particular, these are the composite indicators of the nine dimensions of BES (Health, Education and Training, Labour, Well-being, Social relationships, Security, Subjective well-being, Landscape and cultural heritage, Environment), calculated at the Italian regional level, to which some complementary indicators were added.
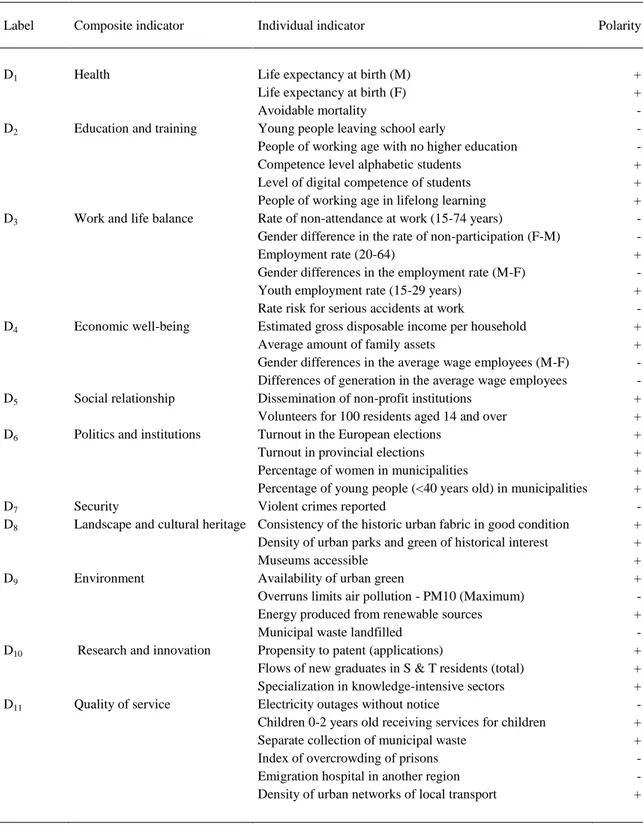
In table 1.4.1, the list of the indicators, with labels and years of reference, is presented. For a detailed description of the indicators, please refer to ISTAT volume (2015).
30
Table 1.4.1 - Well-being composite indicators in Italy (source: Istat, 2015)
Label Well-being indicator Year
HEA Composite indicator of health 2013
EDU Composite indicator of education and training 2014
QOW Composite indicator of quality of work 2014
EMP Normalized employment rate 2014
INC Composite indicator of income and inequality 2014
HAR Composite indicator of economic hardship 2014
REL Composite indicator of social relationships 2014
SAF Composite indicator of safety 2014
HOM Normalized homicide rate 2014
LSI Life satisfaction index 2014
LAN Composite indicator for landscape and cultural heritage 2011
ENV Composite indicator of environment 2012
In table 1.4.2 the correlation matrix of the 12 composite indicators and GDP is reported (year 2014).
Table 1.4.2 - Correlation among well-being composite indicators and GDP
Well-being indicator
HEA EDU QOW EMP INC HAR REL SAF HOM LSI LAN ENV
HEA 1.000 0.842 0.911 0.917 0.906 0.876 0.902 -0.232 0.457 0.871 0.803 0.559 EDU 0.842 1.000 0.807 0.850 0.841 0.832 0.829 -0.119 0.190 0.826 0.763 0.540 QOW 0.911 0.807 1.000 0.963 0.963 0.913 0.842 -0.201 0.452 0.791 0.784 0.538 EMP 0.917 0.850 0.963 1.000 0.969 0.908 0.884 -0.229 0.413 0.821 0.809 0.494 INC 0.906 0.841 0.963 0.969 1.000 0.916 0.887 -0.172 0.452 0.858 0.799 0.555 HAR 0.876 0.832 0.913 0.908 0.916 1.000 0.845 -0.185 0.404 0.785 0.700 0.478 REL 0.902 0.829 0.842 0.884 0.887 0.845 1.000 -0.084 0.427 0.927 0.865 0.639 SAF -0.232 -0.119 -0.201 -0.229 -0.172 -0.185 -0.084 1.000 -0.048 0.020 -0.129 0.178 HOM 0.457 0.190 0.452 0.413 0.452 0.404 0.427 -0.048 1.000 0.418 0.228 0.428 LSI 0.871 0.826 0.791 0.821 0.858 0.785 0.927 0.020 0.418 1.000 0.775 0.696 LAN 0.803 0.763 0.784 0.809 0.799 0.700 0.865 -0.129 0.228 0.775 1.000 0.532 ENV 0.559 0.540 0.538 0.494 0.555 0.478 0.639 0.178 0.428 0.696 0.532 1.000 GDP 0.889 0.748 0.889 0.928 0.899 0.834 0.873 -0.221 0.554 0.847 0.733 0.577
As you can see, the majority of composite indices are positively correlated with each other (HEA, EDU, QOW, EMP, INC, HAR, HOM, LSI, LAN, ENV), and the values are very high (r ≥ 0,550). The composite indicator of environment (ENV) and the rate of homicides (HOM) are positively correlated with this set of indicators, but with different intensity: ENV (0,700 ≥ r ≥ 0,450) and HOM (0,450 ≥ r ≥ 0,200).
The composite indicator of security, instead, shows a slight negative correlation with the other composite indices (0,200 ≥ r ≥ -0,250).
31
Regarding the correlations of the 12 composite indicators with GDP, the highest correlation is observed with employment rate (EMP), followed by the composite indicator of income and inequality (INC), the composite indicator of quality and satisfaction work (QOV) and the composite indicator of health (HEA).
The composite indicators less concordant with the GDP are the rate of homicides (HOM), with r = 0.554, and the composite indicator of environment (ENV), with r = 0.577; while the composite indicator of security is the most discordant (SAF) since it shows a negative correlation with GDP (r = -0.221).
These results confirm that if, on the one hand, the main well-being composite indicators can be 'explained' by the GDP, some of them, such as those relating to security and the environment, are almost completely 'unconnected' from this measure.
The results of the previous section suggest the application of PCA (Principal Components Analysis) on the matrix composed by the 12 composite indicators.
As known, PCA is a multivariate technique that, starting from a set of original indicators, allows to obtain new indicators (principal components or factors) with the following features: i) decreasing importance; ii) orthogonal; iii) linear combination of the starting indicators. This allows to describe the statistical units with a lower number of new indicators, maximizing the proportion of ‘explained variance' (Dunteman, 1989).
In figure 1.4.1 the scree-plot and the PCA are presented.
From the scree-plot examination, an elbow is evident at the second factor and this means that most of the variability of Italian regions (80.77%) can be explained by the first two factors. The third factor explains 7.63% of the remaining variance, but having an eigenvalue of less than 1 (λ = 0.914) may be insignificant. By projecting the original variables in the plane of the first two main components, the circle of correlations is obtained, where each composite indicator is represented by a point with coordinates equal to the two coefficients of correlation with the first and second factors. Note that the first factor is strongly correlated to 9 composite indicators on 12, while the second represents only the composite indicator of safety (SAF). Finally, the standardized homicide rate (HOM) and the environmental composite indicator (ENV) are to be placed in an intermediate position between the two axes, partially correlating with both factors.
32
Figure 1.4.1 - Scree-plot and correlation circle of PCA
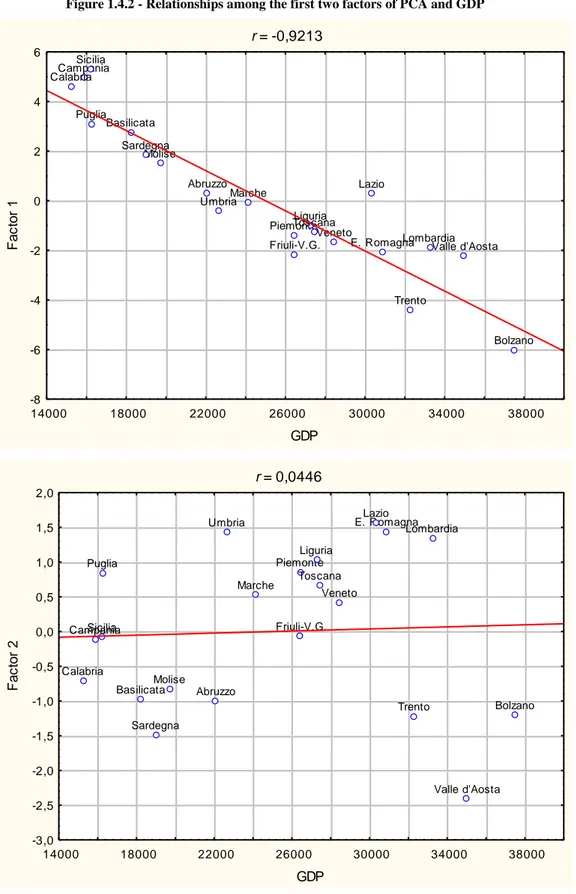
Figure 1.4.2 shows graphical representations of the relationship between GDP and the first two factors of the PCA.
70,49% 10,28% 7,62% 4,05% 2,49% 1,80% 1,04% ,84% ,71% ,38% ,16% ,15% 0 1 2 3 4 5 6 7 8 9 10 11 12 13 Factor 0 1 2 3 4 5 6 7 8 9 10 E ig e n v a lu e Well-being indicator HEA EDU QOW EMP INCHAR REL SAF HOM LSI LAN ENV -1,0 -0,5 0,0 0,5 1,0 Factor 1 : 70,49% -1,0 -0,5 0,0 0,5 1,0 F a c to r 2 : 1 0 ,2 8 %
33
Figure 1.4.2 - Relationships among the first two factors of PCA and GDP
The correlation between GDP and the first factor is very high (r = 0.9213), confirming that a large part of the information on the well-being of the regions can be derived from GDP. It is interesting to note, however, that the first factor explains about
r = -0,9213 Piemonte Valle d'Aosta Liguria Lombardia Bolzano Trento Veneto Friuli-V.G. E. Romagna Toscana UmbriaMarche Lazio Abruzzo Molise Campania Puglia Basilicata Calabria Sicilia Sardegna 14000 18000 22000 26000 30000 34000 38000 GDP -8 -6 -4 -2 0 2 4 6 F a c to r 1 r = 0,0446 Piemonte Valle d'Aosta Liguria Lombardia Bolzano Trento Veneto Friuli-V.G. E. Romagna Toscana Umbria Marche Lazio Abruzzo Molise Campania Puglia Basilicata Calabria Sicilia Sardegna 14000 18000 22000 26000 30000 34000 38000 GDP -3,0 -2,5 -2,0 -1,5 -1,0 -0,5 0,0 0,5 1,0 1,5 2,0 F a c to r 2
34
70% of the total variance. As a result, GDP does not 'capture' the remaining 30% of the information. In fact, the second factor in the PCA, which represents security (SAF) and, in part, the environment (ENV), is totally uncorrelated to GDP (r = 0.0446).
Note that the first factor cannot be used as a composite indicator of well-being at least for two reasons. Firstly, it summarize a set of indicators only because they are correlated among themselves, but not because they are functions of a common latent variable. Secondly, it ignores some important indicators, such as SAF. In fact, it accounts for only 70% of the information about the well-being.
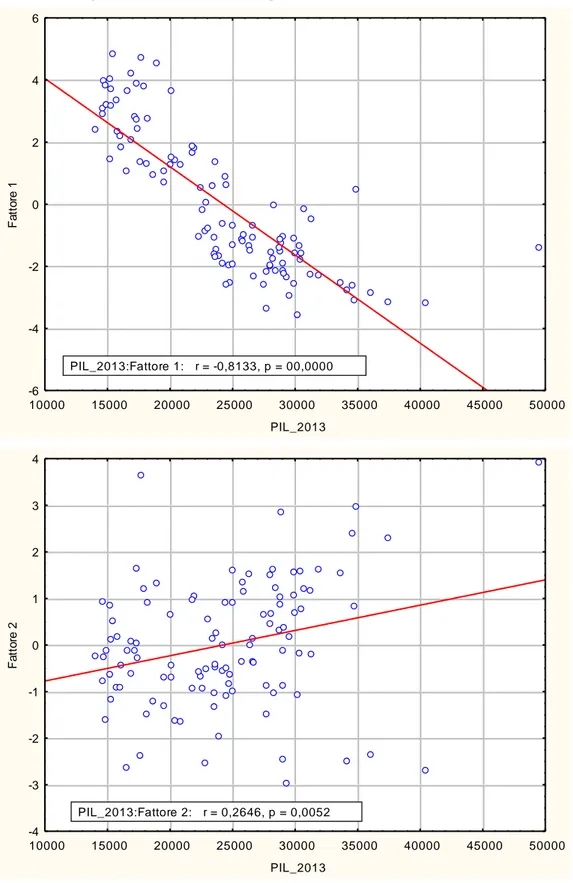
The Italian BES project is developed also to measure the phenomenon at level of provinces and, from this point of view, the analysis presented in this paper is more interesting respect to the regions since the number of units is greater.
The aim of this case study is to: compute well-being composite indicators of the Italian provinces; analyse the correlations among the composite indicators of the domains; analyse the quota of GDP that does not explain the latent factor well-being, using multivariate model: in this way it is possible to quantify exactly the percentage of this discrepancy.
Figure 1.4.3 - First plane of PCA
Region Piemonte Valle d'Aosta Liguria Lombardia Bolzano Trento Veneto Friuli-V.G. E. Romagna Toscana Umbria Marche Lazio Abruzzo Molise Campania Puglia Basilicata Calabria Sicilia Sardegna -8 -6 -4 -2 0 2 4 6 8 Factor 1: 70,49% -2,5 -2,0 -1,5 -1,0 -0,5 0,0 0,5 1,0 1,5 2,0 F a c to r 2 : 1 0 ,2 8 %