1
Sapienza Università di Roma
Facoltà di Medicina e Psicologia
Dottorato di Ricerca in Oncologia - XXXII Ciclo
Curriculum: Oncologia digestiva
Coordinatore: Prof. Bruno Annibale
Tesi di Dottorato di Ricerca
Autoimmune atrophic gastritis:
risk of gastric cancer
Relatore:
Prof. Bruno Annibale
Dottorando:
Dr. Gianluca Esposito
2
C
ONTENTS Page Introduction 1 Epidemiology 1 Carcinogenesis 1 Autoimmune gastritis 3 Electronic chromoendoscopy 3Aim of the Project 5
Results 7
- Occurrence and predictors of metaplastic atrophic gastritis in a nation-wide consecutive endoscopic population
presenting with upper gastrointestinal symptoms 7 - Upper gastrointestinal symptoms in autoimmune gastritis:
A cross-sectional study 10
- Gastroesophageal reflux symptoms and microscopic esophagitis
in a cohort of consecutive patients affected by atrophic body gastritis 14 - Endoscopic grading of gastric intestinal metaplasia (EGGIM):
a multicenter validation study 18
- A single vial is enough in the absence of endoscopic suspected
intestinal metaplasia – less is more! 21
- Narrow band imaging characteristics of gastric polypoid lesions:
a single center prospective pilot study 23
- Cost of detecting gastric neoplasia by surveillance endoscopy in
atrophic gastritis in Italy: A low risk country 27
Conclusions 33
References 34
1
I
NTRODUCTIONEpidemiology
Gastric cancer is the third leading cause of cancer mortality worldwide and the fifth for incidence. In 2018, 1.033.701 new cases of gastric cancer were diagnosed and 782.665 people died for gastric cancer. Incidence rates are the highest in Eastern Asia and Eastern Europe, while the incidence rate is low in Northern Europe and Northern America with rates similar to Africa’s countries.
If no interventions occur regarding screening strategies, incidence and mortality for gastric cancer are going to increase in the next years. Incidence will increase 36.2% in 2030 and 69.7% in 2040 with a total number of new cases of 1.758.810. The same will happen for deaths that will increase 37.7% in 2030 and 74.1% in 2040 with a total number of 1.366.121 of deaths. So, even though early recognition and treatment is possible in 2019 most cases are still being diagnosed at a late stage and most patients with gastric cancer will die of it [1].
Carcinogenesis
Gastric cancer, following Lauren classification, could be divided in intestinal type and diffuse type depending on histological features: the intestinal type characterized by structures similar to intestinal glands, whereas the diffuse type does not present glandular structures [2]. The diffuse type normally has a poor prognosis, occurs at younger age and doesn’t have a clear pathway as the intestinal subtype. Regarding diagnosis and surveillance, diffuse type gastric cancer follow the same indication of intestinal type gastric cancer. Surgery
2
represents the only choice of treatment and because of his poor prognosis, most of the time, it’s not curative.
For the intestinal subtype of gastric cancer, the development of gastric cancer is a multistep process where the normal gastric mucosa is modified until it becomes carcinoma. This transformation is mostly due to the infection of Helicobacter Pylori, a gram-negative bacterium that is considered as a class I carcinogen. The transformation to gastric cancer depends on several factors: characteristics of H. Pylori, host factors, length of infection and environmental risk factors like smoke, alcohol, BMI and diet. The infection of H. Pylori brings the normal mucosa to a chronic gastritis stage that represents the first stage of a transformation that could bring to develop gastric carcinoma. Colonization of H. Pylori normally starts in the antrum and then diffuse to corpus and fundus, where the chronic inflammation brings to the loss of gastric glands creating a stage of atrophy. The consequences of atrophic gastritis are hypochlorhydria and hypergastrinemia. Normal glandular tissue could be replaced by connective tissue or glandular structures inappropriate for location bringing to the stage of intestinal metaplasia. Atrophic gastritis and intestinal metaplasia are considered precancerous conditions on which dysplasia and gastric cancer could be developed. This transformation from normal gastric mucosa to gastric cancer is known as Correa’s cascade [3].
3
Autoimmune gastritis
Autoimmune gastritis (AIG) is a chronic disease occurring in up to 8% of the general population.[4] This condition is characterized by loss of the oxyntic glands with consequent hypochlorhydria, lack of intrinsic factor production, and, in a later stage, pernicious anemia. Often, the positivity of autoantibodies against parietal cells and/or intrinsic factor, the co-presence of autoimmune diseases as thyroid autoimmune disease or type 1 diabetes are associated.[5–8] Histologically AIG is characterized by gastric body atrophy, defined as replacement of oxyntic glands by metaplastic pyloric or intestinal glands according to the updated Sydney System.[9] A frequent clinical presentation of AIG is pernicious anemia, a megaloblastic anemia arising from vitamin B12 malabsorption as a consequence of intrinsic factor deficiency,[10,11] or the iron deficiency anemia due to iron malabsorption as a consequence of reduced gastric acid secretion together with normal or low cobalamin levels[12] and some of these patients may over time develop overt pernicious anemia.[13] Less frequently, the suspicion of AIG arise from the presence of gastrointestinal (GI) symptoms. From the GI point of view, the clinical spectrum of AIG has been traditionally considered almost silent, even if the occurrence of symptoms in this population has been reported, but risk factors for GI symptoms associations in AIG have not be established.[14–16]
Electronic Chromoendoscopy
Cumulative evidence suggests that electronic chromoendoscopy with narrow band imaging (NBI) is highly accurate for the diagnosis of precancerous
4
conditions [17,18]. A study conducted in 2012 showed that NBI had accuracy rates higher than 85%– 90% for the diagnosis of IM and dysplasia [17] and a recent trial demonstrated that NBI is superior to white light endoscopy (WLE) in identifying patients with IM [19], showing that NBI is useful to diagnose IM. More recently, a new type of endoscopic classification has been proposed. The Endoscopic Grading of Gastric Intestinal Metaplasia (EGGIM) may be used to assess the risk of patients by the endoscopic assessment of IM in the antrum, in the incisura and in the corpus with the use of high resolution NBI scopes [20,21]. In a post-hoc analysis based on endoscopic images taken from 201 patients in a multicentre study the diagnostic accuracy of EGGIM compared to OLGIM for the identification of patients with extensive intestinal metaplasia was 98% but assessed solely by a single endoscopist [20].
5
A
IM OF THEP
ROJECTIn atrophic gastritis (AG) and AIG patients, need and cost-effectiveness of endoscopic follow-up for GC or T1GC surveillance is not established. European guidelines recommend a scheduled GC surveillance for patients with extensive atrophic gastritis (EAG) that seems to be associated to an increased risk of dysplasia or gastric cancer (GC).
Moreover electronic chromoendoscopy already used to detect preneoplastic lesions, needs further validation in AIG and EAG patients. A systematic description of the endoscopic appearances at electronic chromoendoscopy of gastric hyperplastic polyps, adenomas and type-1 gastric carcinoids (T1GC), which may all present as endoscopically visible polypoid lesions, is lacking.
The aims of this project are:
1. To investigate the occurrence of and risk factors for gastric neoplastic lesions in patients with AIG and EAG
2. To investigate the role of electronic chromoendoscopy at follow-up in EAG and AIG in optimizing gastric preneoplastic and neoplastic lesions detection: comparison of the diagnostic yield with the use of NBI scopes of target oriented biopsies versus the updated Sydney system protocol with traditional white light (WL) scopes
3. To investigate specific endoscopic features at electronic chromoendoscopy of visible gastric polypoid lesions using HR-NBI compared to traditional WL gastroscopy in newly diagnosed and followed-up EAG and AIG patients.
6
4. To assess the cost-effectiveness of surveillance strategies based on independent risk factors in a low risk area to maximize the exploitation of the endoscopic resources in a longitudinal cohort study performed on patients with AIG and EAG.
7
R
ESULTS1.1 Occurrence and predictors of metaplastic atrophic gastritis in a nation-wide consecutive endoscopic population presenting with upper gastrointestinal symptoms
This was a post-hoc cross-sectional study considering clinical and histological data from adult patients collected during a prospective, nation-wide, multicenter study [22,23]. From the consecutive patients who were referred for gastroscopy from general practitioners as routine clinical practice (n=1054), in the present study, those with upper gastrointestinal symptoms as an indication for gastroscopy [668 (64%) women, mean age: 57.8 ± 4.7 years] were considered: 309 (46%) patients presenting with dyspeptic symptoms, 145 (22%) with typical gastroesophageal reflux symptoms, and 214 (32%) with overlapping (dyspeptic and reflux symptoms) were included. Exclusion criteria were patients who underwent esophagogastroduodenoscopy (EGD) for anemia or other red flag symptoms such as bleeding or vomiting, and for gastric cancer screening without symptoms. All patients underwent conventional WLE with video endoscopes with standard biopsy sampling according to the updated Sydney System mapping [9]. Pathological assessment was performed according to routine practice in each local pathology unit; the pathologists were asked to evaluate the presence and the severity of gastric atrophy, intestinal metaplasia, and H. pylori infection [22,24]. Among the 668 patients with upper gastrointestinal symptoms included, metaplastic atrophic gastritis (MAG) was detected in 201 (30.1%) patients. Operative link for gastritis assessment stages 1, 2, 3, and 4 were found in 70.5, 22.9,
8
5.1, and 1.5% of patients, respectively. OLGIM stages 0, 1, and 2 were found in 69.9, 29.2, and 0.9%, whereas the more severe OLGIM stages 3 and 4 were not observed. The intragastric pattern of the 201 patients with MAG was antral restricted in 149 (74.2%) patients, whereas the corporal mucosa was involved in 52 (25.8%): in 30 (14.9%) patients, the MAG was corpus-restricted and in 22 (10.9%), it was extensive involving both the antral and the corporal mucosa. Respectively, reflux or dyspeptic symptoms were present in 51.7 and 81.6% patients with MAG, and this distribution was similar to that in patients without MAG (54.6 and 76.9%, P>0.05). Overlapping reflux and dyspeptic symptoms were present in similar proportions of patients with and without MAG (33.3 and 31.4%, P>0.05). Table 1 shows the frequency of the single reflux and dyspeptic symptoms with respect to the presence or absence and the intragastric pattern of MAG. Postprandial fullness was significantly more frequent in patients with MAG compared with those without (29.8 vs. 18.8%, P= 0.002), whereas the presence of other dyspeptic symptoms, such as epigastric pain (32.8 vs. 37.5%), epigastric burning (24.4 vs. 27.2%), or the less frequent early satiety (10.9 vs. 8.3%), occurred in a similar proportion (P>0.05) in patients with or without MAG. Overall reflux symptoms were present in more than half of patients with (51.7%) or without (54.6%) MAG, but single reflux symptoms (heartburn: 27.8 vs. 31%, regurgitation: 23.9 vs. 23.6%) were similarly distributed in both groups. With respect to the intragastric pattern of MAG, overall and single reflux symptoms were observed in similar proportions in patients with antrum-restricted and corpus-involving (corpus-restricted and extensive) MAG (Table 1). Overall, dyspeptic symptoms occurred more frequently
9
among patients with corpus-involving (96.1%, P<0.01) and corpus-restricted (96.7%, P< 0.05) compared with antral-restricted MAG (79.2%), whereas statistical significance was not reached for extensive MAG (P=0.08). In particular, postprandial fullness was significantly more frequent in patients with corpus-involving (44.2%) and even more in those with corpus-restricted (60%) compared with antral-restricted MAG (26.8%, P=0.001). The other dyspeptic symptoms (epigastric pain and burning, early satiety) occurred in a similar proportion in patients with the different intragastric patterns of MAG (Table 1). A significant linear trend between the intragastric pattern of MAG (antrum-restricted, extensive, and corpus-restricted) and the presence of postprandial fullness was observed (P= 0.0002, w2 trend: 14.13). As shown in Table 2, factors associated significantly with MAG were age older than 55 years (OR: 1.86, 95% CI: 1.26–2.73), active H. pylori infection (OR: 1.66, 95% CI: 1.15–2.39), postprandial fullness (OR: 1.62, 95% CI: 1.03–2.54), and current smoking (OR: 1.53, 95% CI: 1.02–2.31). Other covariates such as sex, BMI, family history for gastric cancer, NSAIDs or antisecretory drugs use, or other upper gastrointestinal symptoms were not associated. Factors associated significantly with corpus involving and corpus-restricted MAG were, again, the presence of postprandial fullness (OR: 2.81, 95% CI: 1.17–6.74 and OR: 4.16, 95% CI: 1.79–9.63), together with the chronic use of NSAIDs (OR: 2.50, 95% CI: 1.27–4.91 and OR: 2.98, 95% CI: 1.01–8.88). The patterns of extensive and antrum-restricted MAG were not associated with specific symptoms, but with age older than 55 years (OR: 3.6, 95% CI: 1.20–12.67 and OR: 1.63, 95% CI: 1.06–2.49). The other two factors associated with antrum-restricted MAG were current smoking
10
(OR: 1.67, 95% CI: 1.07–2.59) and not using NSAIDs (OR: 5.34, 95% CI: 1.6–17.9). To conclude, this study showed that MAG may be found in about one of three patients undergoing endoscopy for upper gastrointestinal symptoms. Clinical predictors are age older than 55 years, current smoking, active H. pylori infection, and postprandial fullness, especially for corpus-involving and corpus-restricted MAG. An accurate, pre-endoscopic clinical characterization of symptomatic patients with easily achievable information may be useful to better address endoscopy.
1.2 Upper gastrointestinal symptoms in autoimmune gastritis: A cross-sectional study
A cohort of 379 consecutive AG patients was analyzed. Gastroscopy was performed in 78.9% (299/379) of cases for pernicious or iron deficiency anemia, in 8.4% (32/379) for GI symptoms, in 2.9% (11/379) for neurologic or endocrine disorders, in 2.9% (11/379) for increased levels of gastrin, and 6.9% (26/379) for other causes. The presence and the frequency of GI symptoms (heartburn, regurgitation, early satiety, nausea, vomiting, postprandial fullness, epigastric pain, abdominal pain, constipation, diarrhea, and bloating) were assessed at the time of the first visit through a standardized interview. Upper GI symptoms were analyzed either separately or altogether to classify patients in defined syndromes which may overlap. Gastro-esophageal reflux disease (GERD) was defined by the presence of typical reflux symptoms such as troublesome heartburn and/or regurgitation at least once-2 times a week.[25] Dyspepsia was defined by Criteria
11
of Rome III for functional disorders, by the presence of symptoms thought to originate in the gastroduodenal region, with symptoms onset at least 6 months before.[26] This was further subdivided in the postprandial distress syndrome (PDS) in the presence of bothersome post-prandial fullness and/or early satiation at least several times per week and epigastric pain syndrome (EPS) in the presence of pain or burning localized in the epigastrium and not associated with other abdominal or chest related symptoms, at least once per week for the last 3 months. Since the study dealt with patients affected by AG, PDS and EPS dyspepsia will be indicated as PDS- and EPS-like throughout this article. In the presence of lower GI symptoms, patients were categorized as having the irritable bowel syndrome (IBS), further subdivided into diarrhea-predominant IBS (IBS-D), constipation-predominant IBS (IBS-C), or mixed stool pattern IBS (IBS-M), functional constipation, functional diarrhea, and functional bloating following Rome III Criteria.[27] AG has been defined on the basis of the concomitant presence of fasting hypergastrinaemia, low pepsinogen I level, histological confirmation of body atrophy, positivity to antiparietal cells, and/or intrinsic factor antibodies and/or compresence of other autoimmune diseases as previously reported.[28] The anemia pattern was assessed by evaluating hemoglobin, mean corpuscular volume (MCV), ferritin, and vitamin B12 values. Pernicious anemia was defined as the low hemoglobin concentration, MCV>100 fl together with low B12 vitamin levels, responding to intramuscular B12 vitamin treatment. Iron deficiency anemia was defined as the low hemoglobin concentration, MCV< 80 fl, and ferritin<30ng/mL.[29,30]
12
Of the 379 patients included, 70.2% (n=266) were female, with a median age of 55 years (17–83 years). Smoking habit was present in 19% (n=72) of patients. Clinical features associated to AG were: pernicious anemia (53.6%), iron deficiency anemia (34.8%), presence of gastric autoantibodies (anti-parietal cell and/or anti-intrinsic factor) (67.3%), autoimmune disorders (41.7%), and H pylori infection (26.1%). Concerning autoimmune disorders, 89% of AG patients had thyroid disorders and 11% had 1 or 2 associated extra-thyroid diseases (i.e., vitiligo, alopecia, diabetes, rheumatoid arthritis, hemolytic anemia, Sjögren’s syndrome, psoriasis, autoimmune hepatitis, and myasthenia). None of the patients had GI cancer at the time of AG diagnosis. Polypharmacy (use of more than 2 drugs) was present in 5.5% (n=21) of patients for common conditions such as cardiovascular diseases, dyslipidemia, diabetes, and osteoporosis. Prokinetics were taken by 6.6% (n=25) of patients. One or more GI symptoms were present in 56.7% (n=215) of AG patients.
Table 3 shows the clinical features of AG patients with respect to the presence or
the absence of GI symptoms. Females were significantly prevalent, about 10% more, among the patients with GI symptoms compared to those without.
Symptomatic patients were significantly younger, about 5 years, and more often no smokers, about a third less, in comparison to the asymptomatic ones. Pernicious anemia was significantly more frequent, about a third more, in the asymptomatic group in comparison to the symptomatic group. No differences were found between symptomatic and asymptomatic patients concerning the presence of iron deficiency anemia, positivity to gastric autoantibodies, prevalence of H pylori infection, and the concomitant presence of autoimmune disorders. The
13
Sydney score of corporal atrophy was evaluated in patients with and without GI symptoms.
Among symptomatic patients, the large part had exclusively upper GI symptoms (n=150) and a smaller part complained respectively only lower GI symptoms (n=34) or concomitant upper and lower GI symptoms (n=31). Analyzing all patients with upper GI symptoms (n=181), 60.2% (n=109) reported PDS-like dyspepsia, 3.8% (n=7) EPSlike dyspepsia, 7.2% (n=13) overlap PDS and EPS-like dyspepsia, 7.2% (n=13) GERD, 17.7% (n=32) GERD and dyspepsia, and 3.8% (n=7) nausea and/or vomiting. Among all patients with lower GI symptoms (n=65), 27.7% (n=18) reported the functional abdominal pain syndrome, 3.1% (n=2) IBS-C, 3.1% (n=2) IBS-D, 16.9% (n=11) IBS-M, 21.5% (n=14) functional constipation, 12.3% (n=8) functional diarrhea, and 15.4% (n=10) functional bloating.
Logistic regression analysis showed that the younger age (<55 years), the absence of smoking habit, and the absence of anemia were independent factors associated to the presence upper GI symptoms in AG patients. The positive association between the absence of anemia and the presence of GI symptoms was confirmed when the absence of pernicious anemia (OR 2.4 [95%CI: 1.2–5.2]) and iron deficiency anemia (OR 3.1 [95%CI: 1.4–6.8]) was separately considered. When the presence of PDS-like dyspepsia in AG patients was considered as the dependent variable, the positive association with the same independent variables was shown. In conclusion, more than half of AG patients complained of GI symptoms, in particular, dyspepsia, alone in 70% or associated to GERD in 17.7% of symptomatic patients, confirming the significant occurrence of symptoms in this
14
population. In autoimmune gastritis patients, the demonstrated association between early satiety and postprandial fullness with younger age, no smoker and not anemic status should be kept in mind in the work-up of these patients.
1.3 Gastroesophageal reflux symptoms and microscopic esophagitis in a cohort of consecutive patients affected by atrophic body gastritis
During a 12 months period, 54 consecutive patients undergoing regular follow-up for AG in our tertiary referral centre were included. Each patient underwent a complete assessment of upper gastrointestinal symptoms, particularly GER-related symptoms, and EGD for the follow-up of AG, with multiple oesophageal and gastric biopsies. Presence of upper gastrointestinal symptoms was assessed at the time of the outpatient visit through a standardized interview, evaluating type and frequency of GER typical (heartburn and regurgitation) and atypical symptoms (cough, no cardiac chest pain, pharyngeal globe and dysphagia) [31]. Gastroesophageal reflux disease (GERD) was defined as the presence of typical and/or atypical reflux symptoms at least one-two times a week in the last 6 months [25]. Presence of dyspepsia, defined by the presence of symptoms thought to originate in the gastro-duodenal region, with symptoms onset at least 6 months before, was also assessed. This was subdivided in subtype postprandial distress syndrome (PDS), in presence of bothersome postprandial fullness and/or early satiety at least several times per week, or epigastric pain syndrome (EPS), in presence of epigastric pain and/or burning at least once a week [26]. EGD with multiple oesophageal (at least 4, two biopsies at 2 cm and two biopsies on the
15
oesophageal side of the Z line) [32] and gastric biopsies (two biopsies were taken from the antrum, anterior and posterior wall, one from the angulus and two from the gastric body, anterior and posterior wall, according to update Sydney System mapping) [9] was performed. Histologic evaluation and definition of microscopic esophagitis Regarding oesophageal samples, recognition and assessment of microscopic lesions related to GERD were performed assessing: (i) basal cell layer hyperplasia; (ii) papillary elongation; (iii) dilatation of intercellular spaces (DIS); (iv) intraepithelial eosinophils; (v) neutrophils and (vi) mononuclear cells [33,34]. Each microscopic lesion was scored (from 0 to 2) on the basis of its severity. A combined severity score was obtained for each patient by summing up lesion scores and dividing by the number of lesion types assessed. As suggested in the Esohisto project, the calculation was restricted to four lesions (basal cell layer hyperplasia, papillary elongation, DIS and the presence of intraepithelial eosinophils) as these are the most informative elementary lesions. Scores 0–0.25 were considered as normal; 0.5–0.75 as ‘mild esophagitis’ and _1 as ‘severe esophagitis’ [35].
Of the 54 patients included, 20.4% (n=11) were male with a mean age of 57.6 ± 14 years. The mean BMI was 24.9 ± 4.1 kg/m2 with 37.5% of patients being overweight. Patients of about 14.6% were active cigarette smokers. Patients received a diagnosis of ABG, at least one year before the inclusion in the current study, with a mean age from ABG diagnosis of 7.4 ± 6.6 years. At diagnosis, fasting gastrinaemia level was 651.2 ± 473.8 pg/ml and pepsinogen I was 13.9 ± 12.6 ng/l. Clinical features associated to ABG were: iron deficiency anaemia
16
(56.6%), pernicious anaemia (30.2%), H. pylori infection (7.4%), the presence of gastric autoantibodies against parietal cells (81.5%), and autoimmune disorders (41.7%). First-degree family history for gastric cancer was reported in 11.1% of patients. The occurrence of GER symptoms and associated characteristics. One or more upper GI symptoms were reported in 70.4% of patients. At least one typical GER symptoms were reported in 24.1% (n=13) with 9.2% of patients complaining of heartburn and 18.5% regurgitation. One or more atypical GERD symptoms were reported in 44.4% (n=24) of patients, with 29.6% complaining of cough, 22.2% non-cardiac chest pain, 20.4% pharyngeal globe and 14.8% dysphagia. Only typical or atypical GER-related symptoms were reported in 24.1% (n=13) and 27.5% (n=15) of patients respectively; both typical and atypical GER-related symptoms were present in 16.7% (n=9) of patients. Concomitantly, PDS-like dyspepsia was reported in 40.7% (n=22) and EPS-like dyspepsia in 16.7% (n=9). Pernicious anaemia was less frequent in patients with typical GERD symptoms (7.7%) compared to patients without GERD (41.6%) (barely missed p=.05). Even if all patients showed low pepsinogen I levels, patients without GERD presented higher pepsinogen I levels compared to patients with typical GERD (8.9 ± 7.3 vs. 20.6 ± 14.8 mg/l, p=.04). No other differences regarding gender, age, BMI and other clinical characteristics were present.
Two (3.7%) out of 54 patients presented oesophageal lesions at endoscopy. One symptomatic male patient, aged 67 years, complaining of typical -heartburn and regurgitation- and atypical GERD symptoms – chest pain- presented at endoscopy
17
an erosive esophagitis (LA-C according to Los Angeles classification) with a concomitant hiatal hernia. This patient presented concomitantly EPS-like dyspepsia. Another female patient, aged 80 years, complaining of heartburn and PDS-like dyspepsia, presented a short tongue of columnar lined mucosa at distal oesophagus with an area of intestinal metaplasia configuring a diagnosis of Barrett’s oesophagus (C2M2, according to Prague classification). The first patient was overweight (BMI 27.7 Kg/m2) and the second one was obese (BMI 32.3 Kg/m2). The remaining patients showed no relevant oesophageal or gastric endoscopic findings. A mild microscopic esophagitis (ME) was reported in 49% and a severe ME in 24.5% of ABG patients. Comparing patients with or without ME, dyspeptic symptoms were less frequent in ABG patients with ME compared to those without (p=.05, barely missed). No other differences regarding gender, age, BMI and other clinical characteristics were present. No significant differences regarding GERD prevalence were found among patients with or without ME. The prevalence of the single symptom in patients with or without ME is shown in
Table 4. Cough was the only symptom significantly more frequent in patients
with GER-related esophagitis. The occurrence of others GER-related symptoms was similar between the two groups.
Finally, these preliminary data showed that GERD is not infrequent in ABG being symptoms present in a quarter of patients, suggesting that ABG not exclude per se arising of oesophageal complaints. In ABG we found that microscopic esophagitis is a common finding but its clinical relevance remains to be investigated with further studies.
18
2.1 Endoscopic grading of gastric intestinal metaplasia (EGGIM): a multicenter validation study
A prospective study involving two endoscopic academic centers (Italy and Portugal) was conducted. Consecutive outpatients undergoing gastroscopy with high-resolution (HR)-NBI gastroscopes because of upper gastrointestinal symptoms were included. Exclusion criteria were: known OLGIM; contraindication for biopsies; significant comorbidities (severe heart, pulmonary or renal failure); previous gastric neoplasia or surgery; intolerance for the endoscopic procedure. In the 250 included patients, 1.6% had ulcerative lesions (0.8% early gastric cancer, 0.8% peptic ulcers) and 2.8% had elevated lesions (2% hyperplastic polyps, 0.8% adenomas). In each center, fully trained endoscopists with NBI experience (more than 100 HR-NBI per year) performed the endoscopy. The interobserver agreement between endoscopists was assessed using the proportion of agreement for the first 20 procedures (0.93).
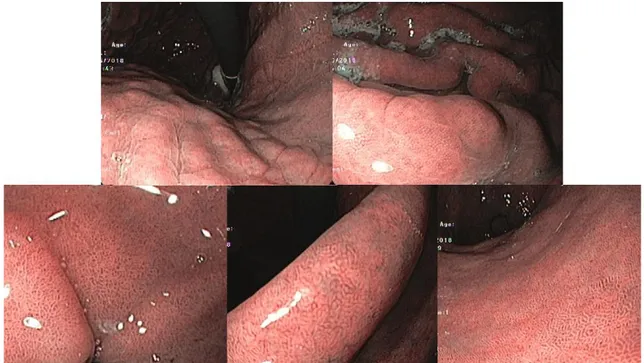
Firstly, detailed observation of the gastric mucosa with HR-WLE was made. Next, HR-NBI observation of the entire gastric mucosa was performed with an accurate evaluation of the antrum, incisura and corpus mucosa. Five different areas were considered: lesser and greater curvature in the antrum, lesser and greater curvature in the corpus and incisura. In each area 0 (no GIM), 1 (focal GIM, less or equal than 30% of the area) or 2 points (EIM in that area, more than 30% of the area) were attributed for a total of 10 points [20]. Figure 1 shows endoscopic pictures regarding EGGIM classification for antrum, incisura and corpus mucosa.
19
Biopsies were targeted to areas suspicious of intestinal metaplasia endoscopically recognizable [17]; if GIM was not suspected, random biopsies were taken using the updated Sydney System protocol [9] and were sent for histopathologic evaluation in separate jars, from antral and corpus mucosa.
Of the 250 included patients, 62% were female and the median age was 55 (interquantile range 45-68 years). GIM was present in 114 patients (45.6%) and it was identified by targeted biopsies in 97.4%. Three patients had GIM diagnosed only by random biopsies. At pathological evaluation, 136 (54.4%) patients were staged OLGIM 0, 15 (6.0%) OLGIM I, 52 (20.8%) OLGIM II, 34 (13.6%) OLGIM III, and 13 (5.2%) OLGIM IV. The prevalence of GIM was similar in both centres (43.4% Italian patients vs 47.6% Portuguese patients) but OLGIM III/IV was more prevalent in Portuguese population (27.6% vs 9.2%, p<0.001).
Amongst the 250 included patients, EGGIM scores were as follows: 128 (51.2%) patients had EGGIM 0, 16 (6.4%) patients had EGGIM 2, 7 (2.8%) EGGIM 3, 46 (18.4%) EGGIM 4; 9 (3.6%) EGGIM 5, 18 (7.2%) EGGIM 6, 11 (4.4%) EGGIM 7, 9 (3.6%) EGGIM 8, 2 (0.8%) EGGIM 9 and 4 (1.6%) EGGIM 10.
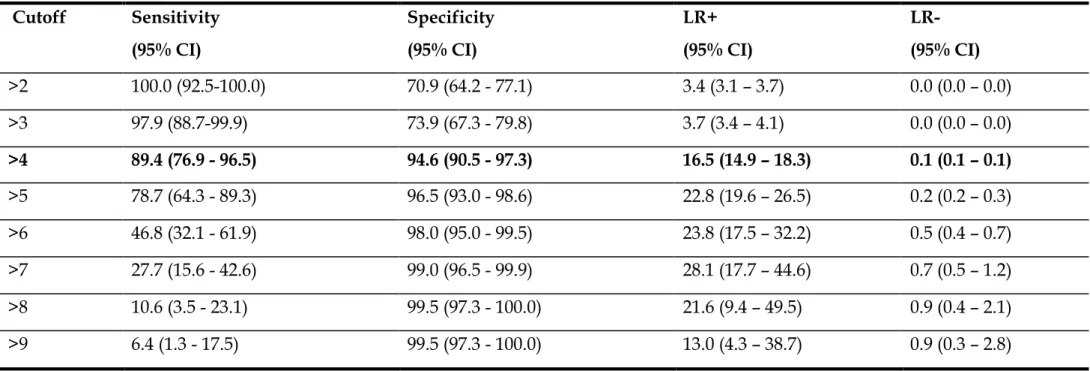
For the presence of OLGIM III-IV, the area under the ROC curve of EGGIM classification was 0.96 (95% CI 0.93 – 0.99). As shown in Table 5, different cutoffs could be used with high sensitivity and specificity. If a cutoff > 4 (i.e., 5 to 10) is used the best balance is noticeable - sensitivity, specificity, PPV, NPV and LR+ would be 89.4% (95% CI 76.9 - 96.5), 94.6% (95% CI 90.5 - 97.3), 79.2% (95% CI 73.6 - 84.0), 97.5% (95% CI 94.4 - 98.9) and 16.5 (95% CI 14.9 - 18.3), respectively.
20
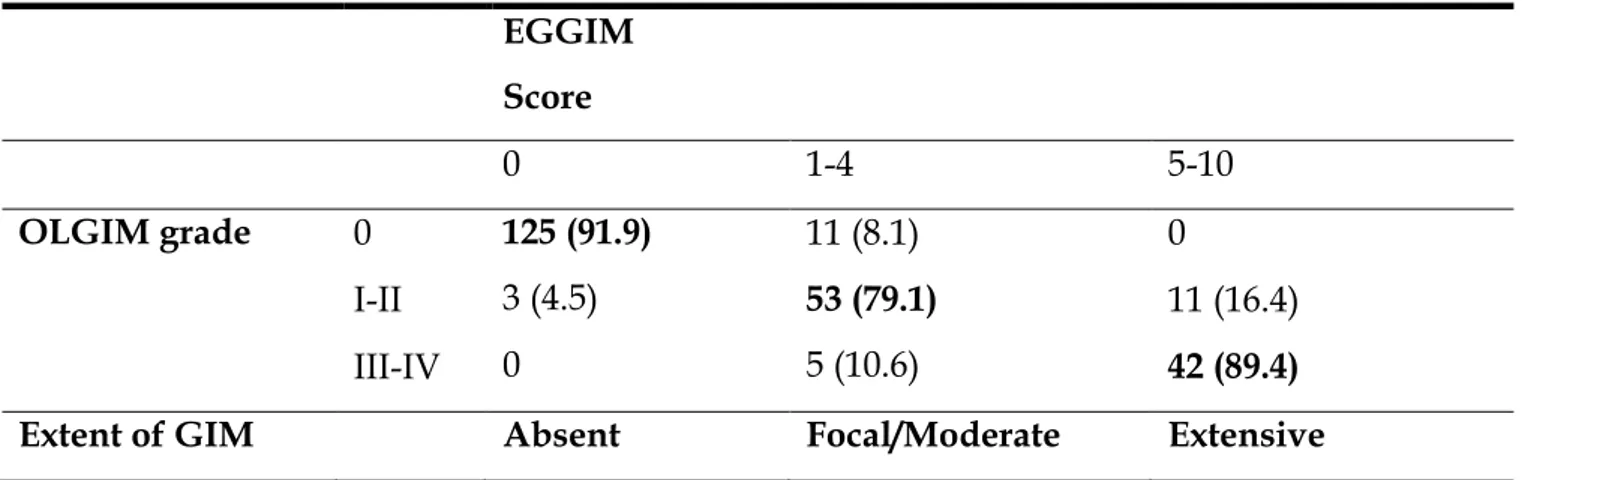
As shown in Table 6, 125 out of 128 patients scored as having EGGIM 0 were confirmed as having no GIM by OLGIM 0, whereas in 3 patients EGGIM misrecognized the presence of GIM (1 patient was OLGIM I and 2 patients were OLGIM II). Out of the 69 patients categorized as having focal/moderate GIM by EGGIM scores 1-4, 53 were confirmed as having focal/moderate GIM by OLGIM (stages I and II in 14 and 39 patients, respectively), while in 5 patients GIM was classified as extensive by OLGIM (stage III) and in 11 patients the presence of GIM was not confirmed at all by histopathology (OLGIM 0).
Hp infection was present in 52 patients (20.8%). Forty-four (84.6%) of these Hp
positive patients were correctly staged with EGGIM score compared to OLGIM. In the remaining 8 (15.4%) patients in which EGGIM score was discordant from the OLGIM score with an overestimation of the EGGIM score in 7 - five OLGIM 0 were wrongly staged as focal/moderate and two OLGIM I/II were staged as endoscopically extensive. If we exclude patients with Hp infection, sensitivity, specificity and LR+ for EIM would not significantly decrease to 87.2 (95% CI 81.2 - 91.7), 94.3 (95% CI 89.8 - 97.1) and 15.4 (95% CI 13.6 - 17.5) respectively.
Foveolar hyperplasia was present in 26 patients (10.4%). Seventeen (65.4%) of these patients were correctly staged with EGGIM classification. In the remaining 9 (34.6%) patients there was an overestimation of the EGGIM score in six of these (four OLGIM 0, were wrongly staged as focal/moderate and two OLGIM I/II were staged as extensive). Excluding patients with foveolar hyperplasia, sensitivity, specificity and LR+ for EIM increased (not significantly) to 91.3 (95% CI 86.5 - 94.7), 94.9 (95% CI 90.9 - 97.4) and 18.1 (95% CI 16.4 - 19.9), respectively.
21
In conclusion, this is the first prospective assessment of EGGIM classification and it showed a high diagnostic performance compared to OLGIM. This approach could be used to simplify the surveillance of these patients by avoiding biopsies. A possible confounding factor leading to overestimation of presence of intestinal metaplasia might be the presence of foveolar hyperplasia that should be taken into account before final staging is communicated to the patient. This endoscopic diagnostic tool could become a promising instrument for surveillance for gastric cancer.
2.2 A single vial is enough in the absence of endoscopic suspected intestinal metaplasia – less is more!
Multicentre prospective study involving two tertiary gastroenterology centres from Portugal and Italy: Portuguese Oncology Institute of Porto (Portugal) and Sant’Andrea Hospital (Italy). Consecutive patients undergoing their first upper gastrointestinal (GI) endoscopy with an indication for gastric biopsies were included. The exclusion criteria were; significant comorbidities; anticoagulant therapy or coagulation disorders; previous gastric neoplasia or surgery; poor tolerance, defined as not being able to perform at least four biopsies during the endoscopy; gastric lesions and/or suggestive areas of GIM with NBI.
During endoscopy, the gastric mucosa was first observed with conventional white light and then with NBI. If there was no suspicious of GIM based on the endoscopic pattern (Figure 2), four biopsies were performed (two from the antrum
22
and two from the body) and placed in the same vial for histological assessment and H. Pylori detection.
One hundred and eighty-three patients were included in this study. The mean age of the included patients was 48 years old with a predominance of female gender (63%). The most frequent indication for upper gastrointestinal endoscopy in these patients was dyspepsia (79%) and 31% were infected with H. pylori at the time of the procedure. In all 183 patients, it was possible to distinguish samples of the antrum from those of gastric body which allowed OLGA and OLGIM calculation. One hundred and seventy-nine patients (97.8%) were classified as OLGIM 0 and only four (2.2%) were classified as OLGIM I. Regarding AG, one hundred and fifty patients were classified as OLGA 0 (81.9%), twenty three as OLGA I (12.6%) and ten as OLGA II (5.5%). Taking into account the histological staging, none of these patients included in this study had an indication for endoscopic surveillance. Thus, in this study, a normal mucosal and vascular pattern during upper gastrointestinal endoscopy with NBI had a sensitivity of 100% (95% CI: 97.4–100) for the absence of extensive AG/IM or a negative predictive value of 100% for severe/extensive GIM and/or AG. The prevalence of non-extensive or focal AG was higher in patients infected with H. Pylori. In fact, focal AG was present in 18 out of 56 patients with H. Pylori infection but only in 15 out of 127 of those who were not infected (32.1% vs. 12.1%; p=.002). Additionally, in patients with focal AG, there was a predominance of OLGA II staging in patients infected with H. Pylori compared to the non-infected, however without statistical significance (38.9% vs. 20%; p=.240). The prevalence of focal AG was also higher in older patients (50
23
years old), however, this difference was also not significant (23.5% vs. 13.9%; p=.210). As expected, in both scenarios (older vs. younger, infected vs. non-infected) the sensitivity and negative PV were also 100%.
In conclusion, to our knowledge, this is the first study to show that when HR-endoscopy with NBI does not show suspicious areas of GIM, antrum and body biopsies can be sent in the same vial (when H. Pylori status is necessary) or do without biopsies when the purpose is only to detect patients with premalignant conditions deserving surveillance. Future guidelines should take into account these results that can have a significant impact on endoscopic associated cost and departments’ workload. Moreover, if our results are confirmed in studies with less experienced endoscopists, recommendations can be revised in the near future.
3.1 Narrow band imaging characteristics of gastric polypoid lesions: a single center prospective pilot study
A prospective study involving an endoscopic academic center has conducted. Consecutive adult patients (≥ 18 years) undergoing gastroscopy for any reason with high-resolution (HR)-NBI gastroscopes in dedicated gastroscopy sessions performed by NBI experienced endoscopists, presenting at least one gastric polypoid lesion (GPL), were included. The identified GPL were endoscopically removed and sent for histological analysis. For the purpose of this study, we considered all GPL which at histology were identified as hyperplastic polyps (HP), adenomas, or type-1 gastric carcinoid (T1-GC); GPL which histologically were identified as normal mucosa, or atrophic gastritis with or without intestinal
24
metaplasia, or fundic gland polyps (FGP), were not included. Exclusion criteria were: contraindication for polypectomy; significant comorbidities (severe heart, pulmonary or renal failure); intolerance to the endoscopic procedure.
Fully trained endoscopists with NBI experience (more than 100 HR-NBI per year) performed the gastroscopy. During gastroscopies if a GPL was found, images of NBI appearances were taken and stored on a pen drive support in high definition format. All GPL were identified, and number, location, size and endoscopic characteristics were recorded. All GPL were removed for histological examinations. At the end of the study, both endoscopists independently reviewed digital images in a blinded manner and registered the endoscopic NBI appearances on a specific check-list ad-hoc adapted from a previous study conducted on T1-GC polyps [36]. Five variables were taken into consideration: the mucosal and vascular pattern, vascular thickness and density as well as the presence of light-blue crest. Endoscopists could further indicate other notable NBI features (i.e. erosions, presence of demarcation line, other). After the first blinded evaluation, the agreement between endoscopists was 0.92. The disagreement (4 polyps) was resolved by discussion. GPL were then categorized in three different groups (HP, adenomas and T1-GC) using the histopathological evaluation as gold standard.
Forty patients were enrolled. Females were the 55% and the median age was 63 (range 36-85) years. Overall, 52 GPL were included: 29 (55.8%) HP; 18 (34.6%) T1-GC; 5 (9.6%) adenomas. The median size of GPL was 7 (range 2-35) mm.
25
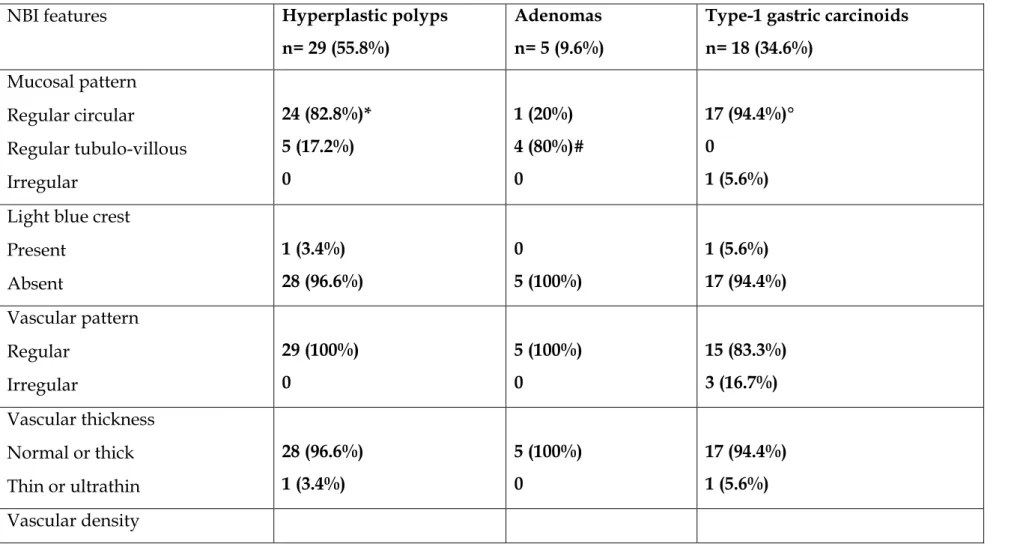
Table 7 shows the NBI features of GPL. Forty-two (80.8%) presented regular
circular mucosal pattern, 9 (17.3%) had tubule-villous and 1 (1.9%) irregular mucosal pattern. Only 2 GPL (3.8%) presented light blue crests. The vascular pattern was regular in 49 (94.2%) GPL, normal or thick in 50 (96.1%), with high vascular density in 49 (94.2%). In 15 (28.8%) GPL other features were recorded: nine (17.3%) presented a central erosion and 4 (7.7%) a demarcation line with a central erosion.
Twenty-nine (55.8%) HP were found: 24 (82.8%) had regular circular mucosal pattern, while regular tubule-villous pattern was observed in 5 (17.2%). Only one (3.4%) presented light blue crest, while vascular pattern, thickness and density were normal for all HP but one (3.4%) which presented thin vessels. No other NBI features were observed.
Eighteen (34.6%) T1-GC were found. Seventeen (94.4%) presented regular circular mucosal pattern and only one (5.6%) presented irregular mucosal pattern. Light blue crest was observed only in one T1-GC (5.6%), while regular vascular pattern was observed in 15 (83.3%) and normal vascular thickness in 17 (94.4%). Vascular density was regular in 15 (83.3%), low in two (11.1%) and variable in one (5.6%). Furthermore, both endoscopists observed the presence of a central erosion in 14 (77.8%) and a clear demarcation line in the central part in 6 (33.3%) T1-GC.
Five (9.6%) adenomas were found. Four (80.0%) had a tubule-villous mucosal pattern, while only one (20.0%) had regular circular mucosal pattern. Light blue-crests were absent in all of them. All the adenomas had regular vascular pattern,
26
normal vascular thickness and normal vascular density. No further NBI features were observed.
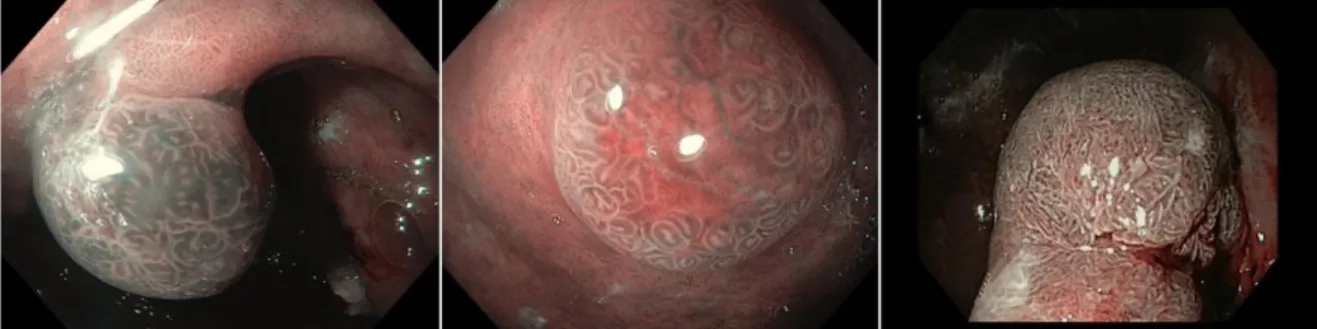
Figure 3 shows examples of NBI appearance of a HP, a T1-GC, and an adenoma.
As shown in Table 7, 80% of adenomas presented tubule-villous mucosal pattern (p=0.01 versus other lesions). This specific characteristic showed a sensitivity of 80.0% (95% CI 66.2 – 99.3), a specificity of 89.4% (95% CI 77.0 – 95.8), a PPV of 44.4% (95% CI 30.9 – 58.8) and a NPV of 97.7% (95% CI 87.8 – 99.8). The presence of a regular circular mucosal pattern was more frequently observed in HP and T1-GC compared to adenomas (p<0.001). The presence of a central erosion with or without demarcation line was more frequently observed in T1-GC (p<0.001 vs HP) and showed a sensitivity, specificity, PPV and NPV of 77.8% (95% CI 63.8 – 87.7), 97.1% (95% CI 86.9 – 99.6), 93.3% (95% CI 81.9 – 98.1) and 89.2% (95% CI 76.7 – 95.7), respectively.
In conclusion, in the present pilot study the NBI analysis of the mucosal pattern seems to be effective to endoscopically discriminate between adenomas and HP, while the main characteristic of T1-GC seems to be the presence of a central erosion, sometimes with a clear demarcation line. The endoscopic NBI characterization of GPL may contribute to optimize the management of these lesions.
27
4.1 Cost of detecting gastric neoplasia by surveillance endoscopy in atrophic gastritis in Italy: A low risk country
This is a post-hoc analysis of a recent study on the endoscopic surveillance of AG patients from Italy [37]. A total of 200 patients (67% female, median age 55 years, range 22–84 years) with AG with a median follow-up of 7.5 years (range 4–23.4 years) were included. These patients had at least one follow-up investigation by gastroscopy with biopsies at an interval of at least 4 years after first diagnosis of AG for surveillance purposes. The occurrence of gastric neoplastic lesions in these patients was adopted for the purpose of the present analysis. The following independent risk factors for the development of gastric neoplastic lesions in AG patients have been reported: age over 50 years, extensive atrophy, severe intestinal metaplasia in the gastric body, pernicious anaemia, OLGA and OLGIM [38,37,39]. The cost of the 4-years endoscopic surveillance strategy was computed on the basis of the above mentioned risk factors and their combinations in both, the unselected population and the selected populations. Because of the well-known high risk of gastric cancer in patients with non-invasive neoplasias, we considered them as a valid surrogate to assess the costs of endoscopic surveillance. Type-1 gastric carcinoids were also included amongst gastric neoplastic lesions, because, notwithstanding their generally benign behavior[40], a prompt diagnosis is considered worthwhile as these tumours require medical, endoscopic or surgical treatment and may give arise to synchronous or metachronous gastric cancers [41]. For each surveillance strategy, the following calculations were performed:– the number of endoscopies needed to be performed (NNS) to detect one case of gastric
28
neoplastic lesion by dividing the number of 4-years surveillance endoscopies by the number of detected neoplastic lesions;– the cost for detecting one case of gastric neoplastic lesion, by multiplying the NNS, computed for each strategy, for the cost of one endoscopy;– the incremental cost needed to detect one additional gastric neoplastic lesion, as compared to the more expensive strategy, in order to define the incremental costs of different strategies, expressed as the difference between the overall cost of the 1ststrategy and the overall cost of the 2nd strategy divided by the difference of gastric neoplastic lesions detected in the 1st and 2nd strategy. The cost of gastroscopy in Italy was adopted from a previous estimate of the Italian Society of Digestive Endoscopy (SIED). According to such estimate, it was equal to D 155.3.
The selected cohort of 200 AG patients (median age: 55; range:22–84; male/female: 1:1.5) underwent 361 surveillance gastroscopies in a median follow-up period of 7.5 (4–23.4) years. Overall, 19 incident gastric neoplastic lesions were detected at surveillance examinations, corresponding to a cumulative incidence rate of 9.5%. Of these lesions, four were gastric cancers, eight were type 1 gastric carcinoids, and seven were dysplastic lesions (one high-grade and six low-grade). In regard to histology of the four gastric cancers, two were distal intestinal type adenocarcinomas (G1N0M0), one a distal undifferentiated gastric cancer (G3N1M0), and one was a proximal diffuse type gastric cancer (G1N0M0); in regard to outcome, two patients underwent gastric surgery and are alive; in the other two patients the outcome was fatal as in one patient neither surgery nor other treatments were feasible due to comorbidities and the other patient
29
experienced a fatal progression of disease not withstanding gastric surgery and subsequent medical therapy. The one patient with distal high-grade dysplasia underwent partial gastrectomy and is alive. With regard to type 1 gastric carcinoids, eight presented as gastric polyps and were removed by polypectomy, the other two were intramucosal detected by random biopsies. Of low-grade dysplastic lesions, three presented as polyps and were endoscopically removed. In regard to outcome, after endoscopic removal of polyps and monitoring with random biopsies at the longest follow up of 11.8 years (range 4.1–19.5 years), neither a new low-grade or high-grade dysplasia recurred nor a type I gastric carcinoid occurred in any of these cases. Regarding the distribution of the selected risk factors, 124 (62%) AG patients were aged over 50 years, 105 (52%) had pernicious anaemia, 40 (20%) had extensive atrophy, 26 (13%) had OLGA 3–4 stages, and 12 (6%) had OLGIM 3–4 stages. The overall cost of the unselected cohort of 200 patients was purely related with the 361 surveillance gastroscopies performed, corresponding to D 55,955 for the entire cohort. During these surveillance gastroscopies, 19 gastric neoplastic lesions were detected, corresponding to a NNS of 19 and to a cost per gastric neoplastic lesion detected of $2945. The stratification of the initial cohort by the identified risk factors was associated with a progressive reduction of the number of gastroscopies performed and the overall cost, and with a decrease of efficacy, defined as the relative number of gastric neoplastic lesions detected in each selected subgroup. When restricting the surveillance to only patients with pernicious anemia (n = 105, 52%), the number of surveillance gastroscopies decreased from 361 to 193, the overall
30
cost decreased to D 29,915, corresponding to a NNS of 13.8 and a cost per gastric neoplastic lesion detected of D 2139, still detecting 74% (n = 14) of the overall 19 gastric neoplastic lesions. When limiting the endoscopic surveillance to those AG patients with extensive atrophy, only 40 (20%) AG patients would need to be followed up, with a decrease of the cumulative number of gastroscopies to126 and of the total cost to D 19,530. This was offset by the failure to detect ten cases of gastric neoplastic lesions, corresponding to a 47% detection rate of GNL. The NNS in this strategy was 14, corresponding to a cost per GNL of D 2170. When combining together more risk factors (pernicious anemia and OLGA stages 3–4, pernicious anemia and OLGIM 3–4) a further improvement in the overall cost and cost per gastric neoplastic lesion detected would occur, however reducing the absolute number of gastric neoplastic lesions detected. When considering the more cost saving strategies (pernicious anaemia and OLGA 3–4; pernicious anaemia and OLGIM 3–4), the patient population to be followed up would have been reduced from the baseline 200 to 18 or 8 patients with NNS of 5.4 and 3.3, and a cost per gastric neoplastic lesion detected of D 837 and D 511, respectively. However, this was in part offset by the limited absolute number of gastric neo-plastic lesions detected, corresponding to 21% and 15.8% of all the potentially detectable lesions.
Figure 4 shows the correlation between overall cost of surveillance strategies and
NNS (correlation coefficient r = 0.9873 (95% confidence interval 0.88–0.99), p = 0.0002).3.2. Incremental costs per additional gastric neoplastic lesion detected. As shown in Table 8, the incremental cost-effectiveness of the least effective option (surveillance only for patients with pernicious anaemia and OLGIM stages 3–4) as
31
compared to a strategy of no surveillance was equal to the cost per gastric neoplastic lesion detected, that is D 511. Proceeding from the least to the more effective options (from the bottom to the top in Table 8), the incremental cost-effectiveness of a strategy based on the presence of pernicious anaemia and OLGA 3–4 was D 1318 per additional gastric neoplastic lesions detected. On the other hand, when excluding extensive atrophy as stratifying factor, the incremental cost-effectiveness of a strategy based only on pernicious anaemia substantially rose, becoming D 2859, which was, however, substantially lower com-pared to D 5208 of the unselected population. Since the inclusion of type 1 gastric carcinoids among gastric neoplastic lesions would underestimate the actual cost of surveil-lance for gastric malignancies, we also performed the cost analyses limited to these lesions, with the limit of small sample size: Taking into consideration only gastric adenocarcinoma and high-grade dysplasia, in the unselected cohort of 200 patients five gastric malignancies were detected, corresponding to a NNS of 72.2 and a cost per gastric malignancy detected of D 11,191. When restricting the surveillance to only patients with pernicious anaemia (52%), the NNS decreased to 48.2 and the cost per gastric malignancy to D 7471, still detecting 80% (n = 4) of the five gastric malignancies. Combining pernicious anaemia with age over 50 years and OLGA stages 3–4, the NNS decreased to 12 with an over-all cost of D 3720 and a cost per gastric malignant lesion detected of D 1860, still detecting two (40%) of the overall five malignant lesions. The incremental cost per additional gastric malignancy detected of this last strategy was D 2170 compared to D 13,097 of the strategy restricted to pernicious anaemia.
32
In conclusion, our study provided a cost estimate of a 4-year endoscopic surveillance in Italy, and it showed how the restriction of an eventual program to subgroups of AG patients with pernicious anaemia may lead to a nearly 50% cost reduction still detecting 74% of gastric neoplastic lesions.
33
C
ONCLUSIONSBased on the studies conducted during this PhD project, the occurrence and risk factors for gastric neoplastic lesions in patients with AIG and EAG has been assessed; the role of electronic chromoendoscopy at follow-up in EAG and AIG in order to stage the presence of intestinal metaplasia and to distinguish between gastric polypoid lesions was demonstrated and the cost-effectiveness of surveillance strategies based on independent risk factors in a low risk area on patients with AIG and EAG was provided. In 2012 the first European guidelines on precancerous conditions (MAPS) [42] where published and these studies were considered for the development of the update of this guideline in 2019 [43] showing the importance of these evidences in the management of gastric precancerous conditions.
34
R
EFERENCES1. Bray F, Ferlay J, Soerjomataram I et al. Global cancer statistics 2018: GLOBOCAN estimates of incidence and mortality worldwide for 36 cancers in 185 countries. CA Cancer J Clin 2018.
2. Lauren P. The two histologic main types of gastric carcinoma: diffuse and so-called intestinal type carcinoma, an attempt at a histo-clinicalclassification. Acta Parhol Microb Scan 1965.
3. Correa P. Human gastric carcinogenesis: a multistep and multifactorial process. First American Cancer Society Award Lecture on cancer epidemiology and prevention. Cancer Res 1992.
4. Toh BH. Diagnosis and classification of autoimmune gastritis. Autoimmun Rev 2014;13:459–62.
5. Jacobson DL, Gange SJ, Rose NR, et al. Epidemiology and estimated population burden of selected autoimmune diseases in the United States. Clin Immunol Immunopathol 1997;84:223–43.
6. Carmel R. Prevalence of undiagnosed pernicious anemia in the elderly. Arch Intern Med 1996;156:1097–100.
7. De Block CE, De Leeuw IH, Van Gaal LF. Autoimmune gastritis in type 1 diabetes: a clinically oriented review. J Clin Endocrinol Metab 2008;93:363–71.
8. Lahner E, Centanni M, Agnello G, et al. Occurrence and risk factors for autoimmune thyroid disease in patients with atrophic body gastritis. Am J Med 2008;121:136–41.
9. Dixon MF, Genta RM, Yardley JH, et al. Classification and grading of gastritis. The updated Sydney System. International Workshop on the Histopathology of Gastritis, Houston 1994. Am J Surg Pathol 1996;20:1161–81.
10. Toh BH, Alderuccio F. Pernicious anemia. Autoimmunity 2004;37: 357–61.
11. Lahner E, Annibale B. Pernicious anemia: new insights from a gastroenterological point of view. World J Gastroenterol 2009;15:5121–8.
12. Marignani M, Delle Fave G, Mecarocci S, et al. High prevalence of atrophic body gastritis in patients with unexplained microcytic and macrocytic anemia: a prospective screening study. Am J Gastroenterol 1999;94:766–72.
13. Hershko C, Ronson A, Souroujon M, et al. Variable hematologic presentation of autoimmune gastritis: age-related progression from iron deficiency to cobalamin depletion. Blood 2006;107:1673–9.
14. Miceli E, Lenti MV, Padula D, et al. Common features of patients with autoimmune atrophic gastritis. Clin Gastroenterol Hepatol 2012;10: 812–4.
35
15. Soykan I, Yakut M, Keskin O, et al. Clinical profiles, endoscopic and laboratory features and associated factors in patients with autoimmune gastritis. Digestion 2012;86:20–6. 16. Tenca A, Massironi S, Pugliese D, et al. Gastro-esophageal reflux and antisecretory drugs
use among patients with chronic autoimmune atrophic gastritis: a study with pH-impedance monitoring. Neurogastroenterol Motil 2016;28:274–80.
17. Pimentel-Nunes P, Dinis-Ribeiro M, Soares JB et al. A multicenter validation of an endoscopic classification with narrow band imaging for gastric precancerous and cancerous lesions. Endoscopy 2012; 44: 236–246.
18. Kikuste I, Marques-Pereira R, Monteiro-Soares M et al. Systematic review of the diagnosis of gastric premalignant conditions and neoplasia with high-resolution endoscopic technologies. Scand J Gastroenterol 2013; 48:1108–1117.
19. Buxbaum JL, Hormozdi D, Dinis-Ribeiro M et al. Narrow-band imaging versus white light versus mapping biopsy for gastric intestinal metaplasia: a prospective blinded trial. Gastrointest Endosc. 2017; 86:857-865.
20. Pimentel-Nunes P, Libanio D, Lage J et al., A multicenter prospective study of the real-time use of narrow-band imaging in the diagnosis of premalignant gastric conditions and lesions. Endoscopy. 2016; 48:723–730.
21. Lage J, Pimentel-Nunes P, Figueiredo PC et al. Light-NBI to identify high-risk phenotypes for gastric adenocarcinoma: do we still need biopsies? Scand J Gastroenterol 2016; 51:501– 506.
22. Lahner E, Zullo A, Hassan C, Perri F, Dinis-Ribeiro M, Esposito G, et al. Detection of gastric precancerous conditions in daily clinical practice: a nationwide survey. Helicobacter 2014; 19:417–424.
23. Zullo A, Esposito G, Ridola L, Hassan C, Lahner E, Perri F, et al. Prevalence of lesions detected at upper endoscopy: an Italian survey. Eur J Intern Med 2014; 25:772–776.
24. Rugge M, Pennelli G, Pilozzi E, Fassan M, Ingravallo G, Russo VM, et al. Gruppo Italiano Patologi Apparato Digerente (GIPAD); Società Italiana di Anatomia Patologica e Citopatologia Diagnostica/International Academy of Pathology, Italian division (SIAPEC/IAP). Gastritis: the histology report. Dig Liv Dis 2011; 43 (S): S373–S384.
25. Vakil N, van Zanten SV, Kahrilas P, et al. Global Consensus Group The Montreal definition and classification of gastroesophageal reflux disease: a global evidence-based consensus. AmJ Gastroenterol 2006;101:1900–20.
26. Tack J, Talley NJ, Camilleri M, et al. Functional gastroduodenal disorders. Gastroenterology 2006;130:1466–79.
27. Longstreth GF, Thompson WG, Chey WD, et al. Functional bowel disorders. Gastroenterology 2006;130:1480–91.
36
28. Lahner E, Gentile G, Purchiaroni F, et al. Single nucleotide polymorphisms related to vitaminB12serumlevels in autoimmune gastritis patients with or without pernicious anaemia. Dig Liver Dis 2015;47:285–90.
29. Lahner E, Norman GL, Severi C, et al. Reassessment of intrinsic factor and parietal cell autoantibodies in atrophic gastritis with respect to cobalamin deficiency. Am J Gastroenterol 2009;104:2071–9.
30. Annibale B, Marignani M, Azzoni C, et al. Atrophic body gastritis: distinct features associated with Helicobacter pylori infection. Helicobacter 1997;2:57–64.
31. Carabotti M, Lahner E, Esposito G, et al. Upper gastrointestinal symptoms in autoimmune gastritis: a cross-sectional study. Medicine (Baltimore). 2017;96:e5784.
32. Fiocca R, Mastracci L, Milione M, et al. Gruppo Italiano Patologi Apparato Digerente (GIPAD); Società Italiana di Anatomia Patologica e Citopatologia Diagnostica/International Academy of Pathology, Italian division(SIAPEC/IAP). Microscopic esophagitis and Barrett’s esophagus: the histology report. Dig Liver Dis. 2011; 43:S319–S330.
33. Fiocca R, Mastracci L, Riddell R, et al. Development of consensus guidelines for the histologic recognition of microscopic esophagitis in patients with gastroesophageal reflux disease: the Esohisto project. Hum Pathol. 2010;41:223–231.
34. Yerian L, Fiocca R, Mastracci L, et al. Refinement and reproducibility of histologic criteria for the assessment of microscopic lesions in patients with gastroesophageal reflux disease: the Esohisto Project. Dig Dis Sci. 2011;56:2656–2665.
35. Schneider NI, Plieschnegger W, Geppert M, et al. Validation study of the Esohisto consensus guidelines for the recognition of microscopic esophagitis (histoGERD Trial). Hum Pathol. 2014;45: 994–1002.
36. Lahner E, Esposito G, Angeletti S, et al. Endoscopic appearances of polypoid type 1 gastric microcarcinoids by narrow-band imaging: a case series in a referral center. Eur J Gastroenterol Hepatol. 2016; 28:463-8.
37. Lahner E, Esposito G, Pilozzi E, et al. Occurrence of gastric cancer and car-cinoids in atrophic gastritis during prospective long-term follow up. Scand JGastroenterol 2015;50:856–65.
38. Vannella L, Lahner E, Osborn J, et al. Risk factors for progression to gastricneoplastic lesions in patients with atrophic gastritis. Aliment Pharmacol Ther2010;31:1042–50.
39. Hirota WK, Zuckerman MJ, Adler DG, et al. Standards of practice committee,American Society for gastrointestinal endoscopy. ASGE guideline: the role ofendoscopy in the surveillance of premalignant conditions of the upper GI tract.Gastrointest Endosc 2006;63:570–80.
37
40. Dockray GJ, Varro A, Dimaline R, et al. The gastrins: their production and bio-logical activities. Annu Rev Physiol 2001;63:119–39.
41. Lahner E, Esposito G, Pilozzi E, et al. Gastric cancer in patients with type I gastric carcinoids. Gastric Cancer 2015;18:564–70.
42. Dinis-Ribeiro M, Areia M, de Vries AC et al. Management of precancerous conditions and lesions in the stomach (MAPS): guideline from the European Society of Gastrointestinal Endoscopy (ESGE), European Helicobacter Study Group (EHSG), European Society of Pathology (ESP), and the Sociedade Portuguesa de Endoscopia Digestiva (SPED). Endoscopy 2012; 44:74–94.
43. Pimentel-Nunes P, Libậnio D, Marco-Pinto R, Areia M, Leja M, Esposito G, Garrido M, Kikuste I, Megraud F, Matysiak-Budnik T, Annibale B, Dumonceau JM, Barros R, Fléjou JF, Carneiro F, van Hooft JE, Kuipers EJ, Dinis-Ribeiro M. Management of epithelial precancerous conditions and lesions in the stomach (MAPS II): European Society of Gastrointestinal Endoscopy (ESGE), European Helicobacter and Microbiota Study Group (EHMSG), European Society of Pathology (ESP), and Sociedade Portuguesa de Endoscopia Digestiva (SPED) guideline update 2019. Endoscopy 2019.
38
Table 1. Frequency of reflux and dyspeptic symptoms with respect to the intragastric distribution of metaplastic atrophic gastritis in the 668
patients included
39
Table 2. Predictive factors associated with different intragastric patterns of metaplastic atrophic
40
41
42
Table 5. Accuracy estimates for the diagnosis of OLGIM III – IV according to different cutoffs for EGGIM. Cutoff Sensitivity (95% CI) Specificity (95% CI) LR+ (95% CI) LR- (95% CI) >2 100.0 (92.5-100.0) 70.9 (64.2 - 77.1) 3.4 (3.1 – 3.7) 0.0 (0.0 – 0.0) >3 97.9 (88.7-99.9) 73.9 (67.3 - 79.8) 3.7 (3.4 – 4.1) 0.0 (0.0 – 0.0) >4 89.4 (76.9 - 96.5) 94.6 (90.5 - 97.3) 16.5 (14.9 – 18.3) 0.1 (0.1 – 0.1) >5 78.7 (64.3 - 89.3) 96.5 (93.0 - 98.6) 22.8 (19.6 – 26.5) 0.2 (0.2 – 0.3) >6 46.8 (32.1 - 61.9) 98.0 (95.0 - 99.5) 23.8 (17.5 – 32.2) 0.5 (0.4 – 0.7) >7 27.7 (15.6 - 42.6) 99.0 (96.5 - 99.9) 28.1 (17.7 – 44.6) 0.7 (0.5 – 1.2) >8 10.6 (3.5 - 23.1) 99.5 (97.3 - 100.0) 21.6 (9.4 – 49.5) 0.9 (0.4 – 2.1) >9 6.4 (1.3 - 17.5) 99.5 (97.3 - 100.0) 13.0 (4.3 – 38.7) 0.9 (0.3 – 2.8)
43
Table 6. Endoscopic grading of gastric intestinal metaplasia (EGGIM) score compared to operative link on gastric intestinal metaplasia
(OLGIM) score [n (%)] EGGIM Score 0 1-4 5-10 OLGIM grade 0 I-II III-IV 125 (91.9) 3 (4.5) 0 11 (8.1) 53 (79.1) 5 (10.6) 0 11 (16.4) 42 (89.4) Extent of GIM Absent Focal/Moderate Extensive
44
Table 7. Narrow band imaging (NBI) features of gastric polypoid lesions; *p<0.012 versus adenomas; °p=0.003 versus adenomas; # versus
hyperplastic polyps and type-1 gastric carcinoids p=0.01; ^ versus hyperplastic polyps p<0.001
NBI features Hyperplastic polyps
n= 29 (55.8%)
Adenomas n= 5 (9.6%)
Type-1 gastric carcinoids n= 18 (34.6%) Mucosal pattern Regular circular Regular tubulo-villous Irregular 24 (82.8%)* 5 (17.2%) 0 1 (20%) 4 (80%)# 0 17 (94.4%)° 0 1 (5.6%)
Light blue crest Present Absent 1 (3.4%) 28 (96.6%) 0 5 (100%) 1 (5.6%) 17 (94.4%) Vascular pattern Regular Irregular 29 (100%) 0 5 (100%) 0 15 (83.3%) 3 (16.7%) Vascular thickness Normal or thick Thin or ultrathin 28 (96.6%) 1 (3.4%) 5 (100%) 0 17 (94.4%) 1 (5.6%) Vascular density
45 High Low Variable 29 (100%) 0 0 5 (100%) 0 0 15 (83.3%) 2 (11.1%) 1 (5.6%) Other features Central erosion
Central erosion + demarcation line 1 (3.4%) 0 0 0 8 (44.4%)^ 6 (33.3%)^
46
Table 8. Main results of the present cost analysis (see text). Surveillance strategies have been defined according to the risk factors adopted
to stratify the initial population, passing from no stratification (first strategy) to the restriction of the surveillance to only patients with pernicious anemia, presence of extensive atrophy and presence of stages 3 or 4 of the operative link of gastritis (OLGA) or intestinal metaplasia (OLGIM) assessment in combination with pernicious anaemia or age over 50 years. Surveillance strategies with a higher yield (number of gastric neoplastic lesions detected) and lower overall cost compared to the previous strategy have been selected, the others were ruled out. The incremental cost needed to detect one additional gastric neoplastic lesion, as compared to the more expensive strategy, has been calculated in order to define the incremental costs of different strategies. Strategies that were more costly and less effective were ruled out by simple dominance. Strategies that were more costly and less effective than a combination of other strategies were ruled out by weak dominance.
47
Figure 1. EGGIM scores for antrum, incisura and corpus mucosa. Detailed
observation of greater curvature of the antrum, incisura and greater curvature of corpus. EGGIM 0: normal mucosa (no GIM; first row), EGGIM 1: presence of regular ridge/tubulo-villous mucosa with regular vessels in a small area of the mucosa (focal GIM, less or equal than 30% of the area; second row) or EGGIM 2: presence of regular ridge/tubulo-villous mucosa with regular vessels and
presence of light blue crests in several areas of the mucosa (EIM in that area, more than 30% of the area; third row).
48
Figure 2. Example of an upper gastrointestinal endoscopy with NBI without
49
Figure 3. Examples of NBI appearance of a hyperplastic polyp, a type 1 gastric
carcinoid and an adenoma. On the left side an hyperplastic polyp with regular circular mucosal pattern and a high density vascular pattern. On the center a type 1 gastric carcinoid with regular circular mucosal pattern, normal vascular pattern and a central erosion with demarcation line. On the right side an adenoma with a tubule-villous mucosal pattern and a normal vascular pattern.
50
Figure 4. Scatter diagram showing the correlation between number needed to
screen (NNS) and overall cost of the different surveillance strategies (D ) reported in Table 1.Correlation coefficient r = 0.9873 (95% confidence interval 0.88 to 0.99), p = 0.0002.Str 1 = Unselected population; Str 2 = Pernicious anemia; Str 3 =
Extensive atrophy; Str 4 = Pernicious anemia and OLGA 3–4; Str 5 = Pernicious anemia, age over 50 years andOLGA 3–4;Str 6 = Pernicious anemia and OLGIM 3– 4.Str = surveillance strategy; OLGA = operative link of gastritis; OLGIM =