UNIVERSITY OF SIENA
DEPARTMENT OF MOLECULAR AND DEVELOPMENTAL
MEDICINE
PhD IN
MOLECULAR MEDICINE
CYCLE XXXIII
COORDINATOR
Prof. Vincenzo Sorrentino
TITLE OF THE THESIS:
Mechanical properties of cytoskeleton proteins studied in living cells by
combining optical tweezers and deformability cytometry.
SCIENTIFIC SECTOR: BIO/09
PhD student
Giulio Bianchi
TUTOR
Acknowledgements
The PhD course has been one of the most important part of my life faced with my partner Noemi taking all the good and bad things along the path, supporting me all the time. It has been a long and beautiful journey and it won’t be possible without the total support of my family and relatives.
I would first like to thank my supervisors, Dr. Pasquale Bianco, whose expertise was invaluable in formulating the research questions and methodology and Prof. Marco Linari for the support correcting this thesis and for his precious scientific advices. Your insightful feedback pushed me to sharpen my thinking and brought my work to a higher level. Special thanks to Prof. Vincenzo Lombardi who let me understand, with his incredible scientific knowledge and experience, how beautiful is working in scientific research and how is important to share knowledge and good ideas.
Thanks to all the amazing people met in Greifswald during my year abroad. There I had the fortune to work with the Biomechanics Group. Thanks to Dr. Oliver Otto that has supervised all my work and supported me all the time and encouraged me to try every possible road, you were a wise guide for my scientific work. Thanks to Dr. Ricardo H. Pires for his patience and time spent with me, for his precious comments and suggestion in my scientific work and thesis and most important for keeping up a funny atmosphere in the lab.
Special thanks to my colleagues and friends Dr. Irene Pertici and Caterina Squarci that made this journey easier and full of laughs, I couldn’t have had better company.
Table of contents
Summary ... 1
1. Introduction ... 3
1.1 Background ... 3
1.2 Structure and basic functions of the cytoskeletal filaments ... 4
1.3 Why study Cell Mechanics? ... 7
1.4 The use of Optical Tweezers to study cell mechanics applying local
membrane deformation ... 8
1.5 Real-Time Deformability Cytometry to study cell mechanics applying
global cell deformation ... 9
1.6 Hypoxia as a cellular stress and cytoskeletal proteins modulator ... 10
1.7 Correlation between hypoxia and cell apoptosis-necrosis ... 12
2. Aim of the thesis ... 14
3. Material and Methods ... 15
3.1 Dual Laser Optical Tweezers (DLOT) setup ... 15
3.2 Force calibration ... 17
3.3 Flow chamber devised to grow the HEK293 cells for DLOT mechanics . 19
3.4 Membrane tether formation, elongation and imaging using the DLOT 20
3.5 Indentation using the DLOT ... 20
3.6 Real-Time Deformability Cytometry (RT-DC) experimental chip and
setup ... 21
3. 10 Analysis of RT-FDC results ... 26
3.11 Western Blot to detect specific proteins in the cells ... 26
3.12 HEK293 cell culture ... 26
4. Results and Discussions ... 29
4.1 Cell mechanical properties studied with the DLOT ... 29
4.1.1 Dynamics of tether elongation ... 29
4.1.2 Tether effective viscosity ... 33
4.1.3 Membrane tether threshold force ... 34
4.1.4 Measurement of the tether membrane diameter ... 35
4.1.5 Membrane bending modulus ... 36
4.1.6 Membrane-cytoskeleton adhesion energy per unit area ... 36
4.1.7 Cell indentation using the DLOT ... 37
4.1.8 Cell Young’s modulus calculation ... 39
4.2 Cell’s mechanical properties studied using RT-FDC ... 41
4.2.1 The effect of oxygen deprivation on mechanical properties of HEK293
cells ... 41
4.2.2 Apoptotic and necrotic cells discrimination ... 44
4.2.3 The mechanical properties of apoptotic and necrotic cells ... 46
4.2.4 Oxygen deprivation and intracellular level of cytoskeletal proteins ... 49
5. Conclusions ... 51
5.1 Definition of the relevant parameters of local cell membrane deformation
... 51
5.2 Cell mechanics studied with RT-FDC in suspension state ... 52
Summary
The topic of this thesis focuses on studying the mechanical properties of the living cell plasma membrane and the mechanical associations of the plasma membrane with the underlying cytoskeleton. The mechanical properties of the cell components, cell plasma membrane and cytoskeleton, as well as membrane-cytoskeleton associations, determine the mechanical properties of the whole cell, important for cellular shape changing behavior and mechanical signal transduction in living cells. Examples of biological processes involving cellular shape changes are deformation of erythrocytes in capillaries, cell division, phagocytosis, pseudopodium and dendritic spine formation, and electromotility of the outer hair cells.
The study of cell membrane mechanics accomplished during my PhD activity is based on the use of two most advanced technological approaches to investigate both local membrane deformation by dual laser optical tweezers (DLOT, (Bianco et al., 2011)) and global cell deformation by real-time florescence deformability cytometry (RT-FDC). This dissertation is divided into two main parts.
In the first part, I present my contribution to the development and application of a system able to study the mechanical properties of plasma membrane of the Human Embryonic Kidney (HEK293) cells in the adherent state. The DLOT was first applied to investigate the dynamics of the formation/retraction of membrane nanotubes (tethers). In physiological conditions, several parameters of plasma membrane and its interaction with the underlying cytoskeleton (tether formation and elongation, tether radius, threshold force for the membrane tether elongation and its viscoelastic nature, the tether diameter, the bending modulus, the membrane-cytoskeleton adhesion energy) were determined and compared with those present in literature. The information on cell membrane mechanics was then integrated with indentation measurements by using the DLOT for applying local deformations in force feedback in the range experienced by the membrane of macrophages during phagocytosis. The mean value of the elastic modulus (Young’s modulus) derived from indentation experiments was 32 ± 8 Pa (mean ± SD), lower than that obtained with AFM measurements. The difference confirms data found in previous work (Coceano et al., 2016) and indicates that my approach, though limited by its intrinsic compliance to lower time resolution, is unique in resolving the load – dependent dynamics of the cytoskeletal rearrangement triggered by a force step.
In the second part, I present experiments conducted during the one-year Ph-D period spent at the University of Greifswald, under the supervision of Dr. Oliver Otto. The experiments were aimed at characterizing the mechanical properties of the HEK293 cells in suspension and how they are influenced by hypoxic stress. Mechanical parameters from control experiments under physiological condition are compared to those obtained in the presence of an increased subpopulation of cells in apoptotic/necrotic state using a high-throughput system, Real-Time Deformability Cytometry (RT-DC (Otto et al., 2015)), which allows to study a high number of cells in short time (1000 cells/s). In
stiffness is increased and cell deformation is reduced. An overall increase in concentration of the main cytoskeletal proteins (ß-actin, α/b-tubulin, vinculin and talin-1), determined by Western blots, was found to accompany mechanical – structural modification by hypoxia.
The successful application of the protocols developed in the thesis for the definition of local and global mechanical properties of the cell membrane and the associated underlying cytoskeleton of HEK293 line, opens the possibility of new investigations on the effects on the relevant cell mechanical parameters of different physical and chemical interventions (temperature, pH and buffer ionic composition), different physiological conditions (metabolic stress as hypoxia), changes in membrane composition, as cholesterol content and disruption or mutation of membrane-linked cytoskeleton proteins. In this respect the methodology established in this thesis represents a new powerful tool for the investigation o membrane-cytoskeleton structure-function in health and disease.
1.
Introduction
1.1 Background
Every cell in our body is permanently subjected to mechanical forces which can induce different levels of cell deformation. Endothelial cells are constantly exposed to hydrostatic pressure, shear stress, and cyclic stretch (Müller-Marschhausen et al., 2008). Mechanical signals in cells play crucial roles in many fundamental cell functions, exert multiple effects and thereby regulate important cellular processes. Moreover, cells have to adapt to changes in their environment in order to maintain their functionality. Multiple studies have addressed how cells respond to mechanical stimulation (Geiger & Bershadsky, 2001; Zamir & Geiger, 2001; Ingber, 2003; Janmey & McCulloch, 2007).
The magnitude of the forces that individual cells are exposed to are in the order of pico- to nanonewtons and result in deformations in the nano- to the micrometer scale; to measure the mechanical properties of single cells, a range of methods is available to cover such low forces and small deformations, including Optical Tweezers (OT) or atomic force microscope (AFM). Furthermore, for a detailed understanding of cell mechanics, it is also important to record the mechanical properties at high forces and large deformations, until mechanical failure is reached.
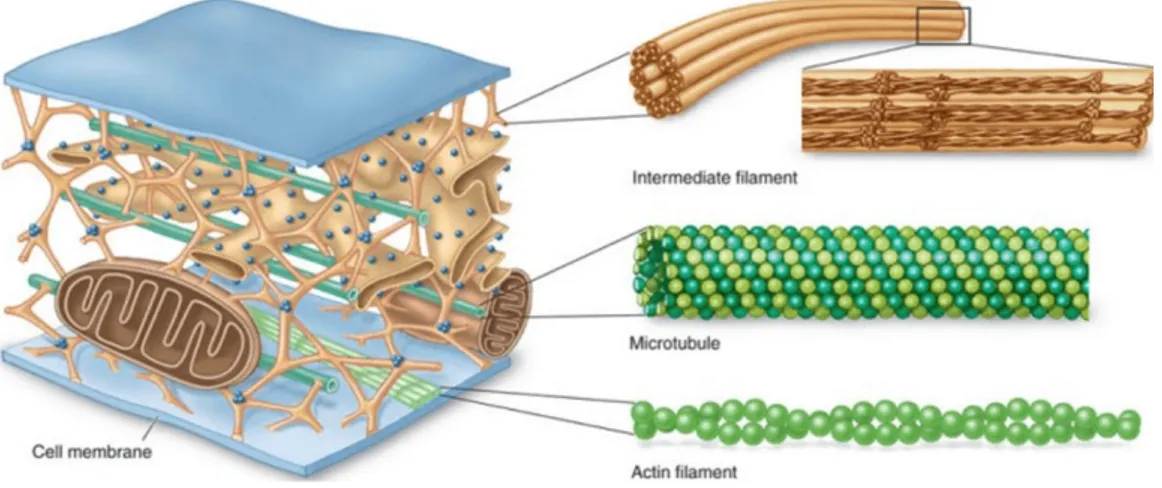
It is widely accepted that the mechanical integrity of the eukaryotic cell is provided by the network of filamentous proteins, called the cytoskeleton (Fig. 1). There are three main components of the cytoskeleton: actin filaments (AFs), microtubules (MTs), and intermediate filaments (IFs), that are distributed throughout the cytosol. In response to external forces, cells will actively rearrange both the organization and contractile activity of the cytoskeleton and redistribute the intracellular stress (Chen et al., 2004). Since the cytoskeleton plays an important role as mechano-transducer (Wang & Thampatty, 2006), changes of its organization could eventually alter the gene transcription process resulting in altered cell adhesion, secretion of extracellular matrix (ECM), protein synthesis and metabolic activity (Ingber, 2006; Orr et al., 2006).
Chemical changes in the environment around the cell can also induce alterations in cytoskeletal organization. Specific agents used to disrupt only one of the three-dominant cytoskeletal components, provide information on which ones is primarily responsible for the structural integrity of the cell. From a chemical point of view, all cytoskeleton filaments are polymers made up of multiple protofilaments, long linear strings of protein subunits that are associated with each other sideways.
Figure 1. Layout of the cytoskeleton components. Microtubules are found in the cell where they maintain cell shape
by resisting compressive forces. Intermediate filaments are found throughout the cell and hold organelles in place. Actin filaments are widely distributed throughout cells, forming a range of cytoskeletal structures and contributing to
an even broader range of processes(Figure from The BIS2A Team, 07.5 The Cytoskeleton MS. OpenStax CNX. 15
giu 2016 http://cnx.org/contents/609c7858-a692-4fb1-9c49-69462e3c739f@1.)
1.2 Structure and basic functions of the cytoskeletal filaments
Since the seventeenth century, many studies started to investigate how the process of self-organization generates dynamic, robust and elaborate structures that organize and ‘animate’ cells. The biological importance of establishing order over diverse length scales and timescales, as well as the challenges of understanding how systems of self-organizing molecules carry out cellular functions are still unknown and under investigations.
The cytoskeleton carries out three broad functions: it spatially organizes the contents of the cell; it connects the cell physically and biochemically to the external environment and generates coordinated forces that enable the cell to move and change shape. To achieve these functions, the cytoskeleton integrates the activity of a multitude of cytoplasmic proteins and organelles. Despite the connotations of the word ‘skeleton’, the cytoskeleton is not a fixed structure whose function can be understood in isolation. Rather, it is a dynamic and adaptive structure whose component polymers and regulatory proteins are in constant flux.
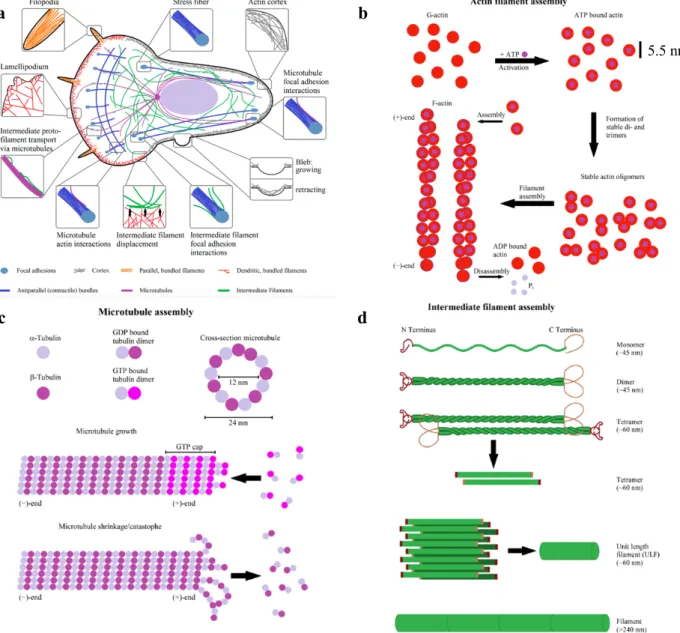
Mechanical forces from inside or outside the cell can affect the activity of these regulatory proteins and, in turn, the local organization of filaments in the networks. The most important differences between the three main cytoskeletal polymers are the architecture and the function of the networks they form, their mechanical stiffness, the dynamics of their assembly, their polarity, and the type of molecular motors with which they associate. Furthermore, the three cytoskeletal proteins interact directly to each other (Fig. 2a).
essential for the contraction process. Although actin-based filaments can be found almost everywhere in the cell, they often concentrate in the thick area just below the cell membrane.
The mechanical properties of the actin cytoskeleton were investigated during several processes such as cell adhesion, migration, and division (Bathe et al., 2008). Different studies have measured in detail the mechanical behavior (force deformation, shear moduli) of actin filaments both in vitro (Chaudhuri et al., 2007; Lieleg et al., 2008; Lee et al., 2010) and in vivo (Gerthoffer, 2005; Kumar et al., 2006). By using synthetic actin gels, it has been observed that both the stiffness and the mechanical behavior of the actin cytoskeleton are crucially dependent on the type and concentration of actin cross-linking proteins such as filamin and α-actinin (Tseng et al., 2002).
Microtubules are made by tubulin. The tubulin subunit is a heterodimer consisting of two
globular proteins called α-tubulin and ß-tubulin closely bound by a non-covalent bond. These heterodimers form hollow cylinders of 14 nm (inner) and 25 nm (outer) diameters that can be more than 100 µm long (Fig. 2c). Their Young's modulus ranged between 0.8 and 1.9 GPa (Deriu et al., 2007). Both monomers have a binding site for guanosine triphosphate (GTP), high energy molecule implicated in many cellular processes. The nucleotide bound to ß-tubulin can be both GTP and GDP. GTP hydrolysis to GDP has an important influence on the dynamics of the microtubule. Along the longitudinal axis of the microtubule, the ß-tubulin molecule of the heterodimer binds to the α-tubulin of the adjacent heterodimer.
Perpendicularly to the α-and-ß-tubulin interaction, the main contacts occur between monomers of the same type (α- α or ß-ß). The longitudinal and lateral contacts make the microtubule rigid, with persistence length ranging between 4 and 8 µm. The speed of polymerization is different at the two extremities of the microtubule, with a higher speed at the “plus” end. Thus the polymerization direction determine the polarity in the filament, with a “plus” end, where the polymerization is faster, and a “minus” end (Margolis & Wilson, 1998). Microtubules grow from the microtubule organizer center, which in the animal cells is the centrosome, located near the nucleus. The centrosome contains an γ-tubulin rings that form nucleation sites for microtubule growing.
In addition to determine the form and rigidity to the cell, microtubules are the track along which the molecular motors proteins move organelles and vesicles, as in the case of the axonal transport in neurons, or of the movement of chromosomes during cell division. Microtubules are also the major structural components of flagella, structures used by the cells to move and cilia, used to move fluids along the cell surface (Olmsted & Borisy, 1973; Rodionov et al., 1994; Vantard et al., 2000). The density of microtubules is much smaller than that of actin microfilaments, showing also a different organization. While the microfilaments form the actin cortex (in non-adherent cells) or actin bundles in adherent cells, microtubules individually radiate from the nucleating center (centrosome) toward the cell membrane (Keating & Borisy, 1999) (Fig. 2a).
Intermediate filaments are constituted of a wide variety of proteins. The members of the IFs
filament) and 35 kDa/nm (32-strand filament) (Fig. 2d). In contrast to actin and microtubules, IFs are considered the most flexible cytoskeleton polymers, determining the cell architecture and the cellular and nuclear stability (Herrmann et al., 2009). Their persistence length is about 1 µm. One of the most widely distributed IFs filament is vimentin. It has been found in endothelial cells, leukocytes, fibroblasts, and myoblasts (Herrmann et al., 2009). Little is known about the assembly and disassembly mechanisms of intermediate filaments with respect to actin filaments and microtubules.
Figure 2. a. Layout of actin, microtubules, and intermediate filaments inside of a cell and their physical interactions.
All three cytoskeletal proteins interact directly with each other. b. Scheme of actin filament formation. First G-actin binds to ATP. Afterwards, it forms stable dimers or trimers and, finally, filaments elongate by addition of monomers. Hydrolysis of ATP to ADP leads to a distinction between the fast growing (+)-end and the slower growing or
b a
c d
1.3 Why study Cell Mechanics?
The relation between structure and cellular function has only recently been defined. The structure of a cell contributes to its overall elasticity and is the product of more than one organization level. In particular, the elasticity of a cell allows the latter to restore its shape after a quick deformation by external pressure. The simplest way to assess the mechanical properties of a cell is to measure the elasticity of the cell itself, which can be quantified by obtaining the ratio between cell stress and strain after a given deformation.
This ratio is defined as the Young's modulus (Y) or elastic modulus (E), measured in units of Pa (1Pa = 1N/m2). All cells have a wide range of elasticity, with E ranging from 0.01 kPa to 40 kPa depending not only on the type of cell but also on the method used to measure this mechanical parameter (Coceano et al., 2016).
Using appropriate mathematical models, additional data can be extracted from cell deformation measurements to provide a more detailed picture on cellular mechanical properties. Because of other forces such as flow contributing to response to mechanical deformation, cellular mechanics cannot simply be described in terms of elasticity. The combination of the elastic and viscous behavior of a cell describes its viscoelastic properties, influenced not only by the cytoskeleton but also by the granular nature and the flow-like behavior of the cytoplasm (Liu et al., 2016). If, for example, the cell is under constant flow for a given period of time, two moduli can be identified: the storage modulus at the initial resistance to deformation and the loss modulus identified as the rigidity of the cell once the load reaches the equilibrium (Darling et al., 2008). Storage and loss moduli of the cell can be used as biomarkers to characterize and distinguish different types of cells (Li et al., 2012; Liu et al., 2016). This thesis focuses on the elastic responses following mechanical deformation of Human Embryonic Kidney (HEK293) cell line.
The mechanical deformation of cells in vivo can result from a variety of stresses. It can take the form of pure liquid in the lumen of the arteries and veins or a weight in the bones. The cell also experiences in vivo internal pressures that have been shown to act through the cytoskeleton and affect the cell's mechanical properties. These, in turn, can also change their behavior (Chan & Ulfendahl, 1997).
The mechanical behavior of the nucleus also contributes to the cellular elasticity. Several studies reported that the Young’s modulus of the nucleus is 3-10 times more rigid than the surrounding cytoplasm with up to 2-fold higher viscosity (Guilak & Mow, 2000; Caille et al., 2002). From a mechanical point of view, the nucleus can be divided into two parts: the inner nucleus, which consists of chromatin and nucleoli and the outer nuclear envelope of laminins and membrane.
The stiffer nucleus component is the outer envelope, with an Y of about 25 mPa(Dahl et al., 2004). In addition, it has been shown that cell nucleus deformation not only varies in response to shear flow, compression, and stretching, but that this different deformation also alters how the DNA is packed within the nucleus itself (Maniotis et al., 1997), changing in this way genes transcription and therefore the overall cell behavior (Baker et al., 1997).
mechanical stimulation of the entire cell. The first category includes Optical Tweezers while the Real-Time Deformability Cytometry (RT-DC) falls into the second category.
One of the most important cellular stress that modify the membrane stiffness is the oxygen deprivation (Vogler et al., 2013). When cells start to experience hypoxia a signal cascade is activated, and the cytoskeletal matrix starts to be modified, in relation to the formation of stress fibers and the increase in synthesis of cytoskeletal proteins (Heasman & Ridley, 2008)
1.4 The use of Optical Tweezers to study cell mechanics applying local membrane
deformation
Optical tweezers (OT) are a very powerful tool for quantifying molecular forces in vitro and recent developments have expanded the range of their applications. OT combine unique features including high-resolution position and force measurements that allow measurement of Angstrom-scale movements and sub-pN forces (Greenleaf et al., 2005; Moffitt et al., 2008). Dynamic measurements at microsecond temporal resolution (Capitanio et al., 2012) and trapping of intracellular structures make them an ideal choice in several studies (Neuman & Nagy, 2008). OT are easily implemented in an optical microscope by focusing a laser beam through the microscope objective to create a large gradient of light intensity. Dielectric microparticles are stably trapped near the beam focus owing to the interaction between the light intensity gradient and the particle itself. A polystyrene or silica microsphere (bead) is usually trapped and used as a handle to manipulate biological molecules or cells bound to it. The bead position is used to probe the movements, while the force applied to the molecule or cell is simultaneously measured.
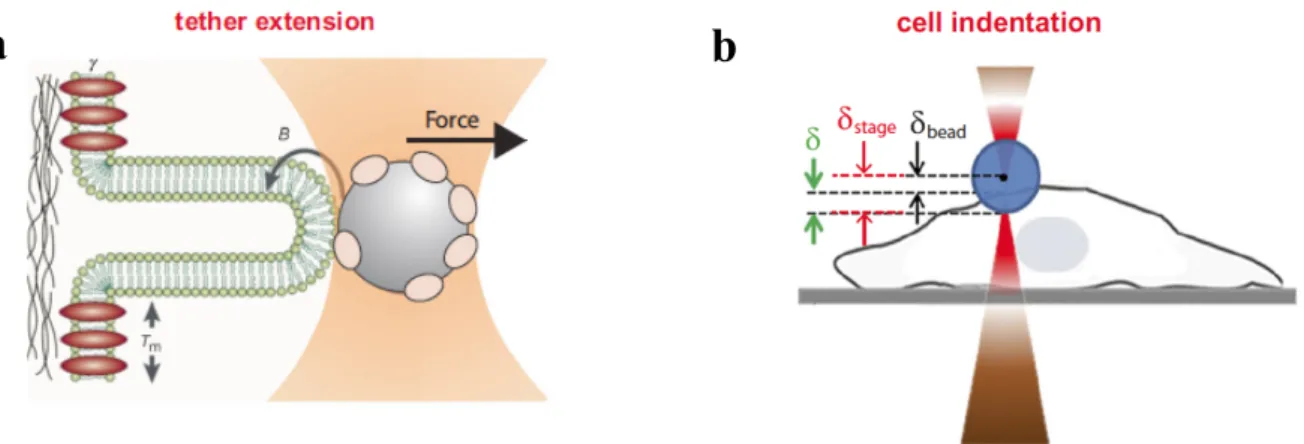
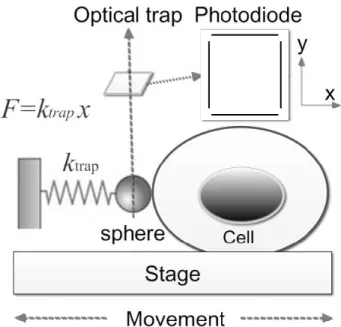
OT can be used to stretch cells or subcellular structures and study their elastic and viscoelastic properties. The bilayer of animal cell plasma membranes typically conforms to the cytoskeleton in a multitude of rapidly changing morphologies like a dynamic tight-fitting glove. This aspect of bilayer– cytoskeleton adhesion is well illustrated by the behavior of tethers. Membrane tethers (or nanotubes) are spontaneously generated by cells or can be artificially extracted from the cell membrane by application of local force (Hochmuth et al., 1973; Waugh & Hochmuth, 1987). The spontaneous generation of membrane tethers is at the base of important biological processes, among which included filopodia extension, endocytosis, and nanotube connections between cells (Baker, 2017). On the other hand, the artificial generation of membrane tethers is an important method to study the biophysical properties of spontaneously generated tethers and obtain information about the membrane mechanical properties. Tether extension is achieved by attaching a trapped bead to the membrane and applying a force by moving either the stage or the trap (Fig. 3a).
When tethers (0.2–0.5 μm in diameter) are formed, for example, on neuronal growth cones, they can be dragged laterally(Dai & Sheetz, 1995)over long distances at rapid rates (> 2 μm/s) with low forces (∼7 pN). Because 7 pN is insufficient to extract membrane proteins from the bilayer(Evans,
Different configurations have been developed to perform nanoindentation with optical tweezers on cells (Fig. 3b).
Indentation can be performed axially by moving the sample through a piezoelectric stage against a trapped dielectric bead (Yousafzai et al., 2016), or by moving the trap towards the cell either in a linear (Dy et al., 2013) or in an oscillatory way (Falleroni et al., 2018). Another possibility is to use a lateral indentation approach, where the sample or the trap is moved along the image plane against a perpendicular cell membrane (Zhou et al., 2014). Due to the low stiffness and the high force resolution, the Optical Tweezers has been used extensively to characterize local mechanical properties of cells (Sheetz & Dai, 1996; Tavano et al., 2011)
Figure 3. a. Schematic rappresentation of tether formation using Optical Tweezers. Tether extension is achieved by
attaching a trapped microbead to the membrane and applying a pulling force by moving either the stage or the trap, while the membrane dynamically rebinds to the cytoskeleton just as rapidly as the tether moves on. Generation of membrane tethers is at the base of important biological processes, among which included filopodia extension, endocytosis, and nanotube connections between cells. b. Schematic rappresentation of cell indentation using Optical Tweezers. Indentation can be performed axially by moving the sample through a piezoelectric stage against a trapped dielectric bead, or by moving the trap towards the cell either in a linear or in an oscillatory way. Stage displacement is represented in red, the calculated force in green and the calculated indentation in black (Figure from (Arbore et al., 2019)).
1.5 Real-Time Deformability Cytometry to study cell mechanics applying global cell
deformation
Mechanical phenotyping has long been discussed as a marker- free way of quantifying functional changes of physiological and pathological origin in cells (Elson, 1988). This idea has been validated in the context of cell differentiation (Ekpenyong et al., 2012) and malignant transformation (Remmerbach et al., 2009) and has spawned the development of many basic research methods(Van Vliet et al., 2003). These techniques generally have throughput rates of 10 – 100 cells/h, which is far too low for applications in biology, biotechnology and medicine, for which a throughput comparable to that of a standard flow cytometer is required (~1000 cells/s).
b
a
~1000 cells/s, comparable to that of fluorescence-based flow cytometers, but the total number of cells analyzed is limited to a few thousand.
In contrast to DC, in which cells are deformed by inertial forces, with RT-DC cells are flowed through a microfluidic channel constriction and deformed without contact by shear stresses and pressure gradients (Otto et al., 2015). RT-DC permits a cell mechanical characterization of large populations (>100000 cells) with analysis rates greater than 100 cells/s, is sensitive to cytoskeletal alterations and can distinguish cell-cycle phases, track stem cell differentiation into distinct lineages and identify cell populations in whole blood by their mechanical fingerprints. This technique adds a new marker-free dimension to flow cytometry with diverse applications in biology, biotechnology and medicine.
1.6 Hypoxia as a cellular stress and cytoskeletal proteins modulator
Aerobic organisms require oxygen (O2) to produce energy. O2 deprivation generates significant
stress in living cells, originating several changes to adapt the cell to oxygen deprivation. Hypoxic changes are mostly conveyed by altering gene expression patterns, which is mostly controlled by the hypoxia-inducible factor (HIF) transcription factors (Majmundar et al., 2010). HIFs are obligate heterodimers consisting of an O2-labile α subunit and a stable β subunit. Mammals possess three
isoforms of HIFα, of which HIF1α and HIF2α (also known as EPAS1) which are structurally similar and best characterized. In well oxygenated environments, HIFα subunits are hydroxylated at conserved proline residues. These modifications are mediated by Prolyl Hydroxilases (PHDs), whose activities are regulated by O2 availability (Kaelin & Ratcliffe, 2008). Hydroxylated HIFα is, in turn,
recognized and marked for proteasomal destruction by an E3 ubiquitin ligase, the von Hippel-Lindau protein (pVHL) complex. In addition, the Factor Inhibiting HIF-1 (FIH) protein also contributes to HIF-1 inactivation in normoxic conditions by hydroxylating HIF-1 and preventing interaction of this subunit with the co-activators p300 and CREB Binding Protein (CBP).
In the setting of hypoxic stress, prolyl hydroxylase domain (PHD)-containing enzymes activity is diminished, and stabilized HIFα proteins can induce transcription of genes with adaptive functions binding to specific DNA region called Hypoxia Response Element (HRE) (Fig. 4).
Figure 4. Oxygen-dependent regulation of HIFα
and its target genes. HIFα is continuously hydroxylated by PHDs and FIH in sufficiently oxygenated environments (left). Hydroxylation of two proline residues by PHDs leads to subsequent proteasomal degradation after binding with VHL, whereas asparagine hydroxylation by FIH inhibits the interaction of HIF with p300/CBP and prevents transcriptional activation. Under hypoxia (right), HIFα is stabilized and translocated to the nucleus,
fibrosis, cancer, pulmonary hypertension, wound healing and some of them are strictly related to a dysregulation in the cytoskeleton due to the prolonged deprivation of oxygen. Therefore, a better understanding of hypoxia-induced changes in the cytoskeletal regulation might lead to better insight into these pathologies.
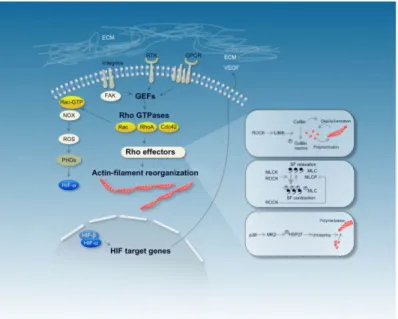
Since hypoxia influences actin dynamics, it is a straightforward finding that cell shape, adhesion, and movement are greatly altered in hypoxic cells compared to cells grown in Normoxia (Vogler et al., 2013). Hypoxic cell environment changes the activity of Rho guanosine triphosphatases (Rho GTPases), especially RhoA, and downstream signaling molecules that regulate the cytoskeletal matrix (Heasman & Ridley, 2008) (Fig. 5).
Figure 5. The scheme depicts mechanisms that
are involved in actin filament reorganization, including stress fiber polymerization and stress fiber contraction in hypoxia. Cytoskeletal actin dynamics are affected by different classes of plasma membrane receptors, among them G-protein-coupled receptors (GPCRs) and receptor tyrosine kinases (RTKs). The plasma-membrane receptors modulate the activity of Rho guanosine triphosphatases (Rho GTPases) through Rho guanine nucleotide-exchange factors (GEFs), which then orchestrate changes to the actin cytoskeleton by a variety of downstream effectors. HIF target genes (e.g., VEGF) bind to plasma-membrane receptors, which could provide a way of hypoxic regulation of the actin cytoskeleton. (Figure from (Zieseniss, 2014))
The ECM, able to direct cellular organization by interacting with cell-surface receptors and by the subsequent activation of intracellular signal-transduction pathways, changes its architecture in the presence of hypoxia (Myllyharju & Schipani, 2010) by modulators like collagen hydroxylases (Hofbauer et al., 2003).
Many cytoskeletal proteins are implicated in focal adhesion between ECM and intracellular cytoskeleton and their synthesis, polymerization and depolymerization are affected by hypoxia. Several reports have described an upregulation of integrin, a transmembrane protein family, cell-surface expression in various cell lines in hypoxia (Keely et al., 2009; Vogler et al., 2013) that interact with a non-receptor cytoplasmic tyrosine kinase, focal adhesion kinase (FAK), promoting the remodeling of the actin cytoskeleton and the modulation of both cell motility and cell shape (Mitra et al., 2005).
integrins and couples them to the actin cytoskeleton. The upregulation of Talin-1 is mediated by enzyme Calpain2 that cleaves the protein increasing the turnover of FAs (Bate et al., 2012). In hypoxic conditions the presence of NO reduce the enzymatic efficiency (Zhang et al., 1998), meaning a higher number of not cleaved protein and a higher number of FAs that tend to anchor the cells stronger to the plate. To support the idea that with low level of oxygen the cells are stronger anchored is known that Vinculin, a cytoskeletal protein involved in linkage of integrin adhesion molecules to the actin cytoskeleton, increases at the level of monomeric protein combined with a higher number of patches (Misra et al., 2012) reflecting a stronger bind to the plate.
1.7 Correlation between hypoxia and cell apoptosis-necrosis
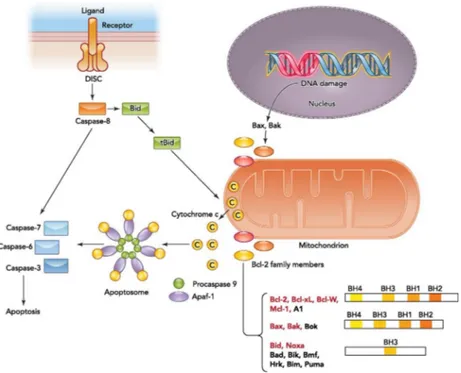
Apoptosis is a cell-intrinsic cell suicide program used by multicellular organisms to eliminate not needed or potentially dangerous cells in an organism. At the molecular level two major pathways: the intrinsic and the extrinsic signaling pathways, can be distinguish. The two pathways activate different initiator caspases but converge at the level of effector caspases (Fig. 6).
The extrinsic signaling pathway is initiated by binding of a death ligand to a death receptor on the cell surface. Binding of CD95 ligand to the CD95, for instance, results in the formation of the CD95 death-inducing signaling complex (DISC) comprised of the FAS-associated death domain (FADD), procaspase-8/procaspase-10, and cellular FLICE-inhibitory protein (c-FLIP) (Ashkenazi & Dixit, 1998). Normally caspase-8 levels are lower and the proapoptotic signals need to be amplified by caspase-8 mediated cleavage of the Bcl-2 family member Bid. Truncated (tBid) activates the intrinsic signaling pathway and results in release of cytochrome c from mitochondria (Esposti, 2002). Intrinsic apoptotic signaling occurs in response to a wide variety of stimuli or cellular stresses such as DNA damage and cytokine deprivation or in response to chemotherapeutic agents. Three interacting subgroups of proteins from the Bcl-2 family control the intrinsic signaling pathway at the mitochondrial membrane (Chao & Korsmeyer, 1998). The first group consists of the antiapoptotic Bcl-2 proteins. Members of this subgroup share four conserved Bcl-2 homologous (BH) domains and are essential for cell survival; the multi-BH domain pro-apoptotic subfamily members Bax, Bak, and Bok are critical for the effector phase of apoptosis. Once activated, Bax and Bak mediate mitochondrial outer membrane permeabilization (MOMP) (Reed, 2006). Mitochondrial outer membrane permeabilization results in the release of a variety of apoptogenic molecules, the most important of which is cytochrome c (Ow et al., 2008), that binds to the apoptotic protease activating factor (Apaf1), promoting its oligomerization and the recruitment of the initiator procaspase-9 to form the apoptosome. Active caspase within the apoptosome then promotes efficient activation of the downstream caspases 3 and 7 that are responsible for the execution phase of apoptosis (Verjans et al., 2018).
Figure 6. The binding of a death ligand to the death receptor initiates the extrinsic pathway and results in activation of
the death-inducing signaling complex (DISC). Caspase-8 then either directly activates the downstream caspase (type I cells) or needs an amplification step (type II cells) via cleavage of Bid. Intrinsic apoptotic signaling occurs in response to physiological signals or cellular stresses such as DNA damage. Upon activation, the balance between antiapoptotic and proapoptotic Bcl-2 members on the mitochondrial membrane shifts and results in outer mitochondrial membrane permeabilization and cytochrome c release. Bcl-2 family members targeted by HIF are highlighted in red. Cytosolic cytochrome c binds to the apoptotic caspase activating factor (Apaf1) and recruits procaspase-9 to form the apoptosome. Activated caspase-9 within the apoptosome can then promote activation of downstream caspases. (Figure from (Sendoel & Hengartner, 2014)).
2.
Aim of the thesis
The aim of the thesis is to develop a method to study the mechanical properties of the cell membrane and to define the molecular basis responsible for the changes of the mechanical properties of the Human Embryonic Kidney (HEK293) cell-line, induced by a cellular stress. For this purpose, the following steps were undertaken:
i) development of a system capable of studying the mechanical properties of adherent cells. The setup used is the Dual Laser Optical Tweezes (DLOT). DLOT is a method able to extend measurements to the non-linear regime of cell mechanical behavior. With this method, the local deformation of a cell, in adherent state, can be used to discover how the structural plasticity of cells is linked to the elastic property.
ii) study the global mechanical properties of cells after bringing them in suspension. For this purpose, Real-Time Deformability Cytometry (RT-DC) was used. RT-DC probes cells stiffness at high throughput by exposing cells to a shear flow in a microfluidic channel, allowing mechanical phenotyping based on single-cell deformability. The flow cytometry arrangement combined with the real-time analysis of the cell shape allows a non-destructive and continuous measurement at high rates up to 1000 cells per second (a 10000-fold improvement over other methods addressing cellular mechanics).
iii) investigation of the mechanical properties of HEK293 under hypoxia. Hypoxia is used as metabolic stress to induce modifications in cellular matrix and membrane stiffness (Vogler et al., 2013). Adaptation to lowering oxygen levels (hypoxia) requires coordinated downregulation of metabolic demand and supply to prevent a mismatch in ATP utilization and production that might culminate in a bioenergetic collapse (Wheaton & Chandel, 2011).
iv) analysis of the correlation between oxygen deprivation and the development of apoptotic and necrotic state in cells, combining the RT-DC with a fluorescent extension RT-FDC, by measuring the time dependence of the mechanical properties and their relative membrane stiffness and cell size of viable, apoptotic and necrotic cells under 1% of oxygen incubation.
v) description at the molecular level how the cytoskeleton reacts to hypoxic stress at different time-points following hypoxia. The correlation between oxygen deprivation and the increase in primary cytoskeletal monomeric proteins (actin, vinculin, tubulin and talin) was investigated using western blot analysis.
3.
Material and Methods
3.1 Dual Laser Optical Tweezers setup
In order to probe the effect of a local perturbation in the mechanical properties of HEK293 cells a Double Laser Optical Tweezers (DLOT) apparatus (Fig. 7) (Smith et al., 1996) was used. A standard single laser tweezers (OT) is composed by a highly focused laser beam creating an optical trap, in
which samples and biological specimencan be trapped and manipulated (Neuman & Block, 2004).
This optical trap is equivalent to a restoring force, i.e., a simple spring, which follows the Hooke’s law. By knowing the spring stiffness, forces with pN resolution can be measured (Emiliani et al., 2005). OTs are capable of manipulating nanometer and micron-sized dielectric particles with a very
high precision and have been used to study single molecules(Bustamante et al., 2011). The dynamic
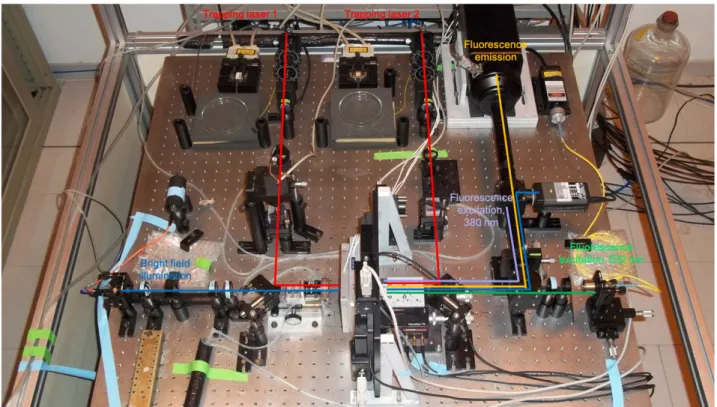
force range of an OT is limited to a few tens pN and this prevents its application for studying all molecular and intermolecular functions that occur at forces > 50 pN. The DLOT has the adequate dynamic range of 0-250 pN (resolution ~ 0.3 pN) in force and, in combination with a 3-way piezoelectric nanopositioner (nano-PDQ375, Mad City Lab, Madison WI, USA) with a dynamic range of 0-75000 nm (resolution < 1 nm) in length, becomes the best candidate to probe the effect of a local perturbation on the mechanical properties of cells. In the DLOT, two counter-propagating diode lasers (250 mW, 808 nm, Lumics GmbH, Germany) are focused to form a single optical trap in the flow chamber (Bianco et al., 2011). The two laser beams have orthogonal polarizations, which allow their optical paths to be separated using polarizing beam splitters and are focused through two water-immersion objective lenses (Olympus, UPLSAPO 60XW, NA 1.20) facing each other. The light exiting from each of the two objectives is projected on two position-sensitive detectors (PSD), which monitor the XY force components acting on the trapped bead. The force is measured based on the conservation of light momentum (Smith et al., 2003) so that the measurements are insensitive to the size of the trapped object, to the distance from the surface, to the shape and furthermore to a non-uniform refractive index.
Bright field images of the bead and cell, illuminated with a blue LED (470 nm, Fig. 7, cyan line), were detected using a 3/4 inches CCD camera (Bitron VIDEO). Two different excitation pathways were implemented on the setup, wavelength 380 and 530 nm, for epifluorescence detection of actin filaments.
Instrument control and data acquisition were accomplished with two National Instruments boards and custom-written LabVIEW algorithms: a PCI 6030E board with an upper frequency limit of 100 kS/s for signal generation and data acquisition and a PCI 6703 board to align the lasers and to modulate the pressure in the flow cell by controlling solenoid valves.
Figure 7. Image of the DLOT setup. The continuous lines represent the optical paths of the DLOT: red, optical line of
the two infrared lasers (808 nm) that generate the optical tweezers; cyan, optical line of the bright field illumination (470 nm); green: optical path of the green laser used for the excitation of the fluorophore on actin (532 nm); lilac line,
380 nm is generated by a led and excitation filters selective for the Ca2+ sensitive dye; yellow: optical path for the
fluorophore emission (from 510 to 580 nm applying selective fluorescence filters) is collected with a fluorescent
camera (ICCD, Princeton Instruments) with ca 300 nm spatial resolution at 20 frames/s at full range.
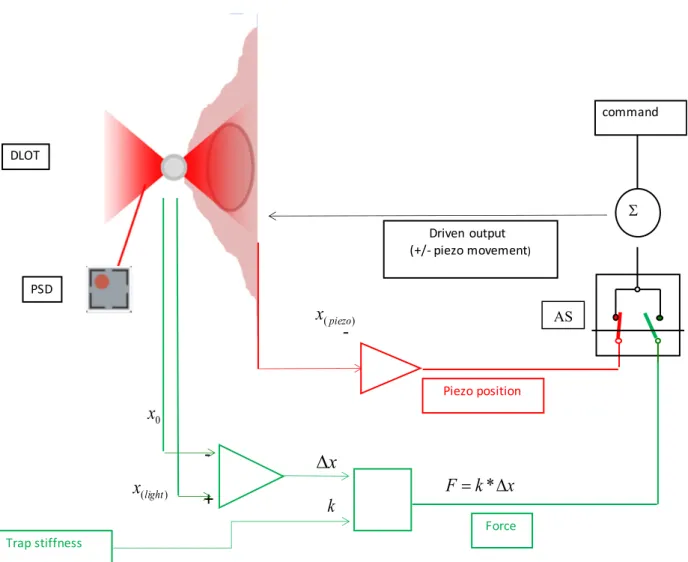
The basic system has been further implemented with a temperature control (range 4-40°C) of the flow cell (Mao et al., 2005; Bongini et al., 2014) and the possibility to switch the control from position clamp to force clamp (Bianco et al., 2011, 2014) by rapid switch of the feedback signal from the piezoelectric nanopositioner output (position signal) to the trapped bead position (force signal) (Fig. 8). The frequency response of the system is limited by the rise time of the piezo-stage movement (tr, measured from 10% to 90% of the step). tr has been minimized to » 2 ms by testing the performance of the system in experiments dedicated to the definition of the load dependence of DNA overstretching and reannealing (Bianco et al., 2011; Bongini et al., 2016).
Figure 8. Block diagram of the electronic circuit that allows mechanical perturbations in either position or force
feedback. The analogue switch (AS) selects the signal that feeds the summing amplifier (Σ) to be compared with the
command (black): either the position of the nanopositioner (xpiezo) carrying the support for cells (position feedback,
red) or the force (force feedback, green). Force is calculated as the product of the stiffness of the trap k times the change
in the position of the bead (Δxbead) calculated from the change in light momentum (xlight) of the dual laser (red cones),
relative to that at zero force (x0).
3.2
Force calibration
The force was recorded by the position of the trapped bead, measured by the change in the light momentum with a precision of ~ 0.3 pN. The force calibration was made by determining the trap stiffness in response to known forces of viscous or thermal nature. The calibration was done on a bead with appropriately sized and at the typical coverslip-bead working distance. In order to increase the accuracy, the calibration has to be done using either viscous drag (1) or thermal noise (2), as follows: DLOT Driven output (+/- piezo movement) ) ( piezo x S x D command x k F= *D k Trap stiffness
-+
-Piezo position 0 x ) (light x Force PSD ASinvolves the movement of the entire block of fluid surrounding the trapped bead, the bead is exposed to a preset viscous drag force:
Fv = γ v = 6π η R v Eq. 1
(2) Trap stiffness (k) can be calibrated by measuring the Brownian motion of the trapped bead: a bead captured in an optical trap experiences random forces due to thermal fluctuations. k can be directly obtained by Fourier analysis of the fluctuations of the trapped bead position, and is:
k = 2π γ fc Eq. 2
where fc is the corner frequency, corresponding to the frequency above which the system fails to respond, and the position fluctuation is attenuated.
3.3 Flow chamber devised to grow the HEK293 cells for DLOT mechanics
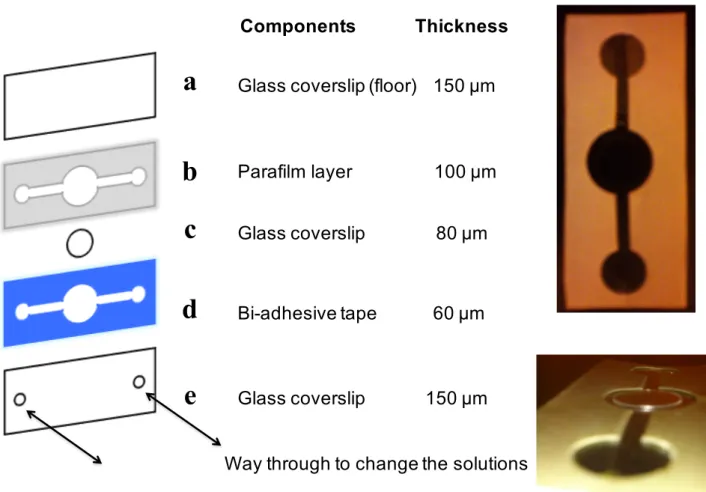
HEK293 cells are cultured, with the adequate confluency, on poly-lysine and laminin coated glasses fixed with optical glue to the floor of a specifically devised flow chamber (Fig. 9c) that is then positioned between the DLOT objectives. The chamber is carried by a closed-loop XYZ piezoelectric stage that controls the position with required temporal and spatial resolution. The polystyrene bead (2 µm in diameter) used for the mechanical stimulus is trapped in the focus of the two lasers. The tens millimeter movement necessary to navigate through the HEK293 population is achieved by mounting the piezoelectric stage on an automated XY micro positioner. The flow chamber allows each HEK293 to be mechanically characterized for its stress-strain relation both elastic and viscoelastic (which would underlie cytoskeleton plasticity).
Figure 9. Schematic representation of the flow chamber. a. Glass coverslip used for the bottom of the flow chamber
(150 µm). b. Hand-cut parafilm layer c. Round glass coverslip (80 µm) used to seed cells in presence of complete medium. d. Bi-adhesive tape (60 µm) used to seal drilled glass coverslip with the remaining part of the chamber. e. Glass coverslip with two drilled holes to flow in and out the medium.
Glass coverslip (floor) 150 μm
Parafilm layer 100 μm Glass coverslip 80 μm
Bi-adhesive tape 60 μm
Glass coverslip 150 μm Way through to change the solutions
Components Thickness
a
b
c
d
e
3.4 Membrane tether formation, elongation and imaging using the DLOT
HEK293 cell that was firmly attached to the bottom of the dedicate experimental chamber was brought into contact with an optically trapped bead by moving the nano-positioner. After 5-10 seconds contact time, the bead was moved away from the cell contour at different rates from 0.25 to 2 μm/s to form the plasma membrane tether. Once a tether was formed, the system was switched in force feedback and the nano-positioner moved to keep the preset force value stretching the tether. Two mechanical protocols (see results chapter for a detailed description) to study the mechanical property of tether formation and elongation were used. Once tether forces reached their equilibrium values, tethers were illuminated in bright-field, and imaged by the CCD camera. Multiple (10-20 frames) images of the same tether were averaged, and then the background image was subtracted from the final averaged image to eliminate background noise. The background image was an image of the field of view without the cell and trapped bead. ImageJ software (1.8.0_172p, National Institute of Health, USA) was used for image processing including image averaging, background subtraction and to estimate the tether diameter using a camera calibration in both axes (x and y). For the camera calibration a movement of micropipette integral within the flow chamber guided by the nano-positioner in closed-loop condition was followed. The calibration yielded 150 pixels for 10 μm of movement in both directions.
3.5
Indentation using the DLOT
Cell indentation is produced by moving the cell support against the trapped bead in the direction perpendicular to the laser axis. Following contact occurrence, the bead resists cell advancement, producing an indentation of the cell. Before the contact between the cell and the bead, the PSD signal (in Fig. 8) D0 is constant, since the bead is trapped by the laser beam at its center, and the only force
applied on the bead is that due to Brownian motion, which is very small and can be neglected. Once the cell gets into contact with the trapped bead, the bead is displaced, and the PSD signal changes to D. Displacements were quantified using the following equations:
ℎ = 𝑍 − 𝑑 𝐸𝑞. 3 𝑑 = 𝐴(𝐷 − 𝐷!) 𝐸𝑞. 4 𝐹 = 𝑘𝑑 = 𝑘𝐴(𝐷 − 𝐷!) 𝐸𝑞. 5
Figure 10. Schematic representation of cell
indentation by optical tweezers. The force of the bead on the x-y plane perpendicular to the laser beam is monitored by a PSD as shown, from the linear relation of the force and the displacement also the position of the bead time by time can be measured. (Figure from (Zhou et al., 2014))
3.6
Real-Time Deformability Cytometry experimental chip and setup
In real-time deformability cytometry (RT-DC) cells in suspension are flowed through a microfluidic channel constriction and deformed without contact by shear stresses and pressure gradients. RT-DC is based on AcCellerator (Zellmechanik Dresden, Germany) that is a high-speed imaging cytometer.
The microfluidic chip is made of polydimethylsiloxane (PDMS; Sylgard 184, VWR) using standard soft-lithography methods (Otto et al., 2015). The microfluidic chip has two reservoirs connected by a 300-μm-long narrow channel (constriction) with a 20 μm × 20 μm, 30 μm × 30 µm or 40 μm × 40 μm square cross-section depending on maximum cell size. Cell size should be between 50% and 90% of the channel size so that shear gradients are large.
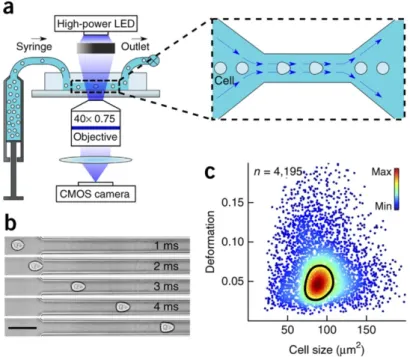
After fabrication, the chip is assembled on the xy stage of an Axiovert 200M inverted microscope (Zeiss) and connected to a syringe pump (NemeSyS, Cetoni) for driving a cell suspension through the channel (Fig. 11a inset). In the experiments a range of flow rate between 0.02 μl/s and 0.2 μl/s can be applied. A sheath flow geometry centers the cells laterally, and lift forces center them vertically within the channel, so that they are always in focus. The velocity vs. cell-size distribution is measured experimentally and can be described theoretically (see analytical model section). For a flow rate of 0.04 μl/s and a cell diameter of 15 μm, the final cell velocity inside a 30 μm × 30 μm channel is approximately 15 cm/s.
The deformed cell inside the constriction is illuminated by a LED that operates with pulse duration of 1 μs and the cell velocity is 15 cm/s, the motion blurring is reduced to about 0.15 μm.
can operate at more than 500 frames per second (f.p.s.). For a reduced region of interest (ROI), acquisition rates of up to 100000 f.p.s. can be achieved. The camera typically run at 4000 f.p.s. with a ROI of 250 × 80 pixels. All image processing steps are carried out using a standard six-core PC. The custom-written program (ShapeIn, Zellmechanick) is capable of performing image acquisition, image analysis and data storage for several hundred cells per second in real-time. The limit of the real-time analysis is due only to the number of available cells (Mietke et al., 2015; Otto et al., 2015).
Figure 11. a. Setup and measurement principle (inset shows top view of constriction). b. Time series of a cell deformed
through constriction. Scale bar, 50 μm. c. Scatter plot of deformation versus cell size (cross-sectional area) of 4,195 cells (dots) obtained in 45 s. Color indicates a linear density scale; black line, 50%-density contour. No cells were
smaller than 20 μm2. (Figure from (Otto et al., 2015))
3.7
RT-DC image analysis
From the contour the algorithm derives the cell cross-sectional area, perimeter and position and calculates the circularity c, which is the main quantity used to characterize the deformation of cells. The circularity is defined as
𝑐 =2√𝜋𝐴
3.8
RT-DC Analytical model
The analytical model, developed by Mietke A (Mietke et al., 2015), allows the calculation of the flow profile around a spherical object moving in a cylindrical microfluidic channel. It derives the hydrodynamic stresses on the object surface and quantifies its deformation on the basis of linear-elasticity theory. Applying this analytical model to RT-DC data, the relationship between cell size– dependent stress, deformation and elastic material parameters is disentangled.
The Reynolds number is the ratio of inertial forces to viscous forces within a fluid which is
subjected to relative internal movement due to different fluid velocities. This relative movement generates fluid friction, which is a factor in developing turbulent flow. Counteracting this effect is the viscosity of the fluid, which tends to inhibit turbulence. The Reynolds number quantifies the relative importance of these two types of forces for given flow conditions, and is a guide to when turbulent flow will occur in a particular situation (Falkovich, 2011).
With respect to laminar and turbulent flow regimes:
• laminar flow occurs at low Reynolds numbers << 1000, where viscous forces are dominant, and is characterized by smooth, constant fluid motion.
• turbulent flow occurs at high Reynolds numbers and is dominated by inertial forces, which tend to produce chaotic eddies, vortices and other flow instabilities.
The Reynolds number is defined as (Rott, 1990): 𝑅𝑒 = r𝑢𝐿
µ =
𝑢𝐿
𝑣 𝐸𝑞. 7 Where:
• ρ is the density of the fluid (kg/m3)
• u is the flow speed (m/s)
• L is a characteristic linear dimension (m) (see the below sections of this article for examples)
• µ is the dynamic viscosity of the fluid (Pa·s)
• ν is the kinematic viscosity of the fluid (m2/s).
RT-DC operates at Reynolds numbers below 0.1, which allow neglecting the inertial terms in the Navier-Stokes equation (Mietke et al., 2015).
The hydrodynamic stresses applied with the RT-DC setup are calculated in two steps. First, a closed solution to the Stokes equation for a sphere advected in a cylindrical channel(Haberman & Sayre, 1958)is employed to extract steady-state flow profiles, velocities of the sphere and sphere size–
channel walls, which holds the cell back (Fs < 0). Although cells are moving without net force in
steady state (Fp + Fs = 0), the anisotropy of the surface stresses leads to the observed bullet-like
deformations. Values of peak shear and normal stresses, and hence deformations, depend on the cell size relative to the channel dimensions.
To disentangle the relation between cell size–dependent hydrodynamic stress and resulting deformations, an analytical model that calculates deformations of an elastic sphere under the hydrodynamic load present in the RT-DC setup is employed. The form of this general deformation solution and the hydrodynamic stress permit the derivation of the resulting deformations analytically by using the latter as boundary conditions for the deformation problem. In the deformation vs. area scatter-plot representation, a cell population that varies only in size but is homogeneous in its elastic properties would cover a path that is approximated by isoelasticity lines derived from the analytical model (Fig. 12b). Calculation of those isoelasticity lines is done by fixing the elastic modulus in the model and increasing the sphere radius while leaving all experimental parameters constant. Eventually area and deformation are derived from the resulting theoretical shapes.
To apply comparable stresses in microfluidic channels of different dimensions (for example, side length L and L′ of two different cross-sectional channel areas), the flow rate has to be changed by a factor of (L′/L)3, which follows from simple scaling arguments.
Figure 12. a. Shear stress (left) and pressure (right) on the cell surface inside the constriction. Black arrows indicate
stress directions; surface color indicates magnitude; blue lines show the flow profile in a co-moving reference frame.
b. Isoelasticity lines divide the size-deformation scatter plots into areas of identical stiffness for multiples of a given
elastic modulus E0. (Figure from (Otto et al., 2015))
3.9
Real-Time Fluorescence Deformability Cytometry
FDC (Fig. 13), developed by P. Rosendahl (Rosendahl et al., 2018), is an extension of
RT-b
methylcellulose solution Cell Carrier A (CCA, Zellmechanik Dresden,Germany). A flow rate of 0.16 µL/s was maintained consistently for taking all the measurements.
For fluorescence excitation, three solid-state lasers (OBIS 488-nm LS 60 mW; OBIS 561-nm LS 50 mW; OBIS 640-nm LX 40 mW; Coherent Deutschland) in combination with adjustable mounted dichroic mirrors (561-594R, 473-491R, and 1064R; Semrock) create a combined beam. The beam is expanded and collimated by two achromatic lenses (AC080-010-A-ML and AC254-040-A-ML; Thorlabs) and then focused to a sheet in the image plane of the microscope with a cylindrical lens (LJ1695RM-A; Thorlabs). Excitation light is coupled into the microscope (Axio Observer.Z1; Carl Zeiss Microscopy) through the modified backport for epifluorescence illumination. Below the 40× objective (EC Plan-NEOFLUAR 40×/0.75-NA (numerical aperture); Carl Zeiss Microscopy), a QuadLine beam splitter (zt405/488/561/640rpc; Chroma Technology) reflects excitation light toward the specimen but transmits light emitted by the sample to the detector assembly. A second beam splitter (zt 473 RDCXT; Chroma Technology) separates light from the LED illumination with 460 nm to the CMOS (complementary metal-oxide semiconductor) camera (MC1365; Mikrotron) for bright-field imaging. The collimated beam is separated into three fluorescence channels FL-1 (FF555-Di03, FF03-525/50; Semrock), FL-2 (zt 633 RDC, Chroma Technology Corp; FF01-593/46, Semrock), and FL-3 (700/75 ET; Chroma Technology Corp) and finally focused (LA1951-A-ML; Thorlabs) on the three avalanche photodiode detectors (MiniSM10035; SensL Corporate).
Figure 13. Experimental setup. Cells are pumped through a microfluidic channel and imaged by bright-field
3.10
Analysis of RT-FDC results
The data was analyzed by the ShapeOut software (version 1.0.1, www.zellmechanik.com) which uses linear mixed models for statistical analysis of each cell measurement taken for n = 6 data sets. The Area Ratio filter of 1.05 was applied. The area ratio is defined as the difference in the ratio between the actual cell area and the convex hull to exclude the events where the event contour diverges more than 95% form the convex hull area. A general area range filter of 120 - 600 µm was applied to exclude the cells debris (< 120 µm) and cells clustering (> 600 µm).
3.11
Western Blot to detect specific proteins in the cells
To analyze the total monomeric actin, tubulin, vinculin and talin levels, the cells were exposed to different time intervals of oxygen deprivation (0h, 6h, 12h, 18h, 24h, 48h). Protein lysates were prepared by adding 300µl of 1x PIERCE IP protein lysis buffer (Thermo Fisher Scientific) with protease inhibitor (Thermo Fisher Scientific). Sample buffer and reducing agent (dithiothreitol, DTT) were added to the lysate and kept at 70 °C for 5 minutes. The total protein concentration was determined by the Bicinchoninic acid (BCA) assay. Samples with 8 µg of protein were loaded on to 4-12 % tris–glycine gel (PAGE- Invitrogen) and electroblotted to one nitrocellulose membrane using a semi-dry system (Biorad), stained for Ponceau S as a control for the totality of general proteins and imaged. Ponceau S stain is useful to locate and identify the proteins transferred electrophoretically onto nitrocellulose membranes before the antibody-mediated detection as the dye does not interfere with antibody detection in Western blots.
After washing to remove Ponceau S, the blot was subsequently blocked with 3% BSA, pH 7.4, for 1 hour. The membrane was incubated overnight and at 4 oC in the presence of primary monoclonal
antibodies (1:2000 dilution) against rabbit-β-Actin (Cell Signaling Technology, #4970S, clone: 13E5), rabbit-α/β-Tubulin (Cell Signaling Technology, #2148S), mouse-Vinculin (Boster, #MA1103, clone: hVIN-1) and mouse-Talin-I (BioRad, # MCA770, clone: 97H6). The membrane was subsequently washed three times with 1× TBST with gentle shaking for 5 minutes each and incubated for 1 hour with diluted (1:20000) secondary antibody conjugated with horseradish peroxidase at room temperature. The membrane was then washed as described above and visualized with the chemiluminescence reagent SuperSignal west Pico PLUS (Thermo Fisher Scientific). Analysis of total protein per lane was done by using the Image-J software (Schindelin et al., 2012) and the sample data, stained with the proper antibody, was normalized using Ponceau S-stained lane to the totality of general proteins. The data plotting and statistical analysis was performed using Igor Pro 8 StatsTTest (Wavemetrics).
293 comes from the fact that it was Frank Graham’s 293rd experiment. These cells were initially thought to originate from an endothelial, epithelial, or fibroblastic cell from the fetal kidney. However, the cellular characteristics of HEK293 cells has led to the suggestion that they may actually originate from a neuronal fetal kidney cell (Shaw et al., 2002). It has also been identified that these cells have a very complicated karyotype, with multiple copies of chromosomes (Lin et al., 2014). HEK293 cells are frequently utilized in research because they are easy to grow and to maintain.
Several HEK293 cell lines have been adapted to high-density suspension growth in serum-free medium (Garnier et al., 1994), enabling large-scale cultivation and bioproduction in bioreactors (Schwarz et al., 2020).
There are many advantages of using HEK293 cells such as they are a semi-adherent, low-maintenance cell line and divide rapidly, doubling about every 36 hours. They can be used for both transient and stable expression, be cultured in suspension or as a monolayer, are easy to transfect (and can be transfected via a variety of methods) and are able to produce large amounts of recombinant proteins. Because of their advantages and versatility, they are the second most widely used cell line after HeLa, the first ever human cell line. HEK293 cells are used in cancer research, vaccine development, protein production, signal transduction, protein interaction studies, drug testing and receptor deorphanization.
Cells were cultured in a Dulbecco's Modified Eagle Medium (DMEM) high glucose medium (BioWest) with 10% Fetal Calf Serum (FCS, Gibco) and 2 mM L- Glutamine (BioWest) and incubated in a humidified atmosphere at 37 oC, 5% CO
2.
The cells were cultured:
i) for DLOT experiments for 24h to reach confluence of ~50% to avoid that the cells overcrowd the flow-chamber coverglass,
ii) for RT-Dc experiments 48h to reach the desired confluency of 70%.
For the RT-DC experiments, the cells were detached from a T-75 flask using 2 mL of trypsin EDTA 1× (BioWest) for 5 minutes, followed by the addition of 2 mL of DMEM high glucose (BioWest) and centrifuged at 200×g for 5 minutes. The pellet was resuspended in 5 mL of DMEM high glucose (BioWest). Cell viability (typically ~95%) was assessed using a trypan blue exclusion test before splitting into a fresh batch.
For hypoxic treatment, cells were maintained in an incubator with the atmosphere set to 1% O2,
5% CO2 and balanced with N2 at 37 °C for 6h, 12h, 18h, 24h and 48h. During the hypoxia incubation
medium changing was avoided to prevent a possible variation in O2 %. The T-75 flasks were taken
out from the incubator only to perform experiments with RT-DC.
One of the effects of the hypoxic treatment is the increased number of cells undergoing apoptosis and/or necrosis, that were examined through specific fluorophores.
Labeling of apoptotic cells: To detect cells in apoptotic state a fluorogenic substrate
CellEvent™ caspase-3/7 green detection reagent (Thermo Fisher Scientific) was used. CellEvent Caspase-3/7 Green Detection Reagent is a four-amino acid peptide (DEVD) conjugated to a nucleic
For each sample, CellEvent™ caspase-3/7 was added directly to the culturing medium to obtain a final concentration of 4 µM with 30 min of incubation time. The fluorophore excitation peak wavelength is 503 nm and the fluorescence emission peak of the dye when bound to DNA is 530 nm.
Labeling of Necrotic cells: To detect cells in necrotic state Propidium Iodide (PI, BD
Biosciences) was used. PI is a fluorescent dye that stains DNA of late-stage apoptotic cells or dead cells since the plasma membrane is not permeable to PI. PI was added directly to the culturing medium to obtain a final concentration of 75 nM with 30 min of incubation time and measured without the washing step. Both the dye excitation peak wavelength is 530 nm and fluorescence emission peak is 588 nm when bound to DNA. Approximately 10 thousand events passing through the channel were recorded for each condition using ShapeIn 2.1 (Zellmechanik Dresden, Germany). To discriminate apoptotic cells also a Fluorescent filter of 100 – 10000 UI was applied, to filter out the not fluorescent and not apoptotic cells measured with 488 nm laser & 525/50 detector.
To discriminate necrotic cells a fluorescent filter of 55 – 10000 UI was applied, to filter out not fluorescent and not necrotic cells measured with 561 nm laser & 593/46 detector.
The results were plotted using Igor Pro 8 (Wavemetrics).
Area Ratio filter Area Range (µm) Apoptotic Fluorescence
intensity range (UI) Necrotic Fluorescence intensity range (UI)
1.05 120 - 600 100 - 10000 55 - 10000
Table 1: Filters applied to the cells analyzed with RT-FDC. The first two filters (area ratio and area range filters) were
applied to analyze the mechanical properties of the cell population. To discriminate the apoptotic subpopulations 3 filters were applied (area ratio, area range and apoptotic fluorescence intensity range) and 3 filters (area ratio, area range and necrotic fluorescence intensity range) were applied for the discrimination of the necrotic subpopulations.
4.
Results and Discussions
4.1
Cell mechanical properties studied with the
DLOT
4.1.1 Dynamics of tether elongation
The mechanical properties of cell membranes have been investigated by using laser-trapped beads to separate the membrane from the cytoskeleton and deform it (Li et al., 2002). Experiments were performed in force feedback and the elongation of tether was the dependent variable. Provided to have the adequate time resolution, a force step perturbation is the most powerful tool to investigate the structural dynamics of molecular and intermolecular processes because, following the step, the force is kept constant so that the length response of the system is directly recording the transformation triggered by the step under a constant potential energy landscape (Bianco et al., 2014; Rivas-Pardo et al., 2016).
All experiments were performed in complete-DMEM at 37°C. O2 was continuously bubbled in
the solution and perfused in the experimental chamber to avoid any change in pH and hypoxic-stress. Once the optically trapped bead entered in contact with the cell (Fig. 14a) and the tether was formed, the cell was moved away from the bead and the tether elongated (Fig. 14b red box). During tether elongation, the membrane detached from the underlying cytoskeleton and formed a long, thin, cylindrical membrane tube. A zoom of the tether image is shown in Fig. 14c.