Università degli Studi di Messina
Dipartimento di Scienze Chimiche, Biologiche, Farmaceutiche, ed Ambientali
Dottorato di Ricerca in “Scienze Chimiche” Doctor of Philosophy in “Chemical Sciences”
Supercritical fluid extraction
and chromatography coupled with mass
spectrometry for the analysis of biological and
food samples
Tutor
Prof. Francesco Cacciola
PhD Thesis of
Fabio Salafia
Coordinator Prof.ssa Paola Dugo
Scope of the research work
11 Supercritical fluid
21.1 Properties of supercritical fluids 2
1.2 Supercritical carbon dioxide 7
1.2.1 Characteristics and properties 7
1.2.2 Density 8
1.2.3 Diffusivity 9
1.2.4 Polarity 12
1.2.5 Solvating power 13
1.3 Modifiers 16
1.3.1 Main characteristics of the polar modifiers 16
1.3.2 Solubility of mixtures of binary fluids 18
References 23
2 Supercritical fluid extraction
2.1 Introduction 26
2.2 Sample preparation 27
2.3 Extraction optimization 29
2.3.1 Pressure, temperature and density 30
2.3.2 Modifiers for extraction 31
2.3.3 Flow rate and extraction time 34
2.3.4 Extraction theory for different matrices 36
2.4 Extraction collection 41
2.4.1 Liquid phase collection 41
2.4.2 Solid phase collection 44
3 Supercritical fluid chromatography
3.1 Evolution of the SFC 48
3.2 Chromatographic parameters 50
3.2.1 Retention parameters 50
3.2.2 Chromatographic resolution 52
3.3 Van Deemter equation in SFC 58
3.4 Chromatographic methods 60 3.5 SFC columns 62 3.5.1 Stationary phase 62 3.5.2 Particle size 63 3.6 SFC Detector 68 3.7 Mass Spectrometry 70 3.7.1 Ion sources 70 3.7.2 Analyzers 73 3.7.3 Detector 76 References 78
4 Limonoids
4.1 General characteristics 82 4.2 Pharmacological activities 85 4.3 Analysis of limonoids 87 References 895 Carotenoids and apocarotenoids
5.1 Characteristics of carotenoids and apocarotenoids 92
5.3 Methods of analysis 98
References 100
6 Supercritical fluid chromatography
mass spectrometry for the characterization
of limonoid aglycones in Citrus essential oils
6.1 Introduction 102
6.2 Experimental section 103
6.2.1 Samples and sample preparation 103
6.2.2 SFC-APCI-QqQ MS Analysis 104
6.2.3 Using the MS/MS system 105
6.2.4 SFC-QqQ MS optimization 106
6.2.5 Tentative identification of isobaric compounds 108
6.2.6 Quali/quantitative characterization 112
6.3 Conclusions 115
References 116
7 Extraction and characterization of
carotenoids and apocarotenoids from
microalgae by supercritical fluid system
7.1 Introduction 118
7.2 Experimental section 119
7.2.1 Standards and samples 119
7.2.2 SFE-SFC-MS Instrumentation 120
7.2.3 Configuration of the SFE-SFC system 120
7.2.4 Optimization of the analytical method 121
7.3 Conclusions 128
References 129
8 Characterization of Native Composition
of Orange cv Pera peel with carbon dioxide
extraction and separative system
8.1 Introduction 132
8.2 Experimental section 133
8.2.1 Standard and sample 133
8.2.2 Optimization of the analytical method 134
8.2.3 Results of cv. Pera peel analyze 135
8.3 Conclusions 138
References 139
9 Apocarotenoids profiling in different
Capsicum species by supercritical fluid extraction
and supercritical fluid chromatography
9.1 Introduction 141
9.2 Experimental section 141
9.2.1 Standard and sample 141
9.2.2 Optimization of the analytical method 143
9.2.3 Capsicum species chillies profile 144
9.3 Conclusions 149
10 Online supercritical fluid extraction
supercritical fluid chromatography method
for determination of carotenoids and
apocarotenoids in human blood samples
10.1 Introduction 151
10.2 Experimental section 152
10.2.1 Standards and blood samples 152
10.2.2 SFE-SFC-APCI-MS instrumentation 153
10.2.3 Optimization of the analytical method 154
10.2.4 SFE-SFC-MS intact blood analyses 156
10.3 Conclusions 159
References 161
11 Analysis of human colostrum
for the determination of
carotenoids and apocarotenoids
11.1 Introduction 164
11.2 Experimental section 166
11.2.1 Standards and samples 166
11.2.2 Instrument and analytical conditions 166
11.2.3 Method validation 168
11.2.4 SFE-SFC-MS intact human colostrum analyses 168
11.3 Conclusions 174
1
Scope of the research work
My research work, during my Ph.D. course, was mainly focused on the development of analytical methods based on the use of supercritical carbon dioxide (CO2) for the analysis of food and biological samples.
In particular, the techniques used were: supercritical fluid chromatography coupled to mass spectrometry (SFC-MS) and supercritical fluid extraction online supercritical fluid chromatography coupled to mass spectrometry (SFE-SFC-MS).
Specifically, the use CO2 under supercritical condition, has allowed the
development of green analytical methods, in which the use of organic solvents, both for extraction and separation processes, is drastically reduced.
The on-line SFE-SFC-MS system, has allowed the development of advanced extractive and separative methods potentially applicable in fields clinical, health and food fraud.
Furthermore, the use of a mass spectrometer as a detector allowed to obtain detailed and precise information on the composition of the matrices analyzed for some classes of molecules with fundamental biological activities.
The on-line SFE-SFC-MS it was used for the extraction and detection of carotenoids and it oxidative-cleavage derivates apo-carotenoids determination in food and biological samples.
Moreover, the SFC-MS system was also employed for a detailed elucidation on limonoids in cold-pressed Citrus essential oils.
2
1 Supercritical fluids
1.1 Properties of supercritical fluids
Supercritical fluids (SFs) were discovered already 200 years ago by Charles Cagniard de la Tour, demonstrating in 1822 for the first time the existence of a supercritical state with a series of experiments [1]. The supercritical state is explained with the phase diagram for a pure component such as carbon dioxide (Figure 1.1).
Figure 1.1 Phase diagram for pure carbon dioxide [2].
Three different states of matter (gas, liquid and solid) may be distinguished depending on temperature, and pressure, in fact they are defined and separated by precise curves.
3
Two phases can coexist on these boundary curves while the triple point marks the coexistence of the three commonly known phases: solid, liquid and gas. Moving on the boundary curve gas-liquid the liquid becomes less dense because of thermal expansion, and the gas becomes more dense as the pressure rises, the liquid-gas phase boundary curve ends at the critical point (PC), where the gas phase and liquid phase have
the same density. Above the critical point, liquid and gas exist as one phase (Figure 1.2).
Figure 1.2 In Figure A the line divides liquid and gas phase (meniscus), by
increasing the temperature the meniscus gradually disappears (B and C), in D there is the complete disappearance of the meniscus because the gas and the liquid have
4
The transition from the gaseous or liquid phase to the supercritical phase does not involve a phase transition, therefore it is not a fourth phase of matter.
In Figure 1.1 are present two regions identified as subcritical phases along with the supercritical fluid region. These separations are a source of confusion [3], the supercritical region is formally separate by the subcritical regions, however the apparent boundaries are not phase transitions, only arbitrary definitions [3].
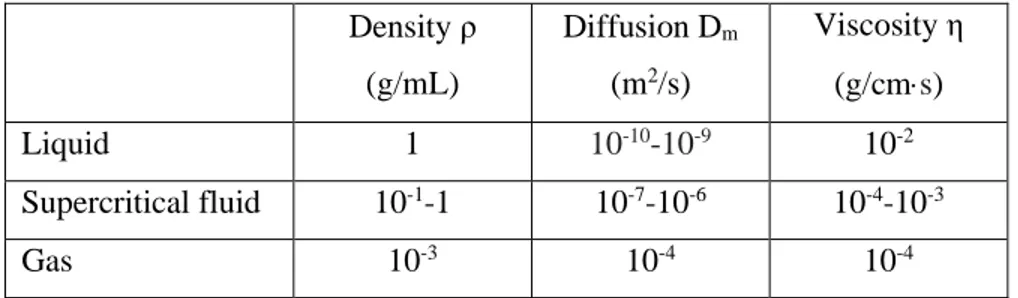
The physical properties of a supercritical fluid vary between those of a gas and those of a liquid by control of pressure and temperature. The SFs are used at densities ranging from 10 to 80% compared to the density of the liquid, using a pressure ranging from 50 to 300 atm. The diffusion coefficients of SFs are similar to those of a gas, whereas their viscosities are typically 10–100 times lower than liquids, these features provide limited pressure drop in the system and faster separation kinetics for chromatographic systems. The density and solvent power of the SFs are comparable to those of liquids, therefore they have excellent capacity of extraction and chromatographic separation; nevertheless they are more compressible than liquids, and that implies their density will severely change with pressure and temperature. The most features of the SFs lies in the fact that its properties are intermediate between those of gases and those of liquids (Table 1.1). By suitably changing the temperature or pressure (or both), it is possible to change the characteristics of the fluid to adapt them, for example, to enhance the solubility of a component of specific interest or to improve the chromatographic separation of a mixture of compounds. For these
5
favorable physical properties the SFs are most used in chromatography and extraction applications [4].
Table 1.1 Properties of supercritical fluids in comparison with liquids and gases.
Density ρ (g/mL) Diffusion Dm (m2/s) Viscosity η (g/cms) Liquid 1 10-10-10-9 10-2 Supercritical fluid 10-1-1 10-7-10-6 10-4-10-3 Gas 10-3 10-4 10-4
In theory, all substances can be transitioned into their supercritical fluid state, but very few are applicable from a practical point of view, because they must have a low molecular weight, a critical temperature close to the ambient temperature (Tc 10-40 ºC) and a not too high critical pressure (Pc 40-60 atm). In Table 1.2 the critical points of some compounds are represented, which have already been utilized as SFs [5].
Supercritical water is being used for the oxidative destruction of toxic waste for its oxidative power in the field of "green chemistry", although its critical parameters are much less convenient than those of other substances. There is a particular interest also in subcritical water because of the behavior of its polarity in these conditions.
Ammonia has similar behavior to that of water, but not often used. Many halocarbons are excellent for extracting short chain hydrocarbons but they have the disadvantage of being very expensive and of being harmful to the environment.
6
Nitrous oxide is excellent for extraction of polar compounds, but its high oxidizing power reduces its use with oxidizable and organic modifying analytes and can also cause violent explosions [6].
Many of the SFs studied are toxic, corrosive and polluting and some are unsuitable for the analysis of thermolabile compounds because they have high critical temperature and critical pressure.
Table 1.2 Critical temperature and pressure of some compounds [6].
Substance Critical Temperature
Tc (K) Critical Pressure Pc (bar) Carbon dioxide 304 74 Water 647 221 Ethane 305 49 Propane 370 42 Ethene 282 50 n-Pentane 470 33 Xenon 290 58 Ammonia 406 114 Nitrous oxide 310 72 Fluoroform 299 49 Chloroform 301 39 Isopropanol 509 47 Methanol 514 79 Ethanol 517 63
7
1.2 Supercritical carbon dioxide
1.2.1 Characteristics and properties
The best mobile phase for supercritical fluid chromatography is CO2.
The critical point of carbon dioxide is 7.38 MPa and 31.1 °C [7], which means that the supercritical state is readily accessible and safe for analysis of bio‐molecular systems, pharmaceutical compounds, and numerous of thermally labile molecules. Moreover, CO2 is safe (low
toxicity, non-inflammable, non-corrosive), inert, easily available at high purity and at a low price finally, it separates easily from the extracted solute because at atmospheric temperature and pressure it is a gas.
CO2 is not a polar molecule but has a significant quadrupolar moment
as it does not have a homogeneous distribution of the electronic density due to the presence of polarized carbon-oxygen bonds. CO2 is therefore
miscible with apolar organic solvents (n-hexane, toluene, etc.) and with polar solvents, even if limited, such as water, alcohols and acetonitrile. Due to the different polarity between the carbon atom and the two oxygen atoms CO2 act both as weak Lewis base and weak Lewis acid,
therefore, it creates conventional and nonconventional hydrogen-bonds [4].
CO2 has interesting affinity for fluorinated compounds as metal
complexes and fluoropolymers, but for polymers and hydrocarbons of high molecular weight it is not such a good solvent [6].
8
1.2.2 Density
A small change in pressure in an SF leads to a large change in density, compared to the same molecule in liquid form, moreover, the closer the temperature and pressure to the critical point the more the density is affected by the pressure. By increasing the temperature of the SF, the system pressure must necessarily be increased to obtain the same density as the fluid.
In table 1.3 are present the density values of CO2 in the supercritical
phase (scCO2).
Table 1.3 Density mg/mL for scCO2 as a function of pressure and temperature [8]. P (MPa) T (○C) 7.4 10 20 30 40 50 60 31 0.42 0.76 0.89 0.94 0.99 1.02 1.04 40 0.23 0.62 0.83 0.91 0.96 0.99 1.02 50 0.19 0.38 0.78 0.88 0.92 0.96 0.99 60 0.17 0.29 0.72 0.83 0.89 0.93 0.97 70 0.16 0.25 0.66 0.78 0.86 0.90 0.94 80 0.15 0.22 0.59 0.74 0.82 0.88 0.92 90 0.14 0.21 0.54 0.70 0.79 0.85 0.89 100 0.13 0.19 0.48 0.66 0.76 0.82 0.87
Density values above 80 g/mL are important for extraction processes with scCO2, especially for lipids because the maximum extraction
capacity for a supercritical fluid is obtained when it has a density similar to the compound to be extracted [9].
In Saitow's work an equation is described to theoretically calculate the density of SFs (equation 1.1) [10].
𝜌 =
6𝜋∙𝜂∙𝜉∙𝜆𝐶9
The equation refers to a spherical fluid system and ρ is the density, η viscosity, ξ correlation length, λC the critical part of thermal
conductivity, kB Boltzmann constant, T temperature and CP specific
heat capacity at constant pressure.
The theoretical values are similar to experimental data when the density increases linearly with pressure, but when the density increases suddenly the data of the equation of state are different from the experimental values. The density prediction with equation of Saitow is more accurate for temperature and pressures values far from PC values.
However, a large number of experimental data for scCO2 have been
collected over time and the density values for certain temperature and pressure conditions are very precise.
1.2.3 Diffusivity
SFs have a high diffusivity and low viscosity, which allows them to have a high mass transfer.
The mass transfer is a key factor in extraction because controlling the kinetics of the process and yields, and in chromatography because affects the separation and resolution of the peaks.
SFs, like all fluids, are subject to self-diffusion (also known as Brownian motion), that is a chaotic diffusion of molecules in the absence of a chemical potential gradient, and binary diffusion (chemical diffusion) that is a no chaotic diffusion of molecules occurring due to a concentration gradient of the compound [11].
Self-diffusion coefficients can be calculated by the Stokes Einstein equation and from variants created by Wilke Chang (equation 1.2) [8].
10
𝐷 =
𝑘𝐵∙𝑇𝐶𝑃∙𝜋∙𝜂∙𝑎
Equation 1.2
The Stokes-Einstein equation correlates the translational diffusion coefficient, D, of a sphere of fluid of radius a, which moves within a solvent system with a dynamic viscosity, η with a temperature T and a specific heat capacity at constant pressure CP.
The binary diffusion of a compound varies with time, for example in the extraction, and can be calculated with the equation of Fick’s second law of diffusion (equation 1.3) [8].
𝜕𝑐
𝜕𝑡
= 𝐷
𝑏∙ ∆
𝑐Equation 1.3
The differential equation correlates the variation in the concentration of a component (∂c) with respect to time (∂t) with the binary diffusion (Db)
with respect to the concentration (∆c).
In literature there are few experimental binary diffusion coefficients due to measurement difficulties.
Experimentally the supercritical CO2 was used to determine the binary
diffusion coefficients of acetone, benzene, naphthalene, 1,3,5-trimethylbenzene, phenanthrene, pyrene and chrysene with the Taylor dispersion method, in which it is measured, through a capillary tube, the dispersion of a solute in a laminar flow.
Increasing the molecular weight and dimensions decreases diffusion coefficients. Molecules with heavy isotopes have shorter bonds and therefore lower molar volumes than molecules with normal isotopes, this is the cause of higher diffusion coefficients [12].
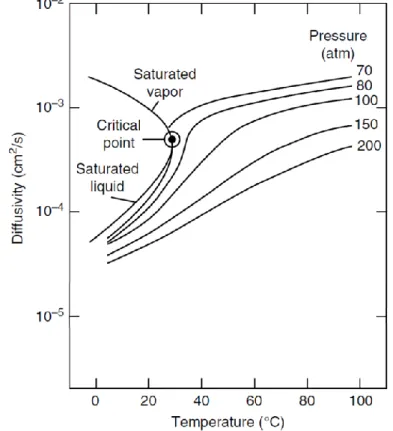
Diffusion coefficients decrease considerably with increasing density and viscosity of the SFs, while effects of temperature are minimal, for
11
example the diffusion coefficients of scCO2 only increase with 10%
when temperature increases from 30 °C to 60 °C. For liquid CO2 there
is an opposite effect, the diffusion coefficient is almost double in the same temperature range (figure 1.3).
With the addition of an organic solvent, the viscosity and density of the mixture increases in comparison with pure scCO2 (using same
conditions of temperature and pressure) and the diffusivity decreases [11].
Figure 1.3 The variation in CO2 diffusivity with respect to the variation in
12
1.2.4 Polarity
Polarity is a property quantifying the dipolar moment of a molecule, it is not influenced by temperature, pressure or passage in the supercritical phase.
CO2 is not polar as it has an overall dipole moment equal to zero, but it
exhibits a significant bond dipole moment due to the different polarity between the carbon atom and the two oxygen atoms, this creates a quadrupolar moment (Figure 1.4). This allows, as already mentioned, the formation of weak hydrogen bonds with polar molecules. This characteristic allows CO2 act both as weak Lewis base and weak Lewis
acid, therefore, it creates conventional and nonconventional hydrogen-bonds [4].
Figure 1.4 Representation of the dipole moment and the quadrupolar moment of the
CO2 [8].
When a cosolvent is used, the intermolecular interactions cause an increase in density and a decrease in the volume of the mixture. When the pressure increases, especially near the critical point, the space between the molecules of solvent and CO2 decreases, which creates a
larger number of hydrogen bonds [13].
Increasing the temperature has the opposite effect, the breaking of the hydrogen bonds cause a decrease in the miscibility of the cosolvent with the scCO2.
13
An example of the dielectric properties of scCO2 is its higher solubility
of water, methanol and ethanol in comparison to carbon monoxide in supercritical state. The explanation for this effect is the hydrogen bonding between the oxygen in CO2 and the hydrogens in the solvents
[14].
1.2.5 Solvating power
The solvating power of SFs are dependent on temperature and pressure. At low pressure, the solvating power decreases with rising temperature, while at high pressures it increases exponentially as shown in figure 1.5 which represents the solubility of naphthalene in scCO2.
1.5 Solubility of naphthalene in scCO2 as a function of temperature at different
14
By correlating the solvent power with the density as the temperature changes, a graph is obtained with a different solubility-temperature relationship (Figure 1.6). By increasing the density of scCO2 the
solvating capacity increases exponentially for any temperature.
1.6 Solubility of naphthalene in scCO2 as a function of density at different
temperatures [4].
This peculiar phenomenon occurs because density and solvating power are directly related, the increase in pressure causes an increase in density and consequences an increase in the solubility of a compound in the supercritical fluid, while an increase in temperature has the opposite effect.
At low pressure, the density decreases drastically with an increase in temperature therefore the solvating power decreases considerably. At higher pressure, changes in temperature have much less effect on
15
density and therefore also on the solvating power. Therefore, the solvating power is related to the density of the supercritical fluid and can be modified through temperature and pressure [4].
This characteristic of SFs is unique because the solvating capacity of liquids and gases does not change significantly, consequently, it can be used to obtain excellent extractions on a large variety of compounds [15].
The first study on solubility of compounds into CO2 was developed by
Giddings et al. [16] based on Hildebrand solubility parameter (δ) [17]. For estimate the solubility parameter of a supercritical fluid Giddings used the following relation (equation 1.4):
δ =1.25∙ 𝑃
𝐶1/2∙ (ρ
f⁄
ρ
l)
Equation 1.4
PC is the critical pressure, and ρf and ρl the reduced density of the
supercritical and the liquid fluid [16]. The δ parameter represents shows the ability for CO2 to dissolve the compounds, and it is determined as
the ratio of the cohesive energy ΔE and the molar volume of the considered compound (δ = cal/cm3).
Liquid CO2 with a density of 1.23g/mL has a solubility value of 10.7
cal/cm3, similar to that of pyridine.
With a density of 0.9 g/mL in supercritical conditions, the solvating capacity is close to that of aromatic compounds such as benzene and toluene.
By decreasing the density of CO2 to 0.6 g/mL, δ approaches that of
16
The theoretical values of solubility of CO2 are generally higher than the
experimental values, therefore the Giddings formula is an approximation of the solvent power of CO2 [18].
1.3 Modifiers
As already mentioned, scCO2 has an excellent solvating power for
non-polar compounds while it has a limited ability to solubilize non-polar compounds. In order to increase the elution strength of the mobile phase, small amounts of a polar solvent, called modifier or co-solvent, is usually added to scCO2.
Most common used modifiers for increase the polarity are isopropanol (IPA), methanol (MeOH), acetonitrile (ACN), and ethanol (EtOH). Small quantities of water can also be added to the scCO2 to increase the
solubility of polar compounds, aliphatic hydrocarbons to decrease the polarity, toluene to insert aromaticity, [R]-2-butanol to obtain a chiral mobile phase, and tributyl phosphate to enhance extraction or separation of metal complexes.
1.3.1 Main characteristics of the polar modifiers
The modifier will change some physicochemical properties of the mobile phase such as the viscosity and dielectric constant, and can generate further interactions such as hydrogen bonding or dipole-dipole, leading to modifications in selectivity of extraction and variation of peaks retention time.
With modifier addition the critical point of the mobile phase will considerably shift because the critical temperature and the critical
17
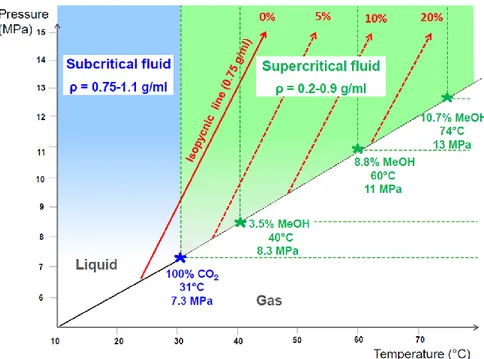
pressure will increase, depending on the percentage and the nature of the modifier added to carbon dioxide, as shown in Figure 1.7 for a series of scCO2 and methanol mixtures. This means that in most of the
extractions and separations with SF, the state of the mobile phase should be defined as “subcritical”, rather than “supercritical”, because with a working temperature typically between 40°C and 60°C, increasing the amount of modifier in the system quickly increases the pressure and temperature values to maintain the supercritical state, if it does not inevitably occur the system switches to a subcritical state [19].
Figure 1.7 Phase diagram for pure carbon dioxide (in blue) and carbon dioxide
mixed with methanol at different proportions (in green) [18].
Conditions as pressures and temperature much below the critical point results in separation of the fluid into two phases, one scCO2 and another
18
When this phenomenon does occur, solubility of the analytes is modified, inducing strong changes in the extraction capacity and of the fluid chromatographic retention, and a noisy baseline is observed for spectrophotometer detectors due to the liquid-gas heterogenous mixture [20]. However, Sandra et al. [21] developed an experiment in which he showed that the increase from 10 to 25% of modifier (MeOH) did not disturb the signal of the evaporative light-scattering detector (ELSD) because the analytes were solubilized in the liquid part of the mobile phase [20].
Such phase separation was never reported for so-called "subcritical" condition with a pressure value above critical pressure but with a temperature lower than the critical temperature. This subcritical condition is however, widely used in chromatography therefore is no need to change the operating temperature and pressure when developing a method in order to necessarily maintain the supercritical conditions. Keeping the back pressure above the critical pressure of the mobile phase composition, the temperature can be maintained below the critical temperature, obtaining a subcritical system.
This operational feature is very important because the high critical temperature in the mixtures of CO2-solvent would be inadequate for
most for most thermolabile compounds analyzed and for chromatographic columns [20].
1.3.2 Solubility of mixtures of binary fluids
Interactions between CO2 and co-solvents are important for evaluating
the chemical-physical properties of the fluid, they have been studied with the help of solvatochromic parameters [22].
19
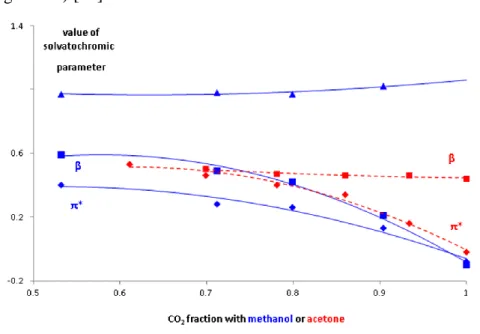
The parameters considered are π* (describing the polarity and polarizability) the α acidity (includes the ability to donate hydrogen bonds with hydrogen atoms), and the β basicity (includes the ability to accept hydrogen bonds with oxygen or nitrogen atoms). These parameters have been calculated with spectroscopic measurements for mixtures of CO2 with methanol and acetone at a temperature of 35 °C
(figure 1.8) [23].
Figure 1.8 Variation of the solvatochromic parameters with respect to the increase
in the percentage of co-solvent determined by spectrophotometer [18].
The increase in the methanol fraction in the binary mixture causes an increase in π* and β of the mixture, while α, which represents acidity, remains constant.
For the CO2-acetone mixture the polarity increases (π*) while the
basicity (β) remains constant, for the acetone the acidity has not been calculated because it has no hydrogens which can form hydrogen bonds.
20
Other studies were performed at different pressures for CO2-alcohols
mixtures. These articles have shown that an increase in pressure causes a decrease in polarity and basicity, this effect is thought to be due to the greater interaction of the CO2 and co-solvent molecules because they
are closer.
The CO2-methanol mixture was studied also from 0 to 100% co-solvent
by a solvatochromic approach at 25°C, the results showed significant increase in the π* polarity and polarizability parameter [18].
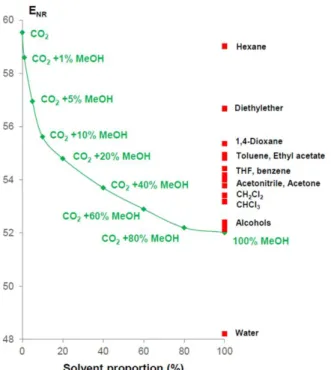
Deye et al. [24] studied the solvation of the binary CO2-methanol
mixture by spectroscopic measurements, using Nile Red dyes with ENR
scale (the ENR scale represents the intensity of the fluorescence of the
Nile Red dye, the higher the polarity the lower the dye fluorescence). Figure 1.9 represents the change in ENR with the percentage of methanol
in the binary mixture.
The solvent power of CO2 mixed with 5% methanol is close to
diethyl-ether, when 10% methanol is used it is similar to 1,4-dioxane, with 20% methanol it compares to ethyl acetate, with 40% methanol it has the solvent power of methylene chloride [18].
21
Figure 1.9 Variation of ENR compared to the percentage of methanol in the mixture
of CO2-methanol and solvents with similar ENR for comparison [18].
Small additions of methanol cause a sharp decrease in the ENR and
therefore large increases in the strength of the solvent. The authors of the study speculated that the dye used is surrounded by a solvation sphere of methanol, called "cluster", which is not equal to composition of the binary mixture. Therefore, the similarities of the solvating powers described above may not be correct as the polarity of the binary mixture is overestimated.
Within a cluster, the concentration of the modifier is higher, creating micro-zones with much greater polarity than the composition of the fluid. Furthermore, in conditions of pressure and temperature close to the critical point, the clustering is more widespread because there is a greater compressibility of the fluid.
22
Therefore, small amounts of a polar modifier can significantly increase the solubility of a polar solute, but they will not affect the solubility of non-polar analytes.
Furthermore, the greater the difference in polarity between the co-solvent and the pure scCO2, the greater the change in polarity when the
modifier is added, but at the same time the lower the quantity of co-solvent that can be mixed with the scCO2 [4].
23
References
[1] B. Berche, M. Henkel, R. Kenna. Critical phenomena: 150 years since Cagniard de la Tour. Rev. Bras. Ens. Fis., 2009, 31 2602.
[2] L. Laboureur, M. Ollero, D. Touboul. Lipidomics by supercritical fluid chromatography. International Journal of Molecular Sciences, 2015, 16, 13868.
[3] T. L. Chester. Unified chromatography from the mobile phase perspective. ACS Symposium Series, 1999, 748, 6.
[4] L. M. Miller, J. D. Pinkston, L. T. Taylor. Modern Supercritical Fluid Chromatography: Carbon Dioxide Containing Mobile Phases. Publisher John Wiley & Sons Inc, 2019.
[5] S. Moret, G. Purcaro, L. S. Conte. Il campione per l’analisi chimica. Publisher Springer-Verlag Mailand, 2014.
[6] A. A. Clifford, J. R. Williams. Introduction to Supercritical Fluids and Their Applications. Publisher Humana Press, 2000.
[7] "Phase change data for Carbon dioxide". National Institute of Standards and Technology. Retrieved, 2008, 01, 21.
[8] F. Pena-Pereira, M. Tobiszewski. The Application of Green Solvents in Separation Processes Chapter 7. Publisher Elsevier, 2017.
[9] J. M. del Valle, J. C. de la Fuente. Supercritical CO2 extraction of oilseeds:
review of kinetic and equilibrium models. Critical Reviews in Food Science and Nutrition, 2007, 46, 131.
[10] K. Saitow, D. Kajiya, K. Nishikawa. Dynamics of Density Fluctuation of Supercritical Fluid Mapped on Phase Diagram. Journal of the American Chemical Society, 2004, 126, 422.
[11] A. D. McNaught, A. Wilkinson. Compendium of chemical terminology The Gold Book, Second Edition. IUPAC, 1997.
[12] G. Jancso. Radiochemistry and nuclear chemistry V l Isotope effects, isotope separation and isotope fractionation. Publishers EOLSS Co. Ltd, Oxford, 2009.
24
[13] D.S. Bulgarevich, T. Sako, T. Sugeta, K. Otake, Y. Takebayashi, C. Kamizawa, M. Uesugi, M. Kato. Microscopic solvent structure of subcritical and supercritical methanol from ultraviolet/visible absorption and fluorescence spectroscopies, Journal of Chemical Physics, 1999, 111, 4239. [14] P. Raveendran, Y. Ikushima, S.L. Wallen. Polar attributes of supercritical carbon dioxide. Accounts of Chemical Research, 2005 37, 478.
[15] L.T. Taylor. Supercritical Fluid Extraction. Wiley Analytical Science Chapter 2, 1996.
[16] J.C. Giddings, M.N. Myers, J.W. King. Dense Gas Chromatography at Pressures to 2000 Atmospheres. Journal of Chromatographic Science 1969, 7, 276.
[17] J.H. Hildebrand, R.L. Scott. The solubility of non-electrolytes. Dover, 3rd ed., 1964.
[18] E. Lesellier, C. West. The many faces of packed column supercritical fluid chromatography-A critical review. Journal of Chromatography A 2015, 1382, 2.
[19] J. D. Pinkston, D. T. Stanton, D. Wen. Elution and preliminary structure‐ retention modeling of polar and ionic substances in supercritical fluid chromatography using volatile ammonium salts as mobile phase additives, 2004, 115.
[20] Supercritical fluids chromatography 1st Edition, Elsevier, 2017.
[21] G. Vanhoenacker, P. Sandra, F. David, A. Pereira, C. Brunelli. A simple instrumental approach for "Supercritical" fluid chromatography in drug discovery and its consequences on coupling with mass spectrometric and light scattering detection. LCGC North America, 2011, 29, 1006.
[22] R. W. Taft, M. J. Kamlet. The solvatochromic comparison method. 2. The alpha-scale of solvent hydrogen-bond donor (HBD) acidities Journal of the American Chemical Society, 1976 98, 2886.
[23] V.T. Wyatt, D. Bush, J. Lu, J.P. Hallett, C.L. Liotta, C.A. Eckert, Determination of solvatochromic solvent parameters for the characterization of gas-expanded liquids. The Journal of Supercritical Fluids, 2005, 36, 16.
25
[24] J.F. Deye, T.A. Berger, A.G. Anderson. Nile Red as a solvatochromic dye for measuring solvent strength in normal liquids and mixtures of normal liquids with supercritical and near critical fluids. Analytical Chemistry, 1990, 62, 615.
26
2 Supercritical fluid extraction
2.1 Introduction
Supercritical CO2 is advantageous to use as a solvent for extractive
processes compared to classic organic solvents because, as already mentioned in chapter 1, it has a low toxicity, is flammable and non-corrosive is also easily available with high purity and low price and it separates easily from the extracted solute because at temperature and atmospheric pressure is a gas.
In addition, the supercritical fluids have intermediate properties between those of a liquid and those of a gas; in particular, they have density like that of a liquid and viscosity like that of a gas.
Therefore, supercritical fluids have a solvent capacity similar to that of traditional solvents but the diffusion of the analyte (mass transfer) from the matrix to the supercritical fluid will be faster.
All this can mean lower solvent consumption and, consequently, lower costs compared to traditional liquid-liquid extractions or through Soxhlet (considering also the costs related to the disposal of solvents). Choosing the correct supercritical fluid, temperature, pressure, and sample collection method is important in order to perform a highly selective extraction of the analyte of interest
The extracts obtained will contain more analytes than those obtained with organic solvents, and them require partial or even no purification after the extraction.
27
Other advantages offered by this technique are the possibility of automation and its applicability in varied sectors (polymers, food, pharmaceutical, environmental). SFE is a valid alternative to traditional extractions, as it limits the consumption of organic solvents, reduces analysis times and can be easily automated [1].
2.2 Sample preparation
A matrix, to be extracted correctly with an SFE system, must be a solid powder with a high surface area and good extraction permeability. The smaller the particles, the greater the surface of the matrix in contact with the supercritical fluid and the shorter the path that the analyte must travel to diffuse into the fluid.
However, particles that are too small cause a reabsorption effect of the analytes on the surface of the particles and the formation of "preferential paths" in the packed system of the matrix. These problems can be solved by increasing the flow and extraction temperature [2]. Döker et. al [3] experimentally demonstrated these phenomena with the extraction yields of ground sesame seed oil, with particles having a diameter of 1180 μm, 600-1180 μm and 300-600 μm with temperature at 50 °C, pressure 350 bar and flow 1.81 g CO2/min (Figure 2.1).
Extractions with 1180 μm particles have lower yields than smaller particles, regardless of time.
Interesting is the exponential increase in yield with the increase in the extraction time of small particles, this effect is determined by the supercritical fluid to penetrate more easily inside the matrix.
28
2.1 Extraction yield of sesame oil over time with different grain sizes of ground
sesame (1180 μm, 600-1180 μm and 300-600 μm) [2].
To obtain a good extraction is necessary to completely fill the container in which the sample is inserted and remove dead volumes that decrease the extraction efficiency and yield.
A powder is used to fill the extraction container and "dilute" the solid sample with which it is mixed.
The powder increases the contact surface of the matrix with the supercritical fluid and fills the empty spaces inside the container to facilitate its extraction.
These powders must be composed of inert materials that do not interact with the analytes of the matrix to be extracted, this characteristic is very important because it could greatly influence the yield of the extract. The liquid matrices, generally, are not analyzed as such but absorbed on a solid porous support or a powder.
29
Matrices with a high percentage of water must be dried or freeze-dried before extraction. While samples containing a small amount of water are mixed with an adsorbent powder containing alumina or magnesium sulfate.
For samples containing negligible amounts of water it is preferable not to use a desiccant adsorbent powder but only a sample dispersion system.
These differences in the treatment of the matrix are due to two opposite phenomena that can occur in the extraction process. Water, in small percentages, acts as a modifier of scCO2 improving the extraction of
molecules with polar groups, without significantly changing the extraction of non-polar molecules.
If the sample has an excessive amount of water, the supercritical fluid does not solubilize it and two phases are formed in the extraction vessel. Excess water solubilizes the more polar compounds and creates a barrier between scCO2 and non-polar compounds [2]
2.3 Extraction optimization
To optimize an extraction process, it is necessary to consider some variables such as: pressure, temperature and density of the supercritical fluid but also flow rate, type and quantity of the modifier. Some parameters are optimized according to pre-established ranges (pressure 150-500 atm, temperature 35-150 °C, flow 1-3mL/min), while the most used modifiers are methanol, ethanol and acetonitrile [3].
30
2.3.1 Pressure, temperature and density
Extraction of an analyte with a supercritical fluid depends on three pressure parameters: miscibility pressure (the solute begins to diffuse into the supercritical fluid), pressure of maximum solubility (in which the maximum solubility of the analyte is obtained) and pressure fractionation (pressure interval between the two previous parameters and which allows to obtain a very selective extraction).
Figure 2.2 represents the extraction yield versus flow for carotenoids and tocopherols in tomato waste at two pressure values (380 bar and 460 bar), with a constant temperature of 60 °C [5].
Fig. 2.2 Extraction yield of tocopherols and carotenoids from tomato waste at
different pressures, 380 bar and 460 bar [5].
The increase of the pressure causes an increase of the supercritical fluid's density, therefore improves its solvent power and therefore increases the extraction yield for all the compounds present in the
31
matrix, however this phenomenon causes a lower extraction selectivity. Generally, for selective extractions a pressure value is used that is within the fractionation pressure range to obtain greater selectivity, while for non-selective extraction processes the pressure value of maximum solubility is preferred. Exceeding this value, no extractive advantage is obtained for the analyte considered [5].
The increase in temperature doesn’t always determine an increase in extractive yields, as for pressure, because it depends on the nature of the analyte and the density of the fluid.
The increase of the temperature causes a decrease of the density of the supercritical fluid and therefore a decrease of its solvent power but also a greater mobility of the molecules that tend to transfer from the matrix to the supercritical fluid more easily, especially the volatile molecules, because their mobility increases [2].
If the pressure is too low, or the temperature too high, the solvent power of the fluid will be very low, it will behave more like a gas than a liquid and the extraction yield will be low. Consequently, the main parameter to be optimized is the pressure, to which the density of the fluid is connected, while the temperature is a secondary parameter due to its difficulty of optimization.
2.3.2 Modifiers for extraction
Extraction with scCO2 is limited to non-polar compounds due to the
specific characteristics of carbon dioxide, described in the previous chapter.
Solvents and additives are used to apply this technique also for the extraction of medium polar compounds. They interact with the polar
32
groups of the molecules present in the matrix, facilitating their diffusion in the supercritical fluid.
The most used compounds for this purpose are organic solvents like methanol ethanol and acetonitrile, and are called modifier.
They can be inserted directly into the extraction cell, before the extraction process or added during the extraction process, using the pumps. This method is the most used because it allows to keep the fluid conditions constant and to have a greater reproducibility of the process. Using polarity modifiers causes an increase in the TC and critical
pressure PC of the fluid. The increase in critical parameters depends on
the nature of the modifier and on the quantity, the greater is polarity and quantity, the greater the PC and TC.
Generally, to maintain the supercritical conditions of the fluid, the modifier must not exceed 8-10% of total flow, higher percentages cause a subcritical phase of the fluid, with percentages higher than 80% we speak of compressed fluids [6].
The modifier used is determined by its ability to solubilize the compound (or class of compounds) but also by its ability to swell the solid matrix to facilitate the penetration of scCO2 to extract the analyte.
Some compounds can be extracted using small percentages of water as the sole co-solvent or together with organic solvents. Water improves the extraction process, but it causes a significant increase in TC and PC,
so the system needs very high pressures and temperatures to keep the system as a single fluid and avoid phase separations.
Some extraction processes are conducted with the use of vegetable oils, this process is used to improve the extraction of very expensive compounds or for food consumption.
33
Table 2.1 Yield of lycopene (µg/g) extracted from tomato peel with pure scCO2 and with three co-solvents (5%) at different temperatures
and pressures [7].
Pressure 25 MPa 30 MPa 35 MPa
Temperature 45 °C 60 °C 75 °C 45 °C 60 °C 75 °C 45 °C 60 °C 75 °C Modifier % - 0 11.0 ± 1.6 13.1 ± 1.0 14.2 ± 1.1 12.2 ± 1.1 14.0 ± 1.1 19.5 ± 2.1 14.7 ± 1.2 15.2 ± 1.1 25.5 ± 1.8 Ethanol 5 34.7 ± 2.0 38.8 ± 2.1 42.6 ± 1.7 35.9 ± 1.4 37.0 ± 1.7 43.1 ± 1.3 37.7 ± 2.2 40.2 ± 2.4 45.3 ± 2.1 Water 5 31.8 ± 1.2 38.5 ± 1.9 41.3 ± 2.2 34.2 ± 1.1 39.3 ± 2.1 43.5 ± 1.1 35.2 ± 1.8 40.5 ± 2.0 42.6 ± 1.4 Oil 5 33.0 ± 1.5 47.3 ± 2.3 52.2 ± 2.1 36.3 ± 1.3 48.2 ± 1.9 55.4 ± 2.3 35.2 ± 2.1 53.3 ± 1.9 60.9 ± 2.3
34
Table 2.1 shows the extraction yields of lycopene in tomato peel with pure scCO2 and with three modifiers at different temperatures and
pressures with a flow of 1 mL/min and an extraction time of 60 minutes. The tests made by Shi et al., for all temperatures and pressures, show an order of yield: olive oil > methanol > water > pure scCO2.
Furthermore, with 35MPa and 75 °C the yield with oil (co-solvent) is 2.4 times greater than yield without modifier [6]. In addition to modifiers, also co-additives can be added to scCO2, they interfere in the
interaction between the analyte to be extracted and the matrix, facilitating the desorption of the analyte. To further improve extractions, they also used reactive co-additives that interact either with the matrix, eliminating the sites of interaction with the analyte, or with the molecule to be extracted, creating a chemical species more soluble in scCO2 [8].
2.3.3 Flow rate and extraction time
The flow rate is a parameter that depends on four factors: matrix-solute interactions, analyte solubility, mass transfer and longitudinal dispersion.
If the solute does not interact with the matrix, the diffusion of the analyte in the supercritical fluid mainly depends on its degree of solubility. High flows cause an increase in yield, as in the case of the extraction of vegetable oils (Onur Döker et al.), because facilitates the mass transfer of the analyte from the matrix to the fluid, avoiding its saturation.
If the solute interacts with the matrix, the most important parameter to consider is the equilibrium of phase. The increase in flow doesn’t cause
35
an increase in yield because the analyte doesn't transfer quickly but remains bound to the matrix.
This phenomenon is characterized by two parameters, the external and the internal mass coefficient. The first represents the transfer of the analyte from the surface of the matrix (in direct contact with the scCO2)
to the fluid, is a fast process, while the second represents the transfer of the analyte from the innermost part of the matrix to the fluid, is a slow process.
Using too low flows of scCO2 causes longitudinal dispersion of the
analyte with a consequent decrease in yield.
Small extraction containers and narrow connecting pipes are widely used to avoid this dispersion phenomenon, although these characteristics depend on the size of the system used.
The extraction time depends on the optimization of the previously described parameters (pressure, temperature, quantity and type of modifier and flow rate), on the nature of the matrix (hardness, ease of penetration of fluids, type of material) and from the pre-treatment that was done (drying, freeze-drying, level of grinding, treatment with filling and dehydrating powders) [9].
The extraction is generally carried out in two phases, static and dynamic, with sometimes different times and flows (Figure 2.3). In the static phase the supercritical fluid and the matrix are in contact in the sealed vessel, in the dynamic phase the supercritical fluid flows through the sample.
In the static extraction phase, the supercritical fluid penetrates inside the matrix, swelling it and causing an initial desorption process of the analyte. In this phase it is not necessary to use high flows while a
36
minimum time is required to impregnate the matrix and induce the initial desorption of the analyte.
In the dynamic step, the fluid flows continuously through the matrix, this allows the easy migration of the analyte towards the fluid because an equilibrium of the phase is not created. In the dynamic phase use of a correct flow rate is important, the optimal extraction time is obtained when the yield doesn’t change by increasing the extraction time [8].
Fig. 2.3 Schematic representation of the extraction steps. Step 1 static extraction (the
fluid in contact with the matrix do not change), step 2 dynamic extraction (the fluid in contact with the matrix changes).
2.3.4 Extraction theory for different matrices
Plant and animal samples, and biological fluids require different pre-treatments (grinding, freeze-drying, drying, dehydration with powders) and specific optimization of the extraction process.
Theoretical models have been developed, obtained with experimental evidence, which facilitate the optimization of extraction processes and scale-up projects.
37
The most used models are “broken and intact cell” (BIC) and “shrinking nucleus” (SC).
In the BIC model (Figure 2.4) the particle of material to be extracted is divided into two parts. The outermost contains cells that are broken due to pre-treatment processes, the extraction fluid penetrates easily, and the solute is extracted quickly because the mass transfer rate is high. The innermost part of the particle consists of intact cells, the fluid penetrates with difficulty and the mass transfer is slow.
The extraction process with the BIC model is characterized by three stages.
• Constant extraction rate: the solute diffuses from the broken cells towards the fluid, with a constant speed which depends on the external diffusion coefficient of the particle (xb). The analyte quickly saturates
the fluid, therefore, the particles in the initial part of the extraction vessel have lost the solute contained in the broken cells but not that in the intact cells, while the particles at the end of the extraction vessel have not completely lost the analyte contained in broken cells.
• Decrease in the extraction rate: the analyte, in broken cells, is completely extracted while the analyte in intact cells migrates outwards, this process occurs slowly and depends on the internal diffusion coefficient of the particle (xi). The extraction rate rapidly decreases to
a constant value.
• Minimum extraction rate: the analyte inside the intact cells migrates totally outside the particle and spreads in the supercritical fluid, this process is very slow. The extraction rate gradually decreases to zero.
38
Fig. 2.4 Representation of the BIC model of a particle. The analyte transfers from
broken cells to the fluid with external diffusion coefficient xb and from intact cells to
broken cells with internal diffusion coefficient xi [9].
The SC model (Figure 2.5) divides the particle into three parts: a film of fluid surrounding the particle, the outer part of the particle (called the shell characterized by channels and pores caused by the sample pre-treatment processes) and the inner part of the particle (called nucleus). The supercritical fluid surrounds the particle creating a film and penetrating the shell through channels and pores. In this phase there is an intra-particle diffusion of the analyte that spreads from the cells to the film and subsequently to the outermost fluid. The speed of this process is characterized by different diffusion coefficients. At the same time the analyte moves from the intact nucleus towards the shell of the particle with the consequent reduction in the dimensions of the intact nucleus. The transfer of the analyte, from the particle to the fluid, is increasingly slow due to the decrease in the size of the core and the increase in the size of the shell. The extraction rate gradually decreases and strongly depends on the particle size [9].
39
Fig. 2.5 Representation of the SC model of a particle. The analyte diffuses from the
shell to the film of fluid surrounding the particle and from the intact nucleus to the shell and the boundary of the intact nucleus narrows [9].
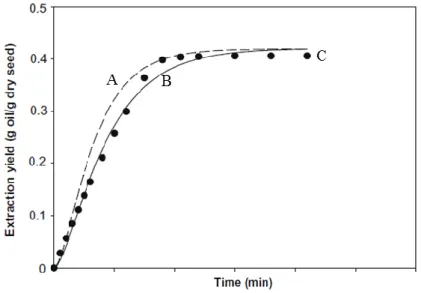
The BIC model theorizes extractions with higher yields and shorter times than the SC model (with the same experimental parameters). Both are used for the theoretical calculation of the extraction yield, often with the use of variants. Onur Doker et al. (Figure 2.6) compared the experimental data of the extraction of sesame oil from seeds with the theoretical data obtained from the two models. The theoretical SC model represent with good approximation the experimental data [4].
40
Fig. 2.6 A represents the curve of the BIC model, B represents the curve of the SC
model, C represents the curve obtained with the experimental data [4].
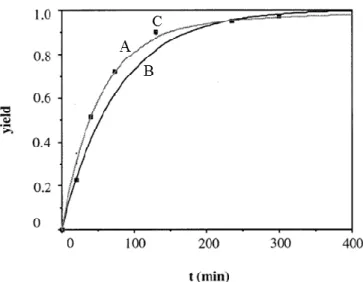
Pascale Subra et al. (Figure 2.7) obtained experimental data for the extraction of β-carotene from carrots very similar to the theoretical data of the BIC model [9].
The use of a model (with modifications or not) depends mainly on the matrix used and its pre-treatment.
Often, it is difficult to understand the most suitable method to use, but they are important for explaining the phenomena related to the extraction processes and improving the scale-up [9].
41
Fig. 2.7 A represents the curve of the BIC model, B represents the curve of the SC
model, C represents the curve obtained with the experimental data [9].
2.4 Extraction collection
The compound extracted with the SFE process is collected using a liquid phase system, the tube leaving the SFE system is immersed in a vial containing a liquid or solid phase system, that trap the extract.
2.4.1 Liquid phase collection
The liquid phase trapping system is the most used because it is very convenient, versatile and allows to trap even large quantities of analyte. This process depends above all on the nature and quantity of organic solvent used, because it must solubilize the extracted analyte.
An experiment done by Turner et. al. [11] describes the importance of the solvent for the yields of Vitamin A (Retinol) and Vitamin E (α-Tocopherol) with SFE using milk powder. Table 2.2 show that recoveries are better with the 1:1 v/v mixture of diisopropyl ether and
42
ethanol (DIPE-EtOH), compared to using pure isopropanol (IPA), methanol (MeOH) or acetone.
The greater collection capacity of this mixture of solvents is most likely due to its ability to solubilize larger quantities of microparticles and microaggregates that contain the analytes considered.
Tab. 2.2 Recovery of Vitamin A and Vitamin E from milk powder.
Collection Vitamin A Vitamin E solvent recovery recovery
(%) (%)
DIPE-EtOH 102 85
IPA 108 68
MeOH 97 55
Acetone 89 42
For an optimal collection of the extract, the parameters to be considered are the flow rate, the temperature of the outlet tube of the SFE system and the temperature of the solvent.
High flow rates cause low yields due to high transport of the analyte by the gaseous CO2, uncontrolled temperatures of the collector tube cause
its freezing and blockage of the extract, the low temperatures of the organic collection solvent allow the loss of volatile analytes, while high temperatures are used for non-volatile compounds, considering their thermolability [11].
The exit tube is often depressurized so that the CO2 passes into the gas
phase at the end of the tube, in this way the analyte is completely released into the solvent. In this system, the flow rate of the SFE must be low to obtain an optimal pressure drop and good yields because CO2
43
The depressurization necessity a heating system to avoid freezing and blocking of the tube. In this system, the SFE flow rate must be low to obtain an optimal pressure drop and good yields because CO2 tends to
transport the analyte even in the gaseous phase [12].
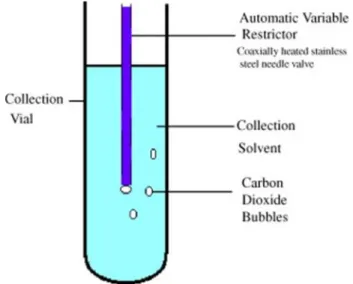
Fig. 2.8 Representation of the process of entrapment of the extract in an organic
solvent [12].
The size of the CO2 bubbles are small using a restrictor at the exit from
the extraction system, this represents a higher transfer rate of the analytes from the gas phase (CO2) to the liquid phase (organic solvent).
Viscous solvents and very long vials are used to increase the contact time between these two phases.
These devices were used by Bøward et. al for the extraction of polycyclic aromatic hydrocarbons, improving the yield from 48% to 75% while maintaining constant flow parameters, temperature and type of collection solvent [13].
44
Systems that pressurize the collection container are used to increase the yields of highly volatile analytes, alternatively a low temperature condenser connected to the collection system is used [14].
2.4.2 Solid phase collection
The solid phase trapping system is composed of an adsorbing porous solid material (octadecylsilane, diol, silica, florisil or alumina) and an inert support (steel, glass or fused silica), the analyte trapped on the porous solid is eluted using a specific solvent [8].
The adsorbent solid can be composed of different materials. In this case it traps the analyte very effectively (increasing the final yield) and allows a solvent to selectively elute the analyte from the extracted mixture, increasing selectivity.
The fundamental parameter, for solid phase collection, is the maximum adsorption capacity, that is the maximum quantity of analyte that the collection system can adsorb. This value, for real samples, is always lower than the values obtained with the use of a standard due to the co-extracted compounds that overload the system.
To eliminate this problem, generally, a solvent is used to extract the compounds trapped in the adsorbent solid which can be reused again, creating an “intermittent extraction”.
For this process it is important to use an organic solvent that has good solubility and selectivity for the analyte of interest or for the co-extracted compounds [15].
The use of large volumes of polar modifiers or solvents in the extraction process causes little entrapment of the analyte in the porous solid support. Necessarily, the temperature of the collection system is
45
maintained above the boiling point of the modifier, so low boiling modifiers are used.
Solid phase collection techniques allow better recoveries than liquid phase collection for non-volatile components [16].
While volatile compounds can be collected, with the solid phase system, using cryogenic cooling. The CO2 is depressurized at the outlet
from the SFE and is channeled towards the adsorbent material keeping the temperatures of the harvesting system very low. This allows the deposition of the volatile analytes on the adsorbent support separating them from the non-volatile co-extracts [17].
46
References
[1] F. Pena-Pereira, M. Tobiszewski. The Application of Green Solvents in Separation Processes Chapter 7. Publisher Elsevier, 2017.
[2] S. M. Pourmortazavi, S. S. Hajimirsadeghi. Supercritical fluid extraction in plant essential and volatile oil analysis. Journal of Chromatography A 2007, 1163, 1.
[3] A. A. Clifford, J. R. Williams. Introduction to Supercritical Fluids and Their Applications. Publisher Humana Press, 2000.
[4] O. Döker, U. Salgin, N. Yildiz, M. Aydogmus, A Çalimli. Extraction of sesame seed oil using supercritical CO2 and mathematical modeling. Journal
of Food Engineering 2010, 97, 360.
[5] E. Vàgi, B. Simàndi, K. P. Vàsarhelyiné, H. Daood, A. Kéry, F. Doleschall, B. Nagy. Supercritical carbon dioxide extraction of carotenoids, tocopherols and sitosterols from industrial tomato by-products. The Journal of Supercritical Fluids 2007, 40, 218.
[6] E. Lesellier, C. West. The many faces of packed column supercritical fluid chromatography – A critical review. Journal of Chromatography A 2015, 1382, 2.
[7] J. Shi, C. Yi, S. J. Xue, Y Jiang, Y. Mac, D. Li. Effects of modifiers on the profile of lycopene extracted from tomato skins by supercritical CO2. Journal
of Food Engineering 2009, 93, 431.
[8] S. Moret, G. Purcaro, L. S. Conte. Il campione per l’analisi chimica. Publisher Springer-Verlag Mailand, 2014.
[9] Z. Huanga, X. Shib, W. Jiang. Theoretical models for supercritical fluid extraction. Journal of Chromatography A 2012, 1250, 2.
[10] P. Subra, S. Castellani, P. Jestin, A. Aoufi. Extraction of β-carotene with supercritical fluids: Experiments and modelling. The Journal of Supercritical Fluids 1998, 12, 261.
[11] C. Turner J. W. King, L. Mathiasson. Supercritical fluid extraction and chromatography for fat-soluble vitamin analysis.Journal of Chromatography A 1998, 12, 261.
47
[12] S. M. Pourmortazavi, S. S. Hajimirsadeghi. Supercritical fluid extraction in plant essential and volatile oil analysis. Journal of Chromatography A 2007, 1163, 2.
[13] S. Bøwadt, F. Pelusio, L. Montanarella, B. R. Larsen. Trapping techniques in supercritical fluid extraction. Journal Trace and Microprobe Techniques 1993, 11, 117.
[14] M. Oszagyán, B. Simándi, J. Sawinsky, Á. Kéry, E. Lemberkovics, J. Fekete. Supercritical Fluid Extraction of Volatile Compounds from Lavandin and Thyme. Flavour and Fragrance Journal 1996, 11, 157.
[15] A. Meyer, W. Kleiböhmer. Supercritical fluid extraction of polycyclic aromatic hydrocarbons from a marine sediment and analyte collection via liquid-solid trapping. Journal of Chromatography A 1993, 657, 327.
[16] R. M. Smith. Supercritical fluids in separation science – the dreams, the reality and the future. Journal of Chromatography A 1999, 856, 83.
[17] J. Vejrosta, A. Ansorgová, J. Planeta, D. G. Breen, K. D. Bartle Anthony A. Clifford. Solute trapping in off-line supercritical fluid extraction using controlled modifier condensation. Journal of Chromatography A 1994, 683, 407.
48
3 Supercritical fluid chromatography
3.1 Evolution of the SFC
The SFC technique was used, for the first time, in 1962 by Klesper et al. [1] to separate a mixture of porphyrins using two gases (dichlorodifluoromethane and monochlorodifluoromethane) as the mobile phase and polyethylene glycol as the stationary phase. The mobile phases solubilized the porphyrins when temperatures and pressures were higher than the TC and PC of the corresponding gases.
Subsequently Sie et al. [2, 4] used carbon dioxide as a supercritical fluid for the analysis of different classes of molecules. They published, between 1966 and 1967, works describing the tools created to keep CO2
in supercritical conditions.
In the late ꞌ60s, the first commercial systems for stabilizing the supercritical conditions of a fluid was developed and Giddings et al. [5] defined supercritical fluid chromatography as the meeting point between gas chromatography and liquid chromatography.
In the ꞌ70s, supercritical fluid instruments were optimized and studies were made to develop preparative SFC systems.
There was a lot of research on the development of new columns in the ꞌ80s this led to the wide commercialization of SFC tools. Novotny et al. [6] demonstrated that open capillary columns, made of fused silica, were better than packed columns for SFC systems because the pressure drop was lower and this resulted in a higher separation efficiency. The problem with these columns was that the density of the supercritical
49
fluid could only be changed with a change in flow and not with pressure. In the ꞌ90s this type of columns were less used due to this limitation.
Sugiyama et al. [7], in 1985, developed an on-line SFE-SFC system using packed columns in order to extract and separat the caffeine from ground coffee. The identification of the extracted and separated compounds was done with a UV photodiode system (PDA), it immediately became the main detector for packed column SFC systems.
In the ꞌ80s, Saito et al. [8] developed an electronic system to stabilize the back pressure that allowed efficient separation without contaminations. This type of back pressure regulator has become the standard device in packed column SFC systems.
The first organic solvents were used to modify the polarity of supercritical CO2 following the commercialization of the back pressure
systems. The percentage of modifier used was increased with the improvement of the pumps, and in 1991, Cui and Olesik [10] obtained and described the subcritical phase of supercritical fluids. The variation in pressure and temperature of this fluid phase was not related to the variation in density and therefore to the variation in the extraction capacity and permeability of the fluid. This is caused by the temperatures and pressure used because they are lower than the PC and
TC values.
In the ꞌ90s, studies focused on the use of packed columns, they became the main columns used for SFC systems, and on enantio-separations with the development of chiral stationary phases.
50
From the 2000s onwards, the SFC technique has been improved with numerous technological innovations (improved detectors) and greater performance of the mechanical parts (pumps, back pressure system, columns, etc.) [10].
Today SFC systems are used for the analysis of numerous sample such as food, biological matrices, and applications in various ommic sciences including lipidomics, metabolomics and proteomics.
3.2 Chromatographic parameters
The purpose of chromatography is to separate the individual components of a mixture from each other. The parameters considered in the chromatographic process are many, in this paragraph the most important will be described.
3.2.1 Retention parameters
The retention time (tR) is the time needed for a solute to elute from one
end of the column to the other and then be detected by the detector. Dead time (t0) is the retention time of a solute that is not retained by the
stationary phase and therefore flows at the same speed as the mobile phase.
The retention volume (VR) is the volume of mobile phase required to
elute the solute from one end of the column to the other. It is defined with the equation 3.1:
![Table 1.3 Density mg/mL for scCO 2 as a function of pressure and temperature [8]. P (MPa) T ( ○ C) 7.4 10 20 30 40 50 60 31 0.42 0.76 0.89 0.94 0.99 1.02 1.04 40 0.23 0.62 0.83 0.91 0.96 0.99 1.02 50 0.19 0.38 0.78 0.88 0.92](https://thumb-eu.123doks.com/thumbv2/123dokorg/4576811.38530/14.765.148.661.436.678/table-density-mg-scco-function-pressure-temperature-mpa.webp)
![Figure 2.2 represents the extraction yield versus flow for carotenoids and tocopherols in tomato waste at two pressure values (380 bar and 460 bar), with a constant temperature of 60 °C [5].](https://thumb-eu.123doks.com/thumbv2/123dokorg/4576811.38530/36.765.160.644.415.783/figure-represents-extraction-carotenoids-tocopherols-pressure-constant-temperature.webp)