An Innovative Pressing Process by
Mechanical Interference Fit for Assembly
and Calibration of Fuel Injector
Ph.D. Dissertation of:
Andrea Liuti
Supervisor:
Prof. Nicola Paone
Assistant Supervisor:
Dott. Ing. Francisco Rodriguez Verdugo
Ph.D. Course Coordinator
Prof. Ferruccio Mandorli
~ 1 ~
Acknowledgements
This thesis has one name on its cover, but its contents is a collective work of many people that have to be acknowledged.
I would like to express my most profound gratitude and sincere appreciation to my Ph.D. supervisor, Professor Nicola Paone, for his guidance, encouragement, and support which he has provided throughout all my Ph.D.
I am truly grateful to Ing. Carmine Ungaro, Dr-Ing Francisco Rodriguez Verdugo and, in general, to Loccioni, partner of the Ph.D project. I am particularly thankful to Carmine and Francisco for their technical supervision, suggestions and encouragement. They gave me the possibility to work in this new topic with confidence, as well as with valuable feedbacks and directions in the research. Our accomplishments in the research are the result of team working and knowledge sharing. I have learned a lot in an environment where ideas and initiative are promoted. I had the opportunity to have contacts with many person, always receiving really helpful comments. Thank you so much.
I am also sincerely grateful to Prof. Paolo Castellini, Dr-Ing Paolo Chiariotti and Dr-Ing Luigi Montalto for their advice and assistance. I am indebted for many enlightening discussions. I wish to extend my special thanks to all my colleagues in the measure group of the Department of Industrial Engineering and Mathematical Sciences (DIISM), for their help and supports. I am very thankful to FEV Europe GmbH and, in particular, to Ing. Thomas Körfer, Dr-Ing Hermann Josef Laumen and Ing. Holger Beurer. Thanks to their hospitality I had the opportunity to spend 9 fantastic months in Germany for an excellent research experience, which significantly contributed to this thesis. I incremented my knowledge level in a new area that enriches this research of an important part.
Most importantly, I would like to express my gratitude to my girlfriend, Francesca; she has always motivated me to give all my best and use the capacities that I could not see. She encouraged me to catch all the opportunities, placing my growth at the first place.
Last but not least, I would like to thank my family for their love, sacrifice, and encouragement.
Thank you.
~ 2 ~
Abstract
The production processes of fuel injectors can be significantly improved by a more accurate positioning control in the assembly of key components by interference fit.
This thesis presents an innovative press-fitting station in the assembly line, that combines a hydraulic cylinder and a piezoelectric actuator to reach micrometric accuracy in axial positioning. The hydraulic cylinder permits a long operational range, while the piezo actuator provides dynamic action and micrometric accuracy. The experimental characterization of the prototype press is presented together with the physical phenomena influencing the overall system performance. The tests are done using cylindrical plugs and sleeves to replicate the insertion of shafts into holes. The test samples are designed and machined to obtain a predefined interference fit. The classic press-fit assembly process can barely reach micrometric accuracy because the deformation on the contact surface cannot be measured easily. The presented new press-fit station can overcome these limits thanks to the developed advanced control strategy: when the piezo actuator is driven by an amplitude modulated sinusoidal signal, final positioning of ±2 µm is reached insertion forces up to 20 kN. The remarkable performances obtained using dedicated samples have been then tested for real components in two different use cases: dry calibration process for GDI injector and assembly of a solenoid control valve for state of the art common rail diesel injector. The first is a cleaner process for calibration of GDI injector in the ballistic region, that uses Nitrogen instead of a liquid working fluid. With this approach a substantially lower error for the injected quantity in the low quantity region can be accomplished, together with a cheaper management of an inert gas with respect to the liquid one.
The second application case is an assembly between the pin and the armature of the solenoid control valve of a common rail diesel injector. The relative position of the armature with respect to the valve body influences the operational behaviour of the injector during the transient opening and closing phases. In order to gain a more predictable behaviour of the fuel injector, needed for upcoming legislative requirements, a high geometric accuracy is mandatory.
These studies have confirmed the possibilities of the press prototype in real application cases; thus, the press can be inserted in real industrial process, achieving the scope of the research.
~ 3 ~
Abbreviations
ECU Engine Control Unit
CR Common Rail
GDI Gasoline Direct Injection ICE Internal Combustion Engine NOx Nitrogen Oxides
CO Carbon Oxides CO2 Carbo Dioxides
HC Hydrocarbons LDV Light Duty Vehicle
NEDC New European Driving Cycle EUDC Extra Urban Driving Cycle CADC Common Artemis Driving Cycle WMTC Worldwide Motorcycle Test Cycle PEMS Portable Emissions Measurement Systems WLTC Worldwide harmonized Light duty Test Cycle WLTP Worldwide harmonized Light duty Test Procedure UNECE United Nations Economic Commission for Europe PMR Power Mass Ratio
RDE Real Driving Emissions GHG GreenHouse Gas PM Particulate Matter DPF Diesel Particulate Filter GPF Gasoline Particulate Filter
~ 4 ~
PSE Propulsion System Efficiency EGR Exhaust Gas Recirculation
HCCI Homogeneous Charge Compression Ignition SCR Selective Catalytic Reduction
LNT Lean NOx Trap
TWC Three-Way Catalyst SF Swirl Flaps
TBI Throttle Body Injection MPFI Multi-Point Fuel Injection SFI Sequential Fuel Injection SPFI Sequential Port Fuel Injection HPCR High Pressure Common Rail SQA Small Quantity Adjustment ET Energizing Time
FSA Fuel Set-point Adaptation
𝑚̇𝑎𝑖𝑟 Mass flow of the air at the engine intake
λ Air to fuel ratio
ρ Density
FSN Filter Smoke Number λst Stoichiometric air to fuel ratio
µs Static friction coefficient
µd Dynamic friction coefficient
DLDV Differential Laser Doppler Vibrometer CSD Constant Slope Driving
SWTI Square Wave Train Impulse
~ 5 ~
DOE Design Of Experiment
cRIO compact Reconfigurable Input Output FPGA Field Programmable Gate Array AS Adjustment Sleeve
STS Shot To Shot MAE Mean Absolute Error
ρxy Pearson correlation coefficient
~ 6 ~
List of Figures
Figure 2.1 - NEDC emission test ... 17
Figure 2.2 - Gap between on-road vs. laboratory testing (Source: M. Weiss, P. Bonnel, R. Hummer, N. Steinenger, ”A complementary emissions test for light duty vehicles: assessing the feasibility of candidate procedures”) ... 18
Figure 2.3 - WLTC emission test ... 19
Figure 2.4 - RDE emission test ... 20
Figure 2.5 - Time frames of the type approval test cycles ... 21
Figure 2.6 - Schematic of a gasoline port fuel injector ... 31
Figure 2.7 - Example of a Diesel common rail injection system (Source: Technical overview of common rail fuel systems - AK Training) ... 32
Figure 2.8 - Schematic of a diesel common rail injector (source: Bosch) ... 33
Figure 2.9 - Rail pressure during different injections (Technology focus - Diesel Common Rail - Pressure Wave compensation, Autoelex) ... 34
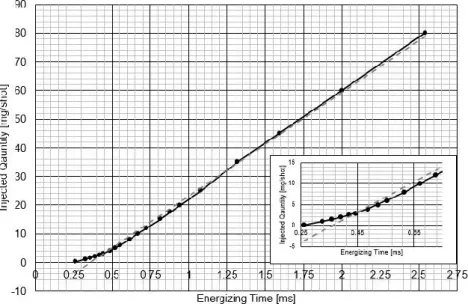
Figure 2.10 - Characteristic curve of a GDI injector ... 35
Figure 2.11 - Characteristic curve of a CR injector without upper needle stop ... 36
Figure 2.12 - Different inaccuracies that have an influence in each injection ... 38
Figure 2.13 - Schematic overview of the fuel delivery compensation strategies ... 38
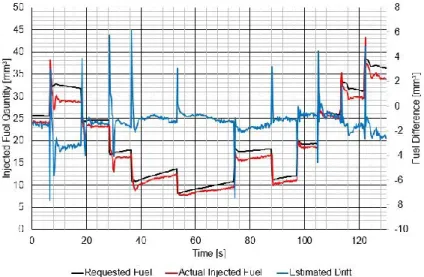
Figure 2.14 - Estimation of the injector drift, based on estimation of actual injected fuel .. 40
Figure 2.15 - Enabling of the storing of the fuel difference in the map ... 41
Figure 2.16 - Emission measurement for different offsets of drift estimation function ... 42
Figure 2.17 - Emission measurement for different offsets with 1750 rpm and 15 mm3 ... 43
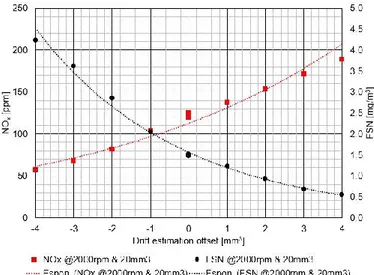
Figure 2.18 - Emission measurement for different offsets with 2000 rpm and 20 mm3 ... 43
Figure 2.19 - Interference fit of two cylinders of equal length ... 45
Figure 2.20 - Behaviour of the contact pressure in case of different length between shaft and collar ... 47
Figure 2.21 - Cross section of the inner cylinder (a) and both shaft and hole (b) ... 48
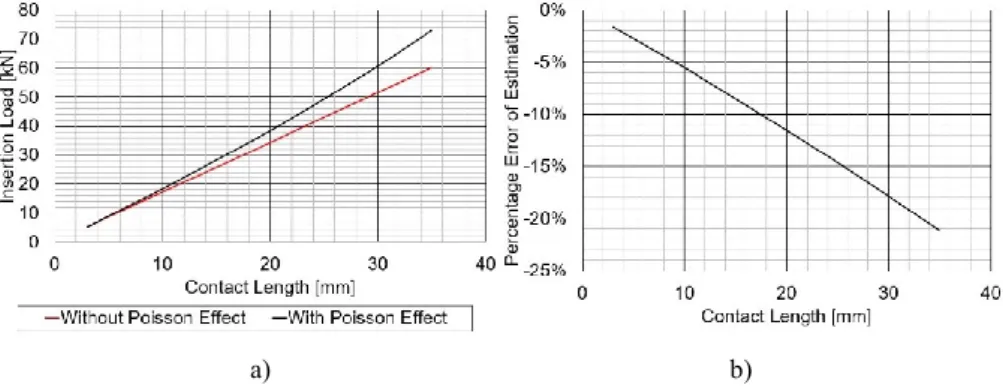
Figure 2.22 - Comparison of the insertion load with or without the consideration of the axial stresses (a). Percentage error between the two calculations (b) ... 50
Figure 2.23 - Coulomb friction (a) and Coulomb model with static friction phenomenon (b) ... 50
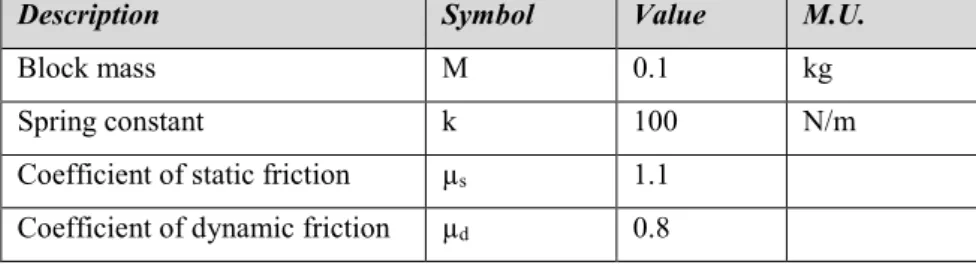
Figure 2.24 - Mass/spring system with friction ... 51
Figure 2.25 – Displacement series (a) and friction load (b) for the mass/spring system ... 51
Figure 2.26 - Block scheme of a press system ... 52
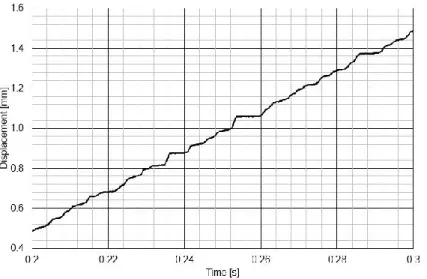
Figure 2.27 - Stick-Slip effect in a pneumatic press, measured with a differential LDV .... 53
Figure 2.28 - Electrical connection of the layers of a piezo actuator ... 54
Figure 3.1 - Schematic of the model used for the simulation ... 57
Figure 3.2 - Bound displacement X at the free end of the spring ... 57
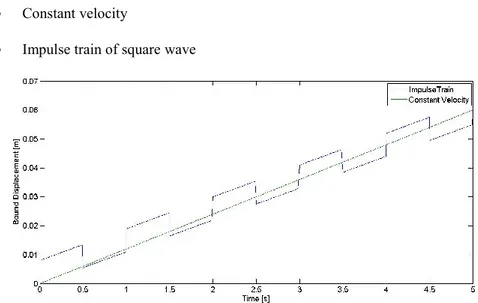
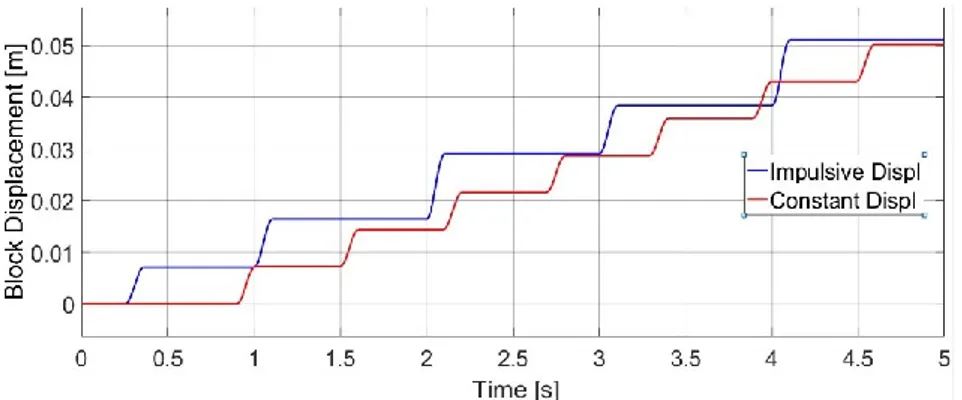
Figure 3.3 - Comparison of block displacement in constant velocity case and square waves train with a frequency of 1 Hz ... 59
Figure 3.4 - Case 2 and 3, tested with square wave frequency of 10 Hz (a) and 20 Hz (b) . 59 Figure 3.5 - Comparison of block displacement in constant velocity case and square waves train with a frequency of 50 Hz ... 60
~ 7 ~
Figure 3.6 - Particular of block displacement in constant velocity case and square waves
train with a frequency of 50 Hz ... 60
Figure 3.7 - Sketch (a) and picture (b) of the test bench ... 61
Figure 3.8 - Deflection of the beam support, loaded at the centre ... 62
Figure 3.9 - Characteristic curve of the piezoelectric actuator ... 63
Figure 3.10 - Spherical tip of the piezoelectric actuator ... 64
Figure 3.11 - Load cell ... 64
Figure 3.12 - Block diagram of the acquisition system ... 65
Figure 3.13 - Schematics of the assembled sample (a) and the plug (b) ... 67
Figure 3.14 - CSD signal ... 68
Figure 3.15 - SWTI driving signal ... 69
Figure 3.16 - AMSD signal ... 70
Figure 3.17 - Load (red) and displacement (blue) during a test with CSD signal... 71
Figure 3.18 - Comparison of the displacement curves during two different tests: CSD signal test and free motion of the piezo actuator ... 71
Figure 3.19 - - Displacement (a) and Load (b) measured during an SWTI driving of the piezo actuator... 72
Figure 3.20 - Displacement (a) and Load (b) measured during an AMS driving of the piezo actuator ... 72
Figure 4.1 - Schematic of the press-fit station ... 75
Figure 4.2 - Test sequence ... 76
Figure 4.3 - Operating principle of a potentiometer position transducer ... 77
Figure 4.4 - Architecture of a cRIO ... 78
Figure 4.5 - Measured load time history and Coulomb friction model. Evaluation of the inflection point corresponding to the assumed start of the relative motion ... 80
Figure 4.6 - Workflow of the control loop algorithm for the Constant Slope Drive... 80
Figure 4.7 - Schematic of the implementation of the control loop for the Constant Slope Driving ... 81
Figure 4.8 - Different phases of the load history during a typical AMSD test ... 82
Figure 4.9 – Initial workflow of the algorithm for AMSD signal ... 82
Figure 4.10 - Increment of the displacement during elastic cycles ... 83
Figure 4.11 - Pre-sliding phenomenon measurement with FPiezo=20 Hz ... 83
Figure 4.12 - Final workflow of AMSD control loop ... 85
Figure 4.13 - Positioning error for constant slope driving tests ... 86
Figure 4.14 - Comparison of two processor rates for a set-point of 24 µm ... 87
Figure 4.15 - Positioning error for AMS driving tests for different slopes frequencies ... 88
Figure 4.16 - Load-displacement curve during the first steps of a AMSD test ... 89
Figure 4.17 - Positioning error for AMS driving tests for different frequencies ... 89
Figure 4.18 - Comparison of the positioning errors for a slope of (a) 1 V/s and (b) 2.5 V/s of the driving voltage ... 90
Figure 4.19 - Envelopes of the maxima and minima of the displacement for a test with the AMSD control ... 91
Figure 5.1 - Main components of a GDI injector... 92
Figure 5.2 - Error respect to the target quantity of a batch of GDI injectors calibrated in the linear region (ET <0.6 ms) ... 93
~ 8 ~
Figure 5.4 - Injection rate of a GDI injector ... 95
Figure 5.5 - Schematic of the measurement setup for GDI injector characterization ... 96
Figure 5.6 - Loccioni AirMexus ... 97
Figure 5.7 – Schematic of AirMexus measuring chamber... 97
Figure 5.8 - Closing condition used for calculation of C2 ... 100
Figure 5.9 - Current and voltage profile shape ... 100
Figure 5.10 - Characteristic flow curve of GDI injector measured with N-heptane and Nitrogen ... 101
Figure 5.11 - Linear correlation between N-heptane and Nitrogen in a) rebound and b) linear region ... 102
Figure 5.12 - Dispersion of the injected quantities in Nitrogen and N-heptane... 103
Figure 5.13 - Target calculation for dry calibration ... 104
Figure 5.14 - Configuration of the dry calibration test bench ... 105
Figure 5.15 - Schematic of the double control loop... 106
Figure 5.16 - Accuracy of the press-fit ... 106
Figure 5.17 - Comparison of error dispersion and MAE of wet calibrated and dry calibrated batch ... 107
Figure 5.18 - Error of the dry calibrated batch with respect of the quantity target in liquid ... 108
Figure 6.1 - Operating principle of a solenoid common rail injector ... 109
Figure 6.2 - Schematic of the control valve ... 110
Figure 6.3 - Workflow of the proposed assembly process ... 111
Figure 6.4 - Layout of the measurement station ... 112
Figure 6.5 - Scanning path of the valve ... 113
Figure 6.6 - Synchronization of the position measurement with the scanning stroke... 113
Figure 6.7 - Repeatability of the measurements for three different test conditions ... 115
Figure 6.8 - Valve fixture of the press-fit station... 116
Figure 6.9 - Force - Displacement curve of a press-fit process of a valve ... 117
~ 9 ~
List of Tables
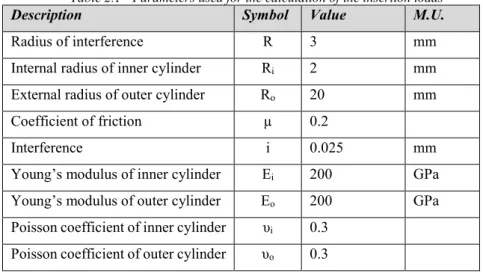
Table 2.1 - Parameters used for the calculation of the insertion loads ... 49
Table 3.1 - Parameters used for the simulation of the mass-spring system ... 58
Table 3.2 - Parameters used for the calculation of the deflection in the supporting plate ... 62
Table 3.3 - Acquired channels specifications ... 66
Table 4.1 - Measurement devices used for feed-back control in the press-fit station ... 78
Table 5.1 - Comparison of pulse widths for maximization of Pearson coefficient ... 104
~ 10 ~
Contents
Acknowledgements ... 1 Abstract ... 2 Abbreviations ... 3 List of Figures ... 6 List of Tables ... 9 Contents ... 10 1. Introduction ... 13 1.1. Motivation ... 131.1.1. Interference fit assembly processes ... 13
1.1.2. Implications in the automotive industries ... 14
1.2. Research Objectives ... 14
2. State of the Art ... 16
2.1. Regulatory Framework Regarding Emissions ... 16
2.1.1. From NEDC to WLTC ... 16
2.1.2. Emissions and fuel efficiency of ICE for mobility ... 21
2.1.2.1. Downstream intervention ... 23
2.1.2.2. In-cylinder measures ... 25
2.1.2.3. Upstream intervention ... 26
2.2. Fuel Injectors ... 29
2.2.1. State of the art of injectors... 29
2.2.2. Inaccuracies of the injectors ... 34
2.2.3. Fuel delivery compensation strategies for ICE vehicle ... 38
2.3. Press-Fit Processes ... 44
2.3.1. Theoretical aspects of interference fit ... 45
2.3.2. Limits of the commercial solutions ... 52
3. Characterization of Motion in Interference-Fit ... 56
3.1. Numeric simulation approach ... 56
3.1.1. Model ... 56
3.1.2. Results ... 58
3.2. Prototype of the Piezo Actuated Press ... 61
3.2.1. Displacement measurement system ... 61
3.2.2. Force generation ... 63
3.2.3. Force measurement system... 64
3.2.4. Acquisition system ... 65
~ 11 ~
3.3. Test Samples ... 66
3.4. Driving Signal for the Piezo Actuator ... 68
3.4.1. Constant Slope Driving ... 68
3.4.2. Square Wave Train Impulse ... 69
3.4.3. Amplitude Modulated Sinusoidal Driving ... 69
3.5. Results ... 70
4. Full Scale Prototype Press ... 74
4.1. Configuration of the Press-Fit Station ... 74
4.1.1. Mechanical concepts ... 75
4.1.2. Electric/Electronic hardware ... 77
4.1.2.1. Sensors... 77
4.1.2.2. Test bench control system ... 77
4.2. Control Models ... 79
4.2.1. CSD control loop ... 79
4.2.2. AMSD control loop ... 81
4.3. Experimental Results ... 85
4.3.1. Test Procedure ... 85
4.3.2. Results ... 86
4.3.2.1. Constant slope (CSD) ... 86
4.3.2.2. Sinusoidal modulated (AMSD) ... 88
4.3.2.3. Comparison of results ... 89
5. Application Case 1: Dry Calibration of GDI Injector ... 92
5.1. Measurement System for Injected Fuel Quantity ... 95
5.1.1. Shot-to-Shot device for fuel injector fed with a gas ... 96
5.1.2. Injector Driver ... 100
5.2. Correlation between Wet and Dry Measurement ... 101
5.3. Dry Calibration Process ... 105
5.3.1. Developed process ... 105
5.3.2. Results ... 107
6. Application Case 2: Assembly of Needle Control Valve of CR Diesel Injector 109 6.1. Focus on the industrial problem ... 110
6.2. Proposed workflow of the process ... 111
6.3. Development of the stations ... 111
6.3.1. Measurement of the armature position ... 112
6.3.2. Repeatability and reproducibility of the measurement station ... 114
6.4. Results ... 115
~ 12 ~
Appendix ... 120 References ... 121
~ 13 ~
1. Introduction
1.1.
Motivation
The goal of this thesis is to improve the quality of the fabrication processes related to the production of fuel injectors, chosen as products of interest, by mean of a more accurate positioning in the assembly of key components by interference-fit. A micrometric positioning accuracy is currently requested in order to have a more stable and repeatable behaviour of the injector, really important in low fuel delivery regions.
Most of commercial assembly systems are not able to accomplish this requirement in a robust and reliable way, leading to more emissions and the necessity to compensate for this inaccuracies with dedicated learning functions implemented in the Engine Control Unit (ECU).
The adoption of the developed process can lead to remarkable improvements in the injector’s production process, fulfilling the tighter requirements needed in order to respect new emission regulations.
1.1.1. Interference fit assembly processes
In the automotive industry, exist many assembly processes that require a high geometric accuracy, in the micrometric range; generally, widely used open-loop controllers cannot meet these requirements. Interference fit, also named press fit or friction fit, provides a stable fastening between two parts by friction. Interference fit is generally achieved by shaping the two mating parts so that one part is slightly larger than the other. In general, such an assembly consist in the insertion of a shaft or a plug inside a hole, with interference. When two parts are pressed together, the static insertion force is generally considered as the main control parameter for the pressing process. However, only an approximate value of the insertion force can be computed beforehand because the friction coefficient is not known with appropriate accuracy and the assumed constant pressure is altered by the axial force through the Poisson effect. This difference from the ideal condition causes a non-predictable behaviour of the inserted part and an associated uncertainty of the process. To develop a new press-fitting process, it is desirably important to know, what are the main process variables to be managed and how they evolve during the production process, in order to control the quality of the products and their conformity to the functional specifications.
~ 14 ~
This work is an intermediate step towards Industry 4.0 and, in particular, to the concept of
Zero Defect Manufacturing, that needs an active integrated quality control. Currently, the
quality controls of the final assembled products are executed at the end of the process, thus not able to change in relation of modifications of material, geometry or components due to inaccuracies of the previous production phases. With conventional approach, the quality control is only a filter and thousands of products might be produced before the detection of the fault. The solution is to measure continuously the quality of the assembly and monitor the status, adapting the fabrication process in real time.
1.1.2. Implications in the automotive industries
Press fit is particularly relevant in automotive industry, where many components of the fuel injection system are realized by interference fit assembly. For these components, interference fit assembly can be subject to different specifications: in some cases, the final axial position of the plug with respect to the sleeve is the main feature to keep under control, often down to micrometric accuracy. In other cases, the functional performance of the assembled component determines the compliance of the process to the specifications. In components like fuel injectors or valves, the functional performances that are need to be achieved might be related to the flow of the fluid across the component: for example, mass or volume flow rate or pressure drop are the real specifications that is aimed to achieve. Functional performances of fuel injection system parts are strictly related to engine performance, fuel consumption, combustion efficiency, pollutant emissions and engine reliability. Since pollutant emission standards are becoming tighter and tighter with view on absolute numbers but as well on durability and lifetime performance, the automotive industry is striving to increase efficiency of the production processes of key sub-systems, including fuel injection components. Therefore, the assembly tolerances both in the final positioning and in the functional performance are becoming more and more demanding.
1.2.
Research Objectives
The aim of the present research is to improve the mechanical assembly processes for key components in fuel injection equipment with interference fits. The injectors for internal combustion engines were chosen as the products of interest, where different assembly processes are used today to produce these components, depending on the specific application.
~ 15 ~
In order to accomplish this aim, the characteristic phenomena that take place during the insertion of a shaft in a hole, with interference, will be analysed. The focal points that lead to the inaccuracies will be pointed out and the solutions to overcome these limitations will be expressed with the realization of an advanced press station prototype. The performances of the new process will be analysed in two different application cases: in one the main feature is a fundamental functional performance and more precisely the injected fuel quantity. Indeed, the proposed dry calibration process for Gasoline Direct Injection (GDI) injectors combines the press station and a shot-to-shot device, fed with nitrogen. As a second study case, the assembly of the control valve of a Common Rail (CR) Diesel injector was selected. For this application, the specifications required a high accuracy over the entire process in terms of relative position of the inserted parts.
The proof of concept in two different applications depicts the maternity of the advanced approach for implementation in series production.
~ 16 ~
2. State of the Art
A literature survey of prior research relevant to the current study is given in this chapter starting from the framework of emissions regulations and the current technologies employed in order to have more efficient Internal Combustion Engines (ICE). The second part describes fuel injectors in more details: functional concept, inaccuracies and the adopted strategies for the correction of these issues. The last part addresses existing press-fit processes in current production lines, the theoretical aspects and the characteristic phenomena involved.
2.1.
Regulatory Framework Regarding Emissions
2.1.1. From NEDC to WLTC
For obtaining type approval of engine-powered vehicles in the European Union, light-duty vehicles have to comply with emission limits during standardized laboratory emission testing. Although Euro 1 – 5 tier emission limits have become more stringent over the past two decades, in 2008 light-duty vehicles still contributed to the overall NOx emissions of the EU for 41% [1 – 2]. This share can be substantially higher in urban areas where 16% of the population is currently exposed to NO2 concentrations that exceed given air quality standards.
The European legislator has responded to this situation by introducing more stringent Euro 6 emission limits that have been enforced for light-duty vehicles from September 2014 [3 – 4] onwards, consisting in a series of tightening steps.
For emission certification of light-duty vehicles (LDVs) various driving cycles and type-approval test procedures are employed around the world [5] that differ in their ability to statistically represent the real-world conditions and diversity. For example, the New European Driving Cycle (NEDC) is used for the certification of European emission standards up to EU-6.1; it is a modal driving cycle that consists of four repeated urban driving sequences (ECE-15 cycles) and one extra-urban driving portion (EUDC). The entire cycle covers a distance of 11.007 km in 1180 s at an average of 34 km/h. The NEDC (Fig. 2.1) is being used for emission type-approval from Euro 3 and later LDVs in Europe and has been criticized for not being anymore representative of the real-world vehicle operation nowadays.
~ 17 ~
Figure 2.1 - NEDC emission test
Several studies [6 – 8] have shown that actual on-road emissions and fuel consumption can be substantially higher than values reported during the type approval testing on a chassis dynamometer in certified testing laboratories. The CADC (Common Artemis Driving Cycle) represents a real-world simulation driving cycle that aims to characterize average driving conditions in today’s Europe [9]. Studies have shown that its higher dynamicity resulted also in higher emissions compared to the NEDC [10]. Furthermore, the emissions of passenger cars measured over the newly developed Worldwide Motorcycle Test Cycle (WMTC) are assumed to be closer to real world driving emissions. By recently developed Portable Emissions Measurement Systems (PEMS) has been also possible to realize on-road emission tests, that have shown how the current laboratory emission test fails to reliably capture on-road emissions, especially in the case of NOx for Diesel cars and particulates of gasoline powered vehicles [11 – 12].
~ 18 ~
Figure 2.2 - Gap between on-road vs. laboratory testing (Source: M. Weiss, P. Bonnel, R. Hummer, N. Steinenger, ”A complementary emissions test for light duty vehicles: assessing the feasibility of
candidate procedures”)
Therefore, despite many objective benefits, the NEDC is increasingly attracting criticism, some of it justified, that it is no longer representative for the average driving style of a vehicle or driver. The member states which signed the 1998 treaty of the United Nations Economic Commission for Europe (UNECE), including all the European countries as well as Japan, USA, China, Russia and India, therefore decided to develop a new test procedure, the WLTP, under the auspices of the UNECE. This should be properly representative of the driving style of a vehicle anywhere in the world. The automotive industry played a major role in supporting and advancing this initiative.
The development of the WLTC was carried out under a program launched by the World Forum for the Harmonization of Vehicle Regulations (WP.29) of the UNECE through the working party on pollution and energy transport program (GRPE). The aim of this project was to develop a World-wide harmonized Light duty driving Test Cycle (WLTC), to represent typical driving characteristics around the world, to have the basis of a legislative worldwide harmonized type certification test from 2014 onwards. Driving cycles are produced by different countries and organizations and used to assess the performance of vehicles, such as pollutant emissions, fuel consumption and traffic impact. There are two main categories of test cycles: legislative cycles employed in type-approval tests for vehicles emissions certification and non-legislative cycles mainly used in research. Several
~ 19 ~
international harmonized engine dynamometer cycles have been developed for engine emission certification of heavy-duty and non-road engines (WHSC, WHTC, NRTC). A worldwide harmonized test cycle has been developed also for motorcycles emissions (WMTC).
For Light-Duty (LD) vehicles, various vehicle dynamometer test cycles are employed in type-approval tests for emission certification. Such test cycles are: the NEDC used in Europe, JC082 applied in Japan, the UDDS (FTP-75) used in the United States. Each of these driving cycles has advantages and drawbacks, as the ones highlighted for the NEDC in the previous paragraphs.
Therefore, when the WLTC project started, it has been agreed to design a new legislative driving cycle to predict more accurately the exhaust emissions and fuel consumption under real-world driving conditions. WLTC (Fig. 2.3) was derived from “real world” driving data from five different regions: EU + Switzerland, USA, India, Korea and Japan covering a wide range of vehicle categories (M1, N1 and M2 vehicles, various engine capacities, power-to-mass ratios, manufacturers etc), over different road types (urban, rural, motorway) and driving conditions (peak, off-peak, weekend).
Figure 2.3 - WLTC emission test
The WLTC assigned to the highest power mass ratio (PMR) vehicle category (class 3), which represents the vast majority of European vehicles, is composed by four speed phases (low, medium, high and extra-high). The WLTC lasts 1800 s, features a more dynamic speed profile as well as a higher mileage than NEDC. However, the WLTC has the vehicle
~ 20 ~
accelerating or decelerating 84% of the time over the whole cycle, with only 13% at idle and 4% at constant cruise driving, while 40% of the NEDC is at a steady state cruise condition, 24% at idle and the remaining 36% is spent accelerating or decelerating.
On the other hand, following concerns over the “real-world” performance of vehicles approved using the chassis dynamometer test, the European Commission announced in its CAR 2020 Action Plan that it intends to include an additional test for “Real Driving Emissions of LDV (RDE-LDV) from the start of the Euro 6 stage, an on-road measurement using PEMS for gaseous regulated emissions. During a first transitional period, the test procedures should only be applied for monitoring purposes, while afterwards they should be applied together with binding quantitative RDE requirements to all new type-approvals/new vehicles [13].
The concept idea is that throughout its normal life, the emissions of a vehicle type-approved according to Regulation (EC) No 715/2007 emitted at a RDE test performed, shall not be higher than the following not-to- exceed (NTE) values:
(1) 𝑁𝑇𝐸𝑝𝑜𝑙𝑙𝑢𝑡𝑎𝑛𝑡= 𝐶𝐹𝑝𝑜𝑙𝑙𝑢𝑡𝑎𝑛𝑡 × 𝐸𝑈𝑅𝑂 − 6
where EURO - 6 is the applicable Euro 6 emission limit in Table 2 of Annex I in Regulation (EC) No 715/2007 and CFpollutant the conformity factor for the respective pollutant. The trip
sequence shall consist of urban driving followed by rural and motorway driving that has to be run continuously.
~ 21 ~
WLTP test procedure should provide in a method to determine the levels of gaseous and particulate emissions, CO2 emissions, fuel consumption, electric energy consumption and
electric range from light-duty vehicles in a repeatable and reproducible manner, designed to be representative of real-world vehicle operation. These measurement results shall form the basis for the regulation of these vehicles within regional type approval and certification procedures, as well as an objective and comparable source of information to consumers on the expected fuel/energy consumption.
This theme is particularly important nowadays, since from the end of 2017 the NEDC is going to be phased-out while WLTC and RDE phased-in, as shown in Fig. 2.5. This is driving the technological research on ICE more efficient, less pollutant and on emissions reduction mechanisms, in order to adopt the most effective solutions able to overcome these new limitations.
Figure 2.5 - Time frames of the type approval test cycles
2.1.2. Emissions and fuel efficiency of ICE for mobility
As reported by Johnson [14 – 16] engine technology is evolving very rapidly, primarily to meet the tighter emissions regulations in all the major markets. In light-duty applications, the future choices to meeting market demands and GHG regulations will continue to drive the most economical choices, which so far, are engine-based approaches rather than battery-electric or fuel cell vehicles.
~ 22 ~
The most important areas of improvement, all under cost constraints, regard: • Engine technologies for CO2 reduction
• NOx control
• Particulate control • Gaseous pollutant control • Reliability
• Performance
Generally, the technologies used to fulfil these improvements can be divided in three main categories, usually used at the same time in an ICE:
• Downstream of the cylinder • Inside the cylinder
• Upstream of the cylinder
Downstream interventions do not involve directly the combustion process, but target the exhaust gases by treating them, in order to reduce the pollutant concentration. Upstream interventions are directly related at the combustion process, in order to prevent the formation of pollutants acting principally on the air path and on the injection.
Increasing engine efficiency, hence reducing the fuel consumption in addition to reducing the driving resistance, is the only way to reduce the CO2 emissions of cars and other
transportation vehicles driven by internal combustion engines. For this reason, another area of intervention is friction reduction. Although the useful work loss due to engine friction is relatively small for modern engines [17], the reduction of all parasitic energy losses, including friction, remains as a valuable contribution to overall efficiency improvement. Lubrication and friction play essential roles in energy conservation. There are many moving parts in an engine. Proper lubrication keeps them in good working order, extends component longevity, and minimizes energy losses due to friction.
Further solutions for CO2 reduction are the concepts of down-sizing and down-speeding.
Downsizing refers to the practice of automotive engineers to reduce the displacement and/or number of cylinders in an engine. Down-speeding is matching the gearing of the transmission and differential to the engine, so the engine turns at lower RPM for a given highway speed. Both these techniques are currently widely used in light-duty gasoline engines to improve fuel efficiency and reduce both regulated and green-house gas emissions with great success.
~ 23 ~
Downsizing can increase fuel efficiency by 20 to 30% and down-speeding can add an additional 3 to 7%.
2.1.2.1. Downstream intervention
Several devices are installed in the exhaust system, usually mixed for the maximization of the pollutant reduction. The first one is the catalytic converter, an exhaust emission control device that converts toxic gases by catalysing a redox reaction (an oxidation and a reduction reaction). Catalytic converters are used with ICE fuelled by either gasoline or diesel. The "two-way" converters combine oxygen with CO and unburned HC to produce CO2 and H2O.
The two-way catalytic converters were rendered obsolete by "three-way" converters that also reduce NOx. However, two-way converters are still used for lean-burn engines. This is because three-way-converters require either rich or stoichiometric combustion to successfully reduce NOx.
The catalytic converter's construction is as follows:
1. The catalyst support or substrate, usually a ceramic monolith with a honeycomb structure. Metallic foil monoliths made of Kanthal (FeCrAl) [18] are used in applications where particularly high heat resistance is required. Either material is designed to provide a large surface area.
2. The washcoat, a carrier for the catalytic materials used to disperse the materials over a large surface area. Aluminum oxide, titanium dioxide, silicon dioxide, or a mixture of silica and alumina can be used. The catalytic materials are suspended in the washcoat prior to applying to the core. Washcoat materials are selected to form a rough, irregular surface, which greatly increases the surface area compared to the smooth surface of the bare substrate. This in turn maximizes the catalytically active surface available to react with the engine exhaust.
3. Ceria or ceria-zirconia. These oxides are mainly added as oxygen storage promoters. [19]
4. The catalyst itself is most often a mix of precious metal. Platinum is the most active catalyst and is widely used, but is not suitable for all applications because of unwanted additional reactions and high cost. Palladium and rhodium are two other precious metals used. Rhodium is used as a reduction catalyst, palladium is used as an oxidation catalyst, and platinum is used both for reduction and oxidation. Cerium, iron, manganese and nickel are also used, although each has limitations.
~ 24 ~
In order to reduce the particulate matter, a filter is installed in both diesel and gasoline engines, accordingly named Diesel Particulate Filter (DPF) and Gasoline Particulate Filter (GPF), respectively. GPF are mainly developed to control particulate emissions from GDI engines that have been increasing in terms of population, driven by CO2 and fuel economy
requirements. The emission regulations have set PN (as well as PM) limits for GDI vehicles that are equivalent to those for diesels; thus, an effective particulate filter is needed. Current filters are designed to burn off the accumulated particulate either passively through the use of a catalyst or by active means such as in-cylinder port injection or a fuel burner which heats the filter to soot combustion temperatures. This is accomplished by engine programming to run (when the filter is full) in a manner that elevates exhaust temperature, in conjunction with late post injection, enriching the fuel that reacts with a catalyst element to burn off accumulated soot in the filter [20] or through other methods. This is known as "filter regeneration".
NOx control is currently focused on active Selective Catalytic Reduction (SCR), a means of
converting NOx with the aid of a dedicated catalyst into N2, and H2O. A gaseous reductant,
typically anhydrous ammonia, aqueous ammonia or urea, is added to the stream of exhaust gas and is adsorbed onto a catalyst. CO2 is a reaction product when urea is used as the
reductant. Pure anhydrous ammonia is extremely toxic and difficult to store safely, but needs no further conversion to operate within an SCR. Aqueous ammonia must be vaporized, in order to be used, but it is substantially safer to store and transport than anhydrous ammonia. Urea is the safest to store, but requires conversion to ammonia through thermal decomposition, in order to be used as an effective reductant [21]. Using urea as reductant, the reaction is the following:
4NO + 2(NH2)2CO + O2 → 4N2 + 4H2O + 2CO2
The ideal reaction has an optimal temperature range between 630 and 720 K, but can operate from 500 to 720 K with longer residence times. The minimum effective temperature depends on the various fuels, gas constituents, and catalyst geometry. SCR catalysts are made from various ceramic materials used as a carrier, such as titanium oxide, and active catalytic components are usually either oxides of base metals (such as vanadium, molybdenum and tungsten), zeolites, or various precious metals. The two most common designs of SCR catalyst geometry used today are honeycomb and plate. The honeycomb form usually is an extruded ceramic applied homogeneously throughout the ceramic carrier or coated on the substrate. Like the various types of catalysts, their configuration features typically advantages and disadvantages. Plate-type catalysts have lower pressure drops and are less susceptible to
~ 25 ~
plugging and fouling than the honeycomb types, but plate configurations are much larger and more expensive. Honeycomb configurations are smaller than plate types, but have higher pressure drops and plug much more easily. Catalysts are being characterized further for sulfur degradation and tolerance. Low temperature performance is enhanced with high catalyst loadings, enabled by high-porosity substrates. High temperature performance is improved using higher cell density catalysts.
Lean NOx Traps (LNT) method uses a catalyst [22] which consists of a storage component
and a precious metal supported on Alumina. The reaction takes place in 2 cycles (i.e.) lean and rich cycle. In the lean cycle, NO is adsorbed onto the storage component and oxidized to NO2 over the catalyst and stored in the form of nitrate at the surface. In the rich cycle, this stored NOx is released from the surface and reduced to N2 by HC, CO and H2 generated from incomplete combustion of fuels over the noble metal catalyst. Though the reactions are completed in 2 separate cycles, the overall reaction shows similarity with SCR reactions. Sulfur poisoning remains an issue which leads to deactivation of the catalyst [23]. Ammonia forming capability varies for different SCR catalysts. Pt/Al2O3 shows higher amounts of NH3 at high temperature, whereas Pd/Al2O3 is less affected by temperature variations [24]. LNT are also improving regarding sulfur tolerance and passive release of the NOx using only
temperature increases. LNTs are being combined with SCR in the light duty sector to reduce urea consumption and improve system low-temperature performance.
2.1.2.2. In-cylinder measures
Different strategies can be adopted, in order to change the combustion process to reduce the formation of emissions [25]. However, changes which decrease NOx often increase the engine-out emissions of PM, and vice versa. For example, lowering the maximum temperature reached during combustion reduces NOx emissions, but inhibits the complete oxidation of soot, thereby increasing particulate emissions. This is known as the NOx-PM trade-off and presents a critical challenge to emission reduction strategies. Changing the engine parameters may also affect fuel economy, requiring the optimization of NOx, PM, and fuel economy for the specific application. Hereafter, a list of interventions will be discussed.
Achieving good mixing of the air and fuel injected into the combustion cylinder reduces both NOx and PM emissions yet is difficult in the small, high-speed engines used in cars and light trucks. In-cylinder alterations seek to improve this process by optimizing parameters of the piston bowl - the small area of the piston where fuel is injected. Moving from 2-valves to
4-~ 26 4-~
valves per cylinder, altering the bowl geometry, and optimizing air motion (swirl) and fuel spray at different engine operating conditions will allow for reductions in NOx and PM. Delaying the start of fuel injection is known as injection timing retard. This can significantly cut NOx emissions by reducing the peak gas temperature, and is currently used as a method for reducing NOx emissions. However, injection timing retard has a negative impact on particulate emissions and fuel economy.
Homogeneous charge compression ignition (HCCI) is a form of internal combustion in which well-mixed fuel and oxidizer (typically air) are compressed to the point of auto-ignition. HCCI combines characteristics of conventional gasoline engine and diesel engines. Gasoline engines combine homogeneous charge (HC) with spark ignition (SI), abbreviated as HCSI. Diesel engines combine stratified charge (SC) with compression ignition (CI), abbreviated as SCCI. As in HCSI, HCCI injects fuel during the intake stroke. However, rather than using an electric discharge (spark) to ignite a portion of the mixture, HCCI raises density and temperature by compression until the entire mixture reacts spontaneously. Stratified charge compression ignition also relies on temperature and density increase resulting from compression. However, it injects fuel later, during the compression stroke. Combustion occurs at the boundary of the fuel and air allowing a leaner and higher compression burn. HCCI engines achieve extremely low levels of oxides of NOx without a catalytic converter.
Another promising method to reduce emissions of nitrogen oxides and particulates in direct injection diesel engines is water introduction into the combustion chamber. Various introduction strategies with their particular advantages and disadvantages with respect to emissions and applicability in different engine applications are possible. For obtaining maximum improvements, water has to be added at the right spot at the right time [26]. In conventional combustion processes of both Diesel and GDI powered engines, nitrogen oxides are mainly formed by the highly temperature-dependent Zeldovich mechanism. All water introduction strategies aim at reducing the temperatures in the combustion chamber. The effect of water introduction is two-fold: water reduces the temperature by its large enthalpy of vaporization and the larger heat capacity compared to dry air. Injection of emulsions places the water at the right spot in the spray region. As a result, NOx emissions can be reduced significantly, also offering the potential to reduce particulate emissions [27 – 28].
2.1.2.3. Upstream intervention
Differently from the solutions already descripted, upstream interventions aim to prevent the generation of polluting substances, improving combustion process, mostly due to
~ 27 ~
shortcomings of mixture formation between air and fuel inside different operational conditions.
One important solution that are being adopted is the introduction of a fraction exhaust gas mass in the combustion chamber. The Exhaust Gas Recirculation (EGR) system works by recirculating a portion of an engine's exhaust gas back to the engine cylinders. This dilutes and replaces the O2 in the incoming air stream and provides inert gases to combustion to act as absorbents of combustion heat to reduce peak in-cylinder temperatures [29]. Because NOx is primarily formed when a mixture of nitrogen and oxygen is subjected to high temperature, the lower combustion chamber temperatures caused by EGR reduces the amount of NOx during combustion. Therefore, the exhaust gas, added to the fuel, oxygen, and combustion products, increases the specific heat capacity of the cylinder contents, which lowers the adiabatic flame temperature. The maximum quantity of mass introduced is limited by the need of the mixture to sustain a continuous flame front during the combustion event; excessive EGR in poorly set up applications can cause misfires and partial burns. The impact of EGR on engine efficiency largely depends on the specific engine design, and, in Diesel engines, leads to a compromise between efficiency and NOx emissions.
A properly operating EGR can theoretically increase the efficiency of gasoline engines via several mechanisms:
• Reduced throttling losses. The addition of inert exhaust gas into the intake system means that for a given power output, the throttle plate must be opened further, resulting in increased inlet manifold pressure and reduced throttling losses
• Reduced heat rejection. Lowered peak combustion temperatures not only reduces NOx formation, it also reduces the loss of thermal energy to combustion chamber surfaces, leaving more available for conversion to mechanical work during the expansion stroke.
EGR is after not employed at high loads as it would reduce peak power output. This is because it reduces the intake charge density. EGR is also typically limited at idle because it would cause unstable combustion, resulting in rough idle.
Another adopted solution is the turbocharging of the engine that coupled with downsizing might increase efficiency, first of all by reducing relative impact of heat and friction losses – increasing the specific power of smaller engine. Further downsizing and increased power densities are key concept for achieving higher break thermal efficiencies and future emission legislations for internal combustion engines. These necessitate advanced turbocharger
~ 28 ~
technologies such as e-boosting systems in combination with fully variable valve trains and high compression ratios for optimized fuel consumption in part load operation.
In the intake system can also be installed a Swirl Flaps (SF), [30] small butterfly valves fitted just before the cylinder head intake ports. SF position is adjusted by an electrical or vacuum-actuated servo mechanism which is under the control of the ECU. In a typical implementation (4-cylinder engine, 1 port per cylinder) the flaps will be closed at idle speed, creating additional turbulence in the intake. As engine speed increases, the flaps are gradually opened until they are parallel to the airflow and present virtually no resistance. Their purpose is to ensure that the air entering the cylinder is sufficiently turbulent for good fuel-air mixing even at low engine speeds. This aids in providing more mixture formation energy, especially in load areas, where fuel injection pressure is limited.
One of the most effective solutions to improve the combustion process is the development of the fuel injection systems optimized for new fuel injection strategies. Choosing between various injection strategies are highly effective techniques to reduce emission from engines as injection characteristics have great influences on the process of combustion [31]. For example, for common rail diesel engines, the adopted strategy is characterized by several injections [32 – 34]:
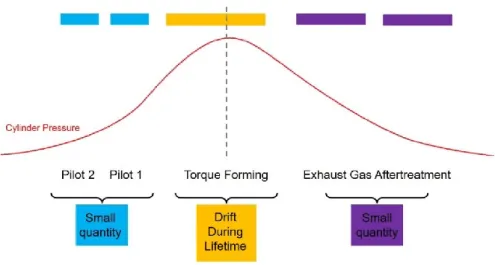
• Pilot this injection occurs in advance respect to the main injection. The purpose is to reduce combustion noise and realize a pre-reaction of the pilot quantity which reduces the combustion delay of the main injection. Splitting the pilot in two injection events, the second is also used for shaping the heat released rate curve, thus the pression inside the chamber.
• Main this is the so called “torque-forming” injection where the power of propulsion the vehicle is generated and peak of the chamber pressure is reached. • After Injection the purpose is the same of a second pilot in terms of shaping the
heat release rate and/or introduce additional mixture energy into the combustion chamber at late phase.
• Post Injection this injection is done to have an enrichment of the exhaust that ensures thermal management, e.g. the regeneration of the particulate filter.
Experiments [35] have shown that with high pressure multiple injections (two or more injection pulses per power cycle), the soot-NOx trade-off curves of a diesel engine can be shifted closer to the origin than those with the conventional single-pulse injections, reducing both soot and NOx emissions significantly.
~ 29 ~
2.2.
Fuel Injectors
As mentioned, fuel injectors play a key role for ICE’s in reducing emissions to meet future emission standards, as well as achieving other performance parameters like power/torque fuel economy and combustion noise.
The most important innovation of the injection systems has been the introduction (from the 1980s onward) of the electronic control of the injector’s opening and closing; using a solenoid or a piezoelectric element the injection event is driven by means of either an electric signal without a mechanical/hydraulic connection to the engine. The injectors need to fulfil the following targets:
• Precise dosing injection of the correct quantity of fuel
• Accurate phasing no delay respect to the selected injection window
• Consistent uniformity uniform distribution of the fuel delivery every cycle and for every cylinder
• Optimal mixing correct mixture between fuel and air in order to foster the combustion process with the other key parameters like chamber geometry and charge motion
In the next section the state of the art of fuel injection system is discussed and the most important inaccuracies highlighted. Finally, the compensation needed, in order to correct these limits, will be pointed out.
2.2.1. State of the art of injectors
The engine combustion process is mainly determined by in-cylinder conditions and fuel injection strategies. Fuel injection is the introduction of fuel in an internal combustion engine by means of an injector. All diesel engines use direct fuel injection by design. Petrol engines can use gasoline direct injection, where the fuel is directly delivered into the combustion chamber, or indirect injection where the fuel is mixed with air before in the intake manifold.
~ 30 ~
Depending on the design and the layout, it is possible to define different injection system schemes:
• Single point or Throttle Body Injection (TBI) it is composed of one or two fuel injector nozzles in the throttle body, which for spark-ignited engines is the throat of the engine’s air intake manifold.
• Port or Multi-Point Fuel Injection (MPFI) Multi-point fuel injection devotes a separate injector nozzle to each cylinder, right outside its intake port, which is why the system is sometimes called port injection. Shooting the fuel droplets this close to the intake port almost ensures that it will be drawn completely into the cylinder. The main advantage is that MPFI meters fuel more precisely than do TBI designs, better achieving the desired air/fuel ratio and improving all related aspects. Also, it virtually eliminates better the possibility that fuel will condense or collect in the intake manifold.
• Sequential Fuel Injection (SFI) Sequential fuel injection, also called sequential port fuel injection (SPFI) or timed injection, is a type of multi-port injection. Though basic MPFI employs multiple injectors, they all spray their fuel at the same time or in groups.
• Direct Injection More common in diesel engines, direct injection is starting to grow in gasoline engine designs in terms of vehicles number nowadays and are common these days. Again, fuel supply is at higher pressure levels and metering is even more precise than in the other injection schemes, and the direct injection gives engineers yet another variable to influence precisely how combustion occurs in the cylinders.
In MPFI and GDI systems the injectors are supplied with fuel from a common rail and the injector pulse width depends on the input signals seen by the ECU.
~ 31 ~
Figure 2.6 - Schematic of a gasoline port fuel injector
The shown port fuel injector in Fig. 2.6 is composed of two different main sectors, divided by a valve (pintle valve). In the upper one the fuel is maintained in pressure using a pump that pressurizes the rail up to 5 bars, feeding each injector. In order to avoid contaminations of the fuel, a filter is installed in the upper feeding channel. The valve is connected with the needle and it is kept in position by mean of a spring that acts between the pintle valve and the fuel filter. Electrifying the solenoid, a magnetic field is generated; the pintle valve is lifted and the fuel is free to flow. Thus, the needle opens the holes of the tip and the fuel flow into the intake manifold of port is engaged.
In diesel engines, nowadays common rail injection systems (Fig. 2.7) have affirmed their predominance in the market in the last ten years. High Pressure Common Rail (HPCR) fuel injection systems, typically employed in light and medium-duty Diesel engines, provide an effective way in fuel injection quantity and injection timing control primarily due to their high rail pressure [36 – 37]. Common rail fuel systems are equipped with a closed-loop high pressure control-system that stabilizes the rail pressure within a relatively small margin to the nominal value specified by the ECU for a given engine operating condition. The pump maintains the rail pressure by continuously delivering fuel to the common rail. This pressure is monitored by a pressure sensor and the difference between the nominal rail pressure value and the measured one is the input signal for the controller. There are several different
~ 32 ~
approaches to control the pressure in the common rail. One typical way is to supply more fuel than is needed to the common rail and use a high pressure regulator in the high-pressure circuit to spill the excess fuel back to the fuel tank.
Figure 2.7 - Example of a Diesel common rail injection system (Source: Technical overview of common rail fuel systems - AK Training)
The design of a common rail diesel injector is different from a gasoline injector, mostly due to the higher pressure that feed the injector (up to 3000 bar in the last generation of common rail engines). As shown in Fig. 2.8, the fuel pressure is supplied to the injector needle seat area and also to a small chamber above the injector needle, also called control volume, via a calibrated inlet port [38]. Three different forces act on the injector needle:
• Elastic force (Fe), in the closing direction, due to the spring installed on the needle.
The spring is installed, in order to close the injector when the feeding pressure is zero.
• Force (Fc) in the closing position due to the pressurization of the control volume
• Force (Fo) in the opening direction due to the pressurization of the injector needle
seat
When the solenoid is energized, the valve discharges the pressure in the control volume and the fuel returns to the fuel tank via the injector leak back ports. This creates a forces disequilibrium at the needle:
~ 33 ~
Thus, the needle is lifted and the fuel is delivered through the nozzle, injecting the requested quantity.
Figure 2.8 - Schematic of a diesel common rail injector (source: Bosch)
Piezoelectric common rail injectors are also used instead of solenoid ones. The operation of piezoelectric injectors is quite similar to that of solenoid injectors, with the difference that they have a ceramic core. However, although for this type of actuation is feasible, manufacturers had to circumvent a certain number of problems. In the first place, the dilation of a piezoelectric element is extremely low. To obtain a useable degree of displacement, it requires a stack ceramic disks to form the active element of the injector. To actuate them, an impulse of a hundred volts is applied to them and a tiny lever arm amplifies their movement. Moreover, as with electromechanical injectors, the piezoelectric disks do not directly command the needle movements, but they activate a small valve. The major advantage of piezoelectric injectors is their speed of operation and the repeatability of the movement of the valve. The dilation and retraction movements of the piezoelectric elements are almost instantaneous.
Most injectors have a specific code that must be programmed in the engine controller. The code is related to the nominal flow rate of the injector and it allows the ECU to correct the injection quantity to compensate for manufacturing tolerances. This is the first symptom of inaccuracies during the production process of the fuel injectors that lead to an unexpected non-optimal behaviour of the injector during operation. In the next section, the main inaccuracies will be explored and analysed, in order to detect the weak points of these components.
~ 34 ~
2.2.2. Inaccuracies of the injectors
Accurate fuel injection quantity control [39] is of importance in improving engine attributes like power output, combustion efficiency and reducing engine-out emissions. Conventional internal combustion engines are equipped with fuel injectors, under control of an ECU. The operation of an injector is controlled by means of a nominal characteristic curve correlating Energizing Time (ET) values with corresponding injected fuel quantity values. Thus, engines fuel injection quantity control algorithms are mostly based on pre-calibrated tables, which may not adequately handle the effects of disturbances, either coming from production or from aging effects during operation. Particularly, there are several factors that can lead to fuel injection quantity error; the most important are three:
1. Fuel pressure oscillation/Rail pressure waves
Using multiple events injection with a comparably short interval between injection pulses, the effect of pressure wave in fuel pipe on the subsequent fuel injections must be paid attention [40]. Due to the fast opening and closing of injector needle, the injection pressure waves are generated in the duct of CR injectors, and connecting high-pressure pipe and the injection pressure will no longer remain as constant as optimally required during the whole injection event [41 – 43], to ensure appropriate fuel metering. These pressure waves then push up or down the subsequent injection amount significantly and this makes the calibration of the subsequent injection fuel amount very difficult. Under different operating conditions, these influences become extremely serious [44].
Figure 2.9 - Rail pressure during different injections (Technology focus - Diesel Common Rail - Pressure Wave compensation, Autoelex)
Due to the high number of influencing parameters it is an unsolved problem to analytically compute the time response of the pressure at the injector with sufficient accuracy. But as the
~ 35 ~
exact pressure progression at the injector is of importance for the accuracy of the injected fuel mass and therefore for the combustion process, its knowledge could significantly improve the efficiency and reduce the emissions of the engine. To solve this problem, a sensor based on the magneto-elastic effect was developed [45]. Conventional pressure sensors that work in a high dynamic range are often based on the piezo-resistive effect and are unaffordable for mass use in automobiles. The advantage of the ME-sensor over these conventional sensors is its low cost design and that it is working noninvasively. The disadvantage is a lower signal to noise ratio and its sensitivity to disturbances. The continuous monitoring of the pressure at the injector inlet permits to deliver information to the ECU and thus adjust the injection parameters, for a better control the injected fuel quantity.
2. Non-linearities in low quantity region
The second main factor of larger inaccuracy is the non-linear region in small fuel quantity area; this region is called “ballistic region” bacause the injector needle is in a ballistic flight condition and it is characterized by a partial stroke of the needle. This means that the ET is not long enough to lift completely the needle, operating in highly transient conditions. Therefore, it is not possible to calculate the correct ET for small quantity pulses because each injector behaves differently, depending on the reaction of this transient phenomena (Fig. 2.10).
~ 36 ~
This problem can affect both gasoline and diesel injectors, characterized by a solenoid to command the injector.
In gasoline fuel injectors, the calibration point is chosen from the linear region and the delivered quantity measured at the end of process, in order to couple injectors with a similar behaviour in a batch, mounted in each engine. The process error is quite low and nominal characteristic curve can upload in the ECU, cutting the low delivered fuel region during engine operation. Nowadays, the restriction in terms of fuel consumption and CO2 emission require a reduction of the injected quantity and the use of the low quantity region cannot be avoided anymore. Thus, the operational range of the injector has been extended even to the ballistic region and the calibration process has to be modified in order to assure small error even in this portion of curve.
Different solutions are being adopted depending on the manufacturer and on the product. In some cases, the energizing time has been correlated with a so called "hydraulic" time that take into account the hydraulic opening and closing delays of the injector. The relation between injected quantity and hydraulic time is nearly linear, permitting a definition of a gain/offset, valid along the entire operational range.
Figure 2.11 - Characteristic curve of a CR injector without upper needle stop
In diesel application, at the end of line of the fuel injector production process, each supplier measures the injectors specifically and release an appropriate code for each injector to document the difference to the nominal specification; this code covers the deviation of the
~ 37 ~
injector characteristic in order to reach the injected quantity target. The correction, that comes from the injector code, is in many cases based on the assumption of a linear behaviour of the injector. The use of the pre-calibrated tables and the correction from the injector code to convert the requested quantity in ET could lead to errors in the real injected quantity in the low quantity region. For instance, an incorrect pilot injected quantity can influence the following aspects:
• Pilot Injection too small noise increment • Pilot Injection too big PM increment
• Misfire noise and emissions increment, high fuel consumption
3. Injector aging/Nozzle holes coking/Deposit formation
Another term of inaccuracy is the changing of the behaviour of the injector during the lifetime. During vehicle lifetime, a drift in the actual injected fuel quantity compared with the estimation from the ECU can occur. The root causes of the deviation can be related to:
• Injector drift by wear or deposit • Rail pressure sensor drift • Oxygen sensor drift
• Fault on the injection system
The last three terms have an indirect impact on the injection quantity, due to a wrong input that causes an incorrect command pulse sent to the inector.
Focusing on the injectors, a modification in the characteristic curve of the injector has been observed. As explained before, the ECU determines the fuel quantity to be injected from the injector nominal characteristic curve. This nominal curve is referred to a sample injector, operating in nominal conditions and generally such curve is supplied by the injector's manufacturer. The quantity of fuel actually injected by a fuel injector may deviate from a target or nominal quantity, due to production tolerances or to ageing drift of the injector. For all of these aspects, different strategies for control and correction have been developed, depending mostly on the requested quantity; in pilot and post-combustion injection, the main problem is the non-linear region while in the main injection, where the torque forming takes place, the drift of the injector during the lifetime has a big role.
~ 38 ~
Figure 2.12 - Different inaccuracies that have an influence in each injection
In the next section, some fuel delivery compensation strategies will be discussed, in order to highlight the efforts necessary to overcome current limits of injectors.
2.2.3. Fuel delivery compensation strategies for ICE vehicle
The aim of these learning functions is to improve accuracy and reliability of the fuel delivery from the injectors and the oxygen estimation on the exhaust, both using the crankshaft sensor, precalibrated models and compensating the oxygen signal from the lambda sensor.