UNIVERSITY
OF TRENTO
DEPARTMENT OF INFORMATION AND COMMUNICATION TECHNOLOGY
38050 Povo – Trento (Italy), Via Sommarive 14
http://www.dit.unitn.it
CBR NAÏVE INTERACTION IN A WEB-BASED SYSTEM
FOR TOURISM
C. Berruquier, E. Blanzieri
and A. Ebranati
March 2005
CBR Naïve Interaction in a Web-Based System
for Tourism
C. Berruquier
b, E. Blanzieri
a , c, and A. Ebranati
aa
ITC-irst Povo, Trento - Italy
b
Dipartimento di Psicologia Università di Torino Italy
c
Present address: Department of Information and Communications
Technology, University of Trento
via Sommarive 14, I-38050 Povo Italy
[email protected]
Abstract
The paper presents an empirical research whose goal is to study the interaction between a Case-Based Reasoning (CBR) system and users without knowledge of CBR. This interaction, that here is called CBR naïve interaction, can occur frequently in web-based CBR systems and consequently in CBR-based e-commerce systems. The research was led during the usability assessment of COOL-TOUR a web-based CBR system for tourist culture support. The paper describes methods and results of the usability tests as well as a preliminary experiment. The quantitative results are not final but qualitative evidence suggests that the user adopts different models of interaction.
Keywords: Case-Based Reasoning, Tourism, Bicycle, User evaluation
1
Introduction
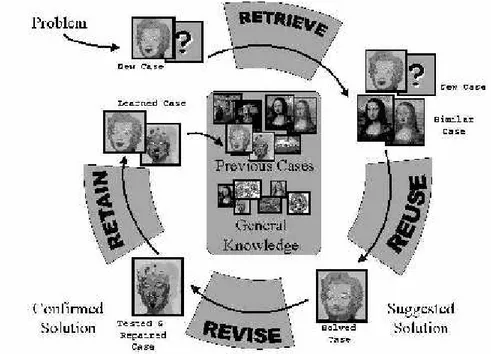
Case-Based Reasoning Systems architecture, elegantly illustrated in the Case-Based Reasoning cycle (Aamondt and Plaza, 1994) has been exploited in several applications on different domains. Case-Based Reasoning is a technique for problem solving that relies on the reuse of solutions devised for similar problems. Problems provided with revised solutions are considered to be cases, the cases are retained in a structured collection of cases called case base. The previous cases are retrieved from the case base depending on the similarity with the problem at hand. The following sequence of operations: To retrieve a case, to reuse its solution, to revise the solution and possibly to retain the case, forms the CBR cycle. The success of Case-Based Reasoning (CBR) in practice is partly due to the fact that its basic functionality is easy to explain and easy to grasp. The user, and before the user the founding agency, can understand very easily the architecture of the system ignoring technical details and relying only on the intuitive meaning of concepts like similarity retrieval, adaptation and maintenance of the case base. This is a well-known fact in the research and practitioners’ communities and it can be explained by means of the cognitive plausibility of CBR (Kolodner, 1993).
The intuitiveness of the architecture suggests that Case-Based Reasoning is also an effective interaction metaphor. In the tradition of Human-Computer Interaction studies (Dix et al., 1998) the role of the interaction metaphor is important: the intuitive model a user has of the system determines the usage itself. As a consequence, the effectiveness of the system depends on how its interface reflects the intuitive model of the user (Norman, 1988). For a Case-Based Reasoning system this is straightforward: a user who grasped the meaning of the CBR cycle has a good model of the functionality of the system. However, there are cases in which it could be hard to explain the CBR cycle to the user. This is the case of some web-based CBR applications where the on-line user has not any a priori knowledge of CBR, there is little time to capture his/her attention and nevertheless the operations the user is allowed to do coincide with the basic operations of the CBR cycle. The main difficulty is that the attention of the user is focused on the satisfaction of his/her informative goals and not on learning the system features. Obviously in a web-based application it is always possible to provide the user with fancy multi-media documentation but –given that the need for instructions is a symptom of bad design– the hard-to-use well-documented system will not be used by those with little skills and motivation.
Some e-commerce applications of CBR can present the interaction characteristics described above. For example, a user can face a system that provides similarity-based retrieval of products and case-based configuration support without knowing the CBR cycle. This approach in tourism domain is presented in Ricci and Werthner, 2002 and Ricci et al, 2003. As a second example, a system aimed to support community building by means of sharing knowledge about experiences of products or services can present a range of functions covering the whole CBR cycle (Cavada et. al, 2003). Again, cases can be selected and adapted by users without any a priori knowledge of CBR.
The general perspective of this work is to start to consider problems arising when the CBR system provides the basic CBR functions and the users do not know the CBR cycle. As a consequence, the users are without an intuitive model of the system. For this CBR naïve interaction several research questions arise: Is it necessary to know the CBR cycle for an effective use of the system? Or does the cognitive plausibility of the approach suffice? Does the user expect a system to be able to reason by cases or not? Does the user understand that the knowledge is provided by other users? How should an interface be designed to suggest the right intuitive model? Is there any relation between the use of the system and other well-established interaction metaphors like those used in editors, information retrieval systems and search engines? This list is far from being exhaustive.
This work presents an empirical research aimed to give some preliminary answers to the problems of CBR naïve interaction. The research was developed during the usability assessment of an improved version of COOL–TOUR (Blanzieri and Ebranati, 2000) a web-based system aimed to support tourist culture, namely building
the community of the tourists that use a particular area. The main goal of the system is to provide access to the tourist goods enhancing confidence and fidelity. The project team assessed the usability by means of usability tests (Rubin, 1994; Nielsen, 1999), a common practice in the realization of software projects within a spiral methodology where they can be an important step at the end of each phase of requirements analysis, design and development. The usability tests of COOL-TOUR were a planned routine step between two prototyping phases. In order to gain some insight the usability tests were administered to two groups of potential users and before the session a simple interactive animation of the CBR cycle was shown only to one of the groups. The results suggest that during a CBR naïve interaction the user exploits different models of interaction. The paper is organized as follows: the next section briefly describes COOL-TOUR emphasizing the role of the interface, the central section describes material, methods and results of the usability test and finally, the last two sections are devoted to lesson learned and conclusions.
2
COOL-TOUR
This section briefly describes the prototype version of COOL-TOUR, see (Blanzieri and Ebranati, 2000) for the details, a system aimed at exploiting a CBR approach for an e–commerce system. The basic idea of COOL-TOUR is to support the development of the virtual community of the consumers of goods or services. The approach is well suited in the case of goods or services with a complex or preference–driven use, e.g., goods needing some form of configuration or aggregation. That’s the case of tourist goods where the aggregation of basic products in complex products (a travel package, an integrated destination or a tour) is the common way of producing. COOL-TOUR exploits CBR technology to present the results of previous aggregations done by other users or by professionals.
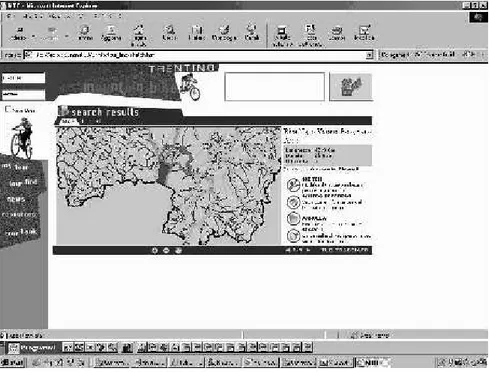
The prototype system supports choice and scheduling of Mountain Bike Tours (a snapshot of the interface is shown in Figure 1). Here, a tour is intended to be a sequence of stretches on some road graph in a particular geographic area. From the tour it is possible to point to information about food and accommodation.
The CBR approach affects the basic interaction of the user with the system. The user can draw a tour on the map and store it among her personal tours or she can use it to retrieve similar tours entered by other users. The system also supports the editing, namely the adaptation, of the retrieved case. The drawing on the map relies on a sketch-based interface. The user interacts with an applet with GIS capabilities: a basic set of commands (zoom-in, zoom-out, pan and fullwidth) and a drawing function that permits to draw a scribble on the map. From the scribble it is possible to do a spatial similarity search of tours. The tour can be adapted by scribbling and rubbing on the map. The tour is also described by other characteristics like approximate duration, difficulty, and so on. With these data the user can do a feature similarity search.
The system presents the information of the tour in a structured format: spatial description, feature description, text description, images and nearby locations. There are two different similarity search modalities (spatial and features) as well as two different results presentation modalities (spatial and list).
3
Usability test
The goal of the usability tests are two: to assess the usability of the system in order to gain information for the developing of the next version and to test the role of the knowledge of the CBR cycle on the usage in order to study the CBR naïve interaction. While the first two goals are directly related to the developing of COOL-TOUR project the second has a more general scope.
The usability tests consisted in the execution of an ordered list of 12 tasks : find a tour in the Trent area (task 1), log-in (task 2), find a tour in the Garda Lake area (task 3), find a not–too-hard tour with a length of more and less 60 km (task 4), find another one (task 5), examine all the other results of the search (task 6), read a description of an interesting tour (task 7), find an hotel in the nearby (task 8), see all the tours of the last search together (task 9), modify a tour (task 10), change its description (task 11), save the tour (task 12). For each task one or more conditions of fulfillment were defined.
Some of the tasks are related directly to CBR. Task 1 and task 3 are spatial similarity search tasks, the users are supposed to use the zoom-in, zoom-out and pan functionality and the sketch-based interface in order to search a similar tour starting from a scribble or from a selected area. Task 4 is a feature similarity search task, the users are expected to fill in the form and submitting the query. Task 10 and task 11 and task 12 are spatial and textual adaptation tasks respectively, the user should go in ”modify” mode, edit the tour and save it. Some of the tasks were less related to CBR and more on the organization of the standard part of the application. Task 2 is simply the log-in whereas Tasks 5-9 involves navigation of data and results in different modalities.
The material of the test includes also two simple questionnaires (Pre-test questionnaire and Post-test questionnaire) and an animation. The first questionnaire asks general questions: age, sex, education, bicycle use frequency, local geography, Internet use frequency and familiarity with CBR. The second questionnaire asks a direct evaluation about the system, its usability, suggested improvements, pros, cons and comments. Finally, a simple interactive animation shows an example of the CBR cycle in a domain not related to tourism. The animation was realized by means of MS-PowerPoint (Figure 2).
Fig. 2.Final frame of the animation. The animation illustrates step by step
the CBR cycle. The example shows how the Mona Lisa with moustache by Marcel Duchamp can be used to adapt a Marilyn Monroe by Andy Warhol
The 12 participants were selected among temporary research personnel (consultants and researchers) at ITC-irst, they were simply asked to volunteer for the usability tests of a software prototype. None of them was involved before in the COOL-TOUR project nor knew anything about it. They did not attend preliminary presentations of the system nor sessions of workshops on CBR. The participants were on average 28,6 years old, three females and nine males. One had a PhD, nine had master’s degrees and the others college degrees. From the pre-test questionnaire, it was determined that three participants did not ride bicycle, 11 had substantial knowledge of local geography, and although virtually all of them were heavy Internet users (only one spent less than two hours a week surfing the web), only two had ever used the net to buy something. For the question ”Do you know what Case-Based Reasoning Is?” two participants answered ”I have a clear idea of it”, two others selected ”I have a vague idea about it” and the others claimed they knew nothing about it. The participants were randomly assigned to two different groups A and B. The group A ended up containing those who surfed the net slightly more and rode bicycle slightly less than the group B.
The usability test session took place in a quiet room of a laboratory with no windows and was recorded with the participants’ permission. The camera was visible. The participants entered the room one by one. The first experimenter made clear the test was on the system and not on them and that they could suspend or abandon the session at any time. The experimenter also asked them to sign a nondisclosure agreement in order to prevent communication between the participants. The participants were administered the pre-test questionnaire. The first experimenter invited the participant of the group B to watch the short interactive animation of the CBR cycle, whereas nothing was shown at the participants of the group A. The second experimenter gave the participants the list of 12 tasks and asked to execute the tasks in that order. They were told that they had plenty of time. The second experimenter assisted the participant intervening when the participant entered mock-up parts of the systems. The other experimenter observed taking notes and times. At the end of the session the participants were administered the post-test questionnaire and then briefed.
The data collected are both quantitative and qualitative. Table 1 presents execution times (in minutes) of the tasks. The source is the notes of the experimenters. Table 2 reports the average execution times of groups A, B and the average execution time of all the participants. Note that the differences between the times of the two groups are not significant. Finally, Table 3 presents the evaluations of the participants on the system and its usability.
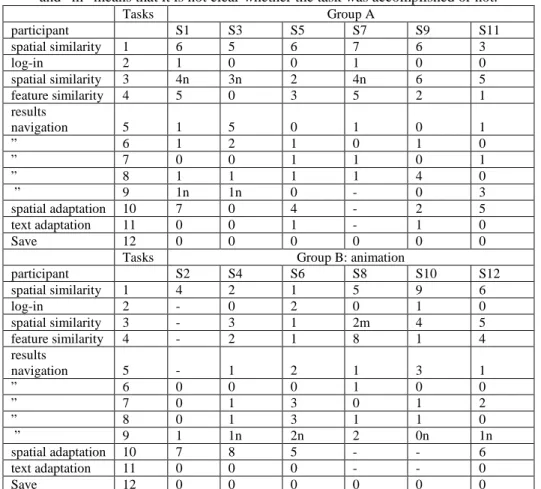
Table 1. Time in minutes for the execution of the different tasks. The 12 participants are denoted bt S1-S12. ”0” means that the task was executed in less than a minute, ”n” means that the task was not accomplished, ”-” means that the data are missing,
and ”m” means that it is not clear whether the task was accomplished or not.
Tasks Group A participant S1 S3 S5 S7 S9 S11 spatial similarity 1 6 5 6 7 6 3 log-in 2 1 0 0 1 0 0 spatial similarity 3 4n 3n 2 4n 6 5 feature similarity 4 5 0 3 5 2 1 results navigation 5 1 5 0 1 0 1 ” 6 1 2 1 0 1 0 ” 7 0 0 1 1 0 1 ” 8 1 1 1 1 4 0 ” 9 1n 1n 0 - 0 3 spatial adaptation 10 7 0 4 - 2 5 text adaptation 11 0 0 1 - 1 0 Save 12 0 0 0 0 0 0
Tasks Group B: animation
participant S2 S4 S6 S8 S10 S12 spatial similarity 1 4 2 1 5 9 6 log-in 2 - 0 2 0 1 0 spatial similarity 3 - 3 1 2m 4 5 feature similarity 4 - 2 1 8 1 4 results navigation 5 - 1 2 1 3 1 ” 6 0 0 0 1 0 0 ” 7 0 1 3 0 1 2 ” 8 0 1 3 1 1 0 ” 9 1 1n 2n 2 0n 1n spatial adaptation 10 7 8 5 - - 6 text adaptation 11 0 0 0 - - 0 Save 12 0 0 0 0 0 0
The qualitative data was collected from the observations and briefings. Several interface faults emerged clearly from the observations (wrong position of buttons, names, misunderstandings). The participants demonstrated very different styles of navigation (some surfed the entire site at the beginning, others were task-driven, others started by reading everything sequentially). Querying a database is the basic interaction model the participants seemed to have towards the system. Observation suggests that the sketch-based modality was enjoyed.
Table 2. Average time in minutes for the executed tasks, namely taking into account only the accomplished tasks. ”*” indicates the tasks that present incomplete executions. The differences between the average of groups A and B are not significant (p > 0.05) at the Mann-Whitney nonparametric test for independent
groups.
Description Tasks Groups all participants
A B Spatial similarity 1 4.05 5.5 5 Login 2 0.06 0.03 0.05 spatial similarity 3 3 4.03 3.07 feature similarity 4* 3.02 2.06 2.09 results navigation 5 1.06 1.03 1.05 ” 6 0.02 0.08 0.05 ” 7 1.02 0.05 0.08 ” 8 1 1.03 1.02 ” 9* 1.05 1 1.03 spatial adaptation 10 6.05 3.06 5.01 text adaptation 11 0 0.04 0.02 Save 12 0 0 0
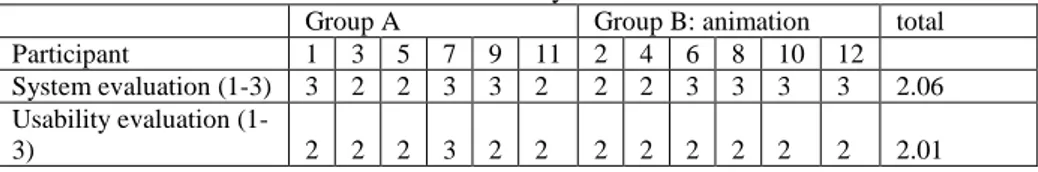
Table 3. Evaluation of the system and of the usability done by the participants after the usability tests.
Group A Group B: animation total
Participant 1 3 5 7 9 11 2 4 6 8 10 12
System evaluation (1-3) 3 2 2 3 3 2 2 2 3 3 3 3 2.06 Usability evaluation
(1-3) 2 2 2 3 2 2 2 2 2 2 2 2 2.01
Few participants used the sketch-based modality only for scribbling the area of interests. Almost all of them traced the sketches correctly on the roads. Some participants interacted with the system like it was a router: scribbling the starting point and the ending point. Several participants expressed surprise reading on the tasks list about the possibility of modifying the tour. Some of the participants thought aloud and a lot of them asked questions. The experimenter answered only the ones referring to marginal or mock-up parts of the system refusing to answer the others. The presence of the camera influenced and conditioned the participants who found its presence funny and joked about it.
From the briefings emerged that a lot of participants asked about the meaning of the animation and how it was correlated to the system. Some of the participants who were frequent bicycle users asked if the system was available. Some others asked if the stored tour was available in the system. Finally the quality of the map was criticized.
As shown in Table 3 the usability was judged average and the majority of the participants enjoyed the system. The average execution time reported in Table 2 is
acceptable at the present phase of the project. The irrelevance of the animation is confirmed by qualitative data and partially by quantitative data. In fact, the differences between the averages of the two groups shown in Table 2 are not significant. The nonparametric test was not sensitive enough for getting a difference between the execution times of the two groups. So it is not possible to exclude an effect on users that watch an introductory animation. If the effect is weak more extensive experimentation is necessary. On the other hand, the animation could not be the right treatment for inducing a partial and quick comprehension of the CBR cycle. The data of Task 3 (considering the latency for the incomplete tasks not taken in account in Table 2) present the biggest difference between the two groups: 3.8 minutes for the group A vs. 2.3 for the group B. The difference is still not statistically significant so no statistical inference can be drawn.
Considering all the participants independently from their assignment to the groups leads to other considerations. Table 1 shows that the first spatial similarity task (Task 1) was completed by all the participants whereas the other one (Task 3) was completed only by half of them. The tasks are basically the same so maybe the participants got the first task completed without being able to repeat the performance. The role of previous knowledge of CBR is not clarified by the data. Participants who declared to have vague or clear ideas about CBR (S3, S7, S8, S12) scored rather long times in performing Task 1 and three of them were not able to complete Task 3. The data seems to suggest that the users with some knowledge of CBR do not perform better than the other ones. That seems to be counterintuitive. A possible interpretation could be that the attention of the participants focused more on the novelty aspects of the sketch-based interface than on a model of the whole system. Alternatively, the users could be goal-driven and could adopt different interaction models in different phases. Table 1 shows that the task on feature similarity (Task 4) is easier than the one on spatial similarity. Almost all the participants accomplished it. In this case the task is similar to a normal query specified in a form as it is commonly found in web-based querying of databases, search engines or information– retrieval systems. On the other hand, the possibility to adapt the tours seems to be very surprising to the participants. Spatial adaptation, namely modifying the tour via sketch-based interface (Task 10) is a difficult task but at least nine of the participants completed it. Instead text adaptation (Task 11) appeared to be straightforward. The participant does not expect the possibility of modifying and adapting what he/she sees on the screen. Once the idea is grasped the user seeks for ways to perform the modification like he/she is using an editor.
Finally, the standard part of the interaction (log-in, save, navigation among the results, namely Tasks 2,12 and 5-9) were executed quickly. With the only exception of Task 9 that was probably ill-defined. The design of the standard part of the site appeared to be qualitatively adequate.
4
Lessons Learned
The usability assessment of COOL-TOUR gave the chance to conduct an exploratory study on CBR naïve interaction, namely the interaction between a CBR system and users without knowledge of the CBR cycle.
From the point of view of the usability assessment of COOL-TOUR whose goal was to get suggestions on how improving the system, the usability tests were a success. Several errors that were diffuse among the participants and generated by interface faults emerged. This information will be exploited in the next phase of the project. From the point of view of study of CBR naïve interaction the research suggested that different models of interaction are exploited by the user. The problem if CBR is easy to grasp with or without an explicit introduction to its concepts and phases is still open. However, it seems that the users that are without the correct model of the system, apply the ones they know: query of databases, information retrieval, routers, search-engines in the phase of similarity search and editor in the adaptation part. During the similarity search phase the interaction models are of the type information– pull: the user asks for information and consumes it. Switching to an information– push modality where the user provides information adapting the case, requires an effort. The direct adaptation of the current case followed by the possibility of saving it seems to be unnatural. The user does not seem to see this option and when he/she saw it the user appears to adopt the same interaction model he/she would use with an editor.
This suggests some solutions. If the editor is the model that the user sees as more suitable in the adaptation phase, maybe giving the possibility of copying the tour in a private area could be useful. A metaphor similar to the trolley for e-commerce could also be useful. The user will edit the private case if needed. Alternatively, it would be possible to present the case directly in the modification mode.
Carrying on the research suggested way to study empirically a CBR naïve interaction. In this perspective, although the usability test was well–suited for achieving its project-related goals, alternative experimental designs could be better. In fact, the not-significant difference observed between the two groups A and B needs further investigation and could be possibly explained by the small number of participants. In an alternative experimental design it could be possible to assign a general task instead of a list of tasks or simply to permit and observe a familiarization phase. Other points that need improvements are the methods for testing or inducing an initial CBR knowledge possibly using CBR systems explicitly built for experimental purposes. This experience suggests that the study of the CBR naïve interaction is not simply an interface problem. There are cases in which the best model a user can have of a CBR system is the CBR cycle. COOL-TOUR is one of these because it uses explicitly the CBR modality to support the community knowledge. In these cases the role of the
interface should not be to hide the internal CBR architecture but to show it to the user. Finally, it is evident the need to design a web-based application thinking at the different styles of navigation of the site directly depending on the different goals of the users in the different phases. How to do it with a CBR system is not clear. Some exploration and visualization modality of the whole case base in the tradition of Case-Based Exploration Tool CBET (Ricci et al., 1997) could possibly help.
5
Conclusions
The usability assessment of COOL-TOUR permitted to start to explore the problems related to what was here called CBR naïve interaction: the interaction between a CBR system and users who do not know the CBR cycle. To the best knowledge of the authors this is the first attempt to study explicitly such interaction whereas empirical studies on CBR system were already conducted with CBR-aware users, see for an example (Munoz-Avila et al., 1999). The work is exploratory and introduces an inter- action problem that can be very common in CBR-based e-commerce systems. The fact that watching an animation of the CBR cycle does not modify the performance in a significant way and also that the user with previous knowledge about CBR does not perform better than the other ones, is counterintuitive.
As a possible explanation the observation suggests that during a CBR naïve interaction the user exploits different assessed models of interactions. In this case was noted an effort required to pass from the information–pull models of the retrieval phase to the information–push models of the adaptation phase. In other words a user involved in a CBR naïve interaction is not aware of the CBR cycle but see the system as an information seeker integrated with an editor. This hypothesis requires further empirical validation. Moreover, it is important to note that the pool of participants was strongly biased towards technology-aware kind of people. Extending the findings to the target population (namely, the people riding bicycle in the local area with internet access) would be risky.
Given the characteristics of simplicity and standardization required by the web applications (Nielsen, 1999) the comprehension of CBR naïve interaction can be critical in the design of CBR Web-based systems. Further research and creative design activity are required.
References
A. Aamodt and E. Plaza. (1994) Case-based reasoning: Foundational issues, methodological variations, and system approaches. AI Communications.
J Dix Alan et al. (1998) Human-Computer Interaction. Prentice Hall.
E. Blanzieri and A. Ebranati. (2000) Supporting tourism culture via cbr. In Enrico Blanzieri and Luigi Portinale, editors, Advances in Case-Based Reasoning. Springer, Berlin, 2000.
Cavada, N. Mirzadeh, F. Ricci and A. Venturini. (2003) Interactive Itinerary Planning with Trip@dvice. In proceedings of the Ninth IFIP TC13 International Conference on Human-Computer Interaction, September 1-5, 2003 - Zürich, Switzerland.
J.L. Kolodner. Case-Based Reasoning. Morgan Kaufmann, Calif., US., 1993.
H. Munoz-Avila, D. McFarlane, D.W. Aha, J. Ballas, L.A. Breslow, and D. Nau. Using guidelines to constrain interactive case-based planning. In Klaus-Dieter Altho , Ralph Bergmann, and L. Karl Branting, editors, Case–Based Reasoning Research and
Development. Springer, Berlin, 1999.
J. Nielsen.(1999) Design WEB usability: the practice of simplicity. New Riders Publishing. D. A. Norman.(1988) The psychology of everyday things. Harper Collins.
F.Ricci P.Avesani, A.Perini. (1997) CBET case base exploration tool. In Proceedings of the Fifth Congress of the Italian Association for Artificial Intelligence (AI*IA 97), Roma. F. Ricci, A. Venturini, D. Cavada, N. Mirzadeh, D. Blaas and M. Nones, Product (2003)
Recommendation with Interactive Query Management and Twofold Similairty. In proceedings of the 5th International Conference on Case-Based Reasoning (ICCBR Trondheim, Norway, June 23 to 26, 2003.
F. Ricci and H. Werthner.(2002) Case base querying for travel planning recommendation,
Information Technology and Tourism, 3(3/4), 215-226, 2002.
J. Rubin.(1994) Handbook of Usability Testing: How to Plan, Design, and Conduct Effective