POLITECNICO DI MILANO
School of Industrial and Information Engineering
Master of Science degree in Engineering Physics
Analysis of the Down-Coupling Phenomenon
in 3D NAND Flash Memories
Supervisor:
Prof. Alessandro Sottocornola Spinelli
Co-Supervisor: Prof. Christian Monzio Compagnoni
MSc Thesis of
Mattia Giulianini
Student ID number 920306
Contents
List of Figures ii
Sommario iii
Abstract v
1 Introduction to NAND Flash memories 2
1.1 Flash memories success . . . 2
1.2 2D NAND Flash memories . . . 3
1.2.1 Functional principles . . . 3
1.2.2 Programming and erasing a memory cell . . . 4
1.2.3 Array structure . . . 6
1.3 Array operations . . . 7
1.4 Scaling issues in planar NAND memories . . . 10
1.4.1 Program noise . . . 11
1.4.2 Stress-Induced Leakage Current . . . 12
1.4.3 Cell-to-cell electrostatic interference . . . 13
1.4.4 Random Telegraph Noise . . . 14
1.5 3D NAND Flash memories . . . 15
1.5.1 Vertical channel structure . . . 15
1.6 Advantages and issues of 3D memories . . . 19
1.7 Thesis work goals . . . 20
2 Gate-induced drain leakage effect and down-coupling phenomenon 21 2.1 Gate-induced drain leakage . . . 21
2.1.1 Physical origin of GIDL . . . 22
2.1.2 GIDL in BiCS technologies . . . 23
2.2 Disturbs related to the program operation . . . 25
2.3 Self-Boosting effect . . . 27
Contents
2.4 Down-Coupling Phenomenon . . . 29
2.5 Conclusions . . . 32
3 TCAD simulation about the DCP 33 3.1 Simulation environment . . . 33
3.2 Simulation definition . . . 34
3.2.1 Geometry of a single cell string . . . 34
3.2.2 Physical models included in the simulations . . . 36
3.3 Generation and recombination processes . . . 38
3.4 Threshold extrapolation . . . 39
3.5 Transient simulation definition . . . 41
3.6 DCP simulation results . . . 43
3.6.1 Analysis of the CB energy time evolution . . . 43
3.6.2 Time evolution of the carriers concentration . . . 45
3.6.3 Time evolution of the current . . . 47
3.7 Dependence on parameters . . . 50
3.8 Preliminary model of the return to equilibrium of the DCP . . . 53
3.8.1 Description of the compact model . . . 54
3.8.2 Circuital model . . . 56
3.8.3 Model results . . . 58
3.9 conclusions . . . 59
4 Simulations of BiCS and TCAT structures 61 4.1 DCP in BiCS memories . . . 61
4.1.1 Geometry and characteristics of a 16 WLs NAND string . . . 61
4.1.2 Physical differences between single WL structure and 16 WLs struc-ture . . . 62
4.1.3 Time evolution of the conduction band energy in BiCS . . . 66
4.1.4 Carriers concentration in BiCS . . . 68
4.1.5 Time evolution of the current in BiCS . . . 71
4.2 Dependence on parameters for the BiCS structure . . . 75
4.3 DCP in TCAT memories . . . 76
4.3.1 TCAT geometry . . . 77
4.4 DCP results for a completely programmed TCAT structure . . . 78
4.5 DCP results for a not completely programmed TCAT structure . . . 81
4.5.1 Carriers concentration analysis in a not completely programmed TCAT structure . . . 83
Contents
4.5.2 Current time evolution in a not completely programmed TCAT structure . . . 85 4.6 Conclusions . . . 88
Conclusions 89
List of Figures
1.1 F values for 2D NAND Flash memories manufactured by the leading com-panies in the semiconductor sector between 2001 and 2015 (from Interna-tional Solid-State Circuits Conference (ISSCC)). . . 3 1.2 Schematic representation of a planar memory cell with floating-gate. . . . 4 1.3 Band diagrams of a NAND Flash memory where (a) positive charge and
(b) negative charge is stored. . . 5 1.4 Band diagram for 2D NAND memory during (a) the programming
opera-tion and (b) the erasing operaopera-tion. . . 6 1.5 (a) Circuital scheme of a 2D NAND Flash array, highlighting the strings
of floating-gate transistors driven by shared WLs. BL = bit-line; DSL = drain-select line; DU L = dummy-line; W L = word-line; SSL = source-select line; SL = source-line; (b)Planar layout of a 2D NAND Flash memory, (c) cross section of the array along the string direction (from [1]). 7 1.6 VT distribution of cells in different states for (a) a single level cell, (b) a
multi level cell and (c) triple level cell (from [1]). . . 8 1.7 Array representation of a NAND string with bias scheme for (a) read, (b)
program and erase operation (from [1]). . . 9 1.8 Example of the ISPP process. In red is depicted the control gate bias while
in black is shown the corresponding programme VT (from [2]). . . 10
1.9 Pictorial representation of an electron undergoing the tunneling assisted by two traps states (from [3]). . . 12 1.10 Schematic representation of the capacitances between first neighbor FGs
(from [4]). . . 13 1.11 (a) Example of simulated current density for a MOSFET where atomistic
doping is considered, (b) comparison of the density current in the case of a trapped electron (from [5]). . . 14 1.12 Simple representation of a vertical channel memory (from [1]). . . 16
List of Figures
1.13 (a) Schematic view of a single cell for a GAA memory structure (b) Vertical section of a GAA 3D NAND memoriy(from [1]). . . 17 1.14 Manufacturing process flow (from [6]). . . 17 1.15 Vertical section of a TCAT flash memory (from [7]). . . 18 1.16 Schematic vertical section of a 3D NAND Flash memory highlighting the
non-uniform pillar radius in the vertical direction (from [1]). . . 19 2.1 Subthreshold characteristic of planar n-MOSFETs showing a significant
drain leakage current when VD is high (from [8]). . . 22
2.2 (a) Schematic representation of the carrier movement during the B2BT and (b) representation of the band bending and tunneling of the electron (from [8]). . . 23 2.3 (a) Schematic representation of the band-to-band tunneling in BiCS
mem-ories, (b) Simulated result for a erase operation (from [9]). . . 24 2.4 Schematic representation of a NAND Flash array where the various
con-nection are highlighted (from [10]). . . 25 2.5 Schematic representation of a program operation in a 2D NAND Flash
array where in red are circled the cells subjected to pass disturbs and in green the cells subjected to program disturbs (from [10]). . . 26 2.6 (a) Bias scheme representation of the local self-boosting effect (from [12])
and (b) threshold voltage shift due program and pass disturb for a 2D NAND Flash memory (from [11]). . . 28 2.7 Array bias scheme for the program operation. . . 30 2.8 Simulation results of DCP occurring during a verify operation (from [13]). 31 2.9 Simulation results of DCP for different VT on neighbors cell (from [13]). . 31
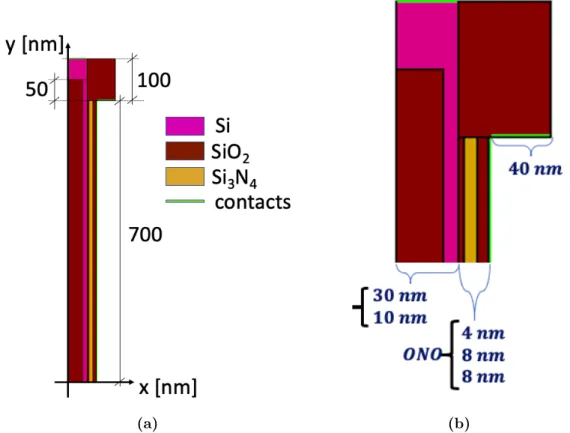
3.1 a) half geometry of the vertical-channel memory with the longitudinal lengths of the structure, b) radial lengths of the memory. . . 34 3.2 Doping profile used in the simulations . . . 36 3.3 BL current comparison between a memory without trapped charge in the
cell and a P1 programmed memory. . . 41 3.4 Bias scheme of the simulation. . . 42 3.5 Band diagram at t = 0 s in (a) longitudinal direction at 0.25 nm from the
silicon-oxide interface and (b) radial direction at the point of maximum Electric field located at the junction between the BL and the channel . . . 43 3.6 Time evolution of the conduction band energy at the middle of the string,
since the end of the WL falling edge. The dashed black line represent the equilibrium value. . . 44
List of Figures
3.7 Longitudinal section of the electron density. The cut is taken at 0.25 nm from the silicon-oxide interface and at t = 0. . . 45 3.8 Time evolution of the hole density at the middle of the string since the end
of the WL falling edge. . . 46 3.9 Comparison of the electron flow at the SL, blue curve, with respect the
current due to the rate generation of the B2BT and SRH, red and yellow curves, respectively. . . 47 3.10 Longitudinal section of the hole density taken at 0.25 nm from the
silicon-oxide interface for three different instants of the transitory. . . 48 3.11 Time evolution of the longitudinal component of the electric field that is
present at the junction between the SL and the channel since the end of the WL falling edge. . . 49 3.12 Longitudinal section of the SRH rate generation taken at 0.25 nm from the
silicon-oxide interface for three different instants of the transitory. . . 50 3.13 Time evolution of the conduction band energy at the middle of the string,
since the end of the WL falling edge. . . 51 3.14 (a) Comparison of the SRH rate generation between the case of not
imple-mented B2BT (blue curve) and impleimple-mented B2BT (dashed red curve). (b) Comparison of the SRH rate generation between the case where τn
max = 10
−9 s (blue curve) and the case where τn
max = 10
−8 s (red curve).
The longitudinal cuts are taken at 0.25 nm from the silicon-oxide interface at the end of the verify phase. . . 52 3.15 Comparison of the electron flow, blue curve, with respect the current due
to the rate generation of the B2BT and SRH, red and yellow curves, re-spectively. The plot is related to the simulation where τmaxn = 10−9 s.
. . . 53 3.16 Schematic representation of the capacitive couplings in the string at the
edge of the channel. . . 54 3.17 Schematic representation of the circuital model. . . 57 3.18 Comparison of the time evolution of the CB energy between the compact
model result (blue curve) and the Sentaurus TCAD result (red curve). . . 58 3.19 Comparison of the time evolution of the currents between the compact
model result and the Sentaurus TCAD result. . . 59 4.1 Half geometry of the BiCS structure. . . 62 4.2 Logarithmic comparison of the transcharacteristics belonging to a structure
List of Figures
4.3 (a) Schematic representation of the contributions to the capacitance be-tween the trapping layer and the channel and (b) pictorial view of the field lines in an elliptical system (from [23]). . . 64 4.4 Linear comparison of the transcharacteristics belonging to a structure with
16 WLs (blue curve) and the structure with just one WL (red curve). . . 66 4.5 Comparison of the CB energy between the structure with 16 WLs (blue
curve) and the structure with one single WL (red curve). The longitudinal section is taken at 0.25 nm from the silicon-oxide and t = 0. . . 67 4.6 Time evolution of the conduction band energy underneath a trapping region
in the middle of the string, since the end of the WL falling edge. The dashed black line represent the equilibrium value. . . 68 4.7 Comparison of the electron density between the structure with 16 WLs
(blue curve) and the structure with one single WL (red curve). The longi-tudinal section is taken at 0.25 nm from the silicon-oxide interface taken at t = 0. . . 69 4.8 Comparison of the hole density between the structure with 16 WLs (blue
curve) and the structure with one single WL (red curve). The longitudinal section is taken at 0.25 nm from the silicon-oxide interface taken at t = 0. 70 4.9 Longitudinal section of the string at 0.25 nm from the silicon-oxide. The
figure reports: (a) the hole density comparison for t = 0.005, 0.380, 2.1 ms (b) the SRH rate at t = 0.380 ms. . . 71 4.10 Comparison of the electron flow( blue curve) with respect to the current
due to the rate generation of the B2BT and SRH (red and yellow curves, respectively). For what concerns ISRH, the dashed part comes from a
recombination rate, instead the solid line comes from the generation rate. 72 4.11 Time evolution of the hole density underneath W L7. . . 73 4.12 (a) Time evolution of the hole density underneath the spacer between the
SSL and W L0, (b) SRH generation rate for three different time instants.
The longitudinal section is taken at 0.25 nm from the silicon-oxide. . . 74 4.13 (a) Longitudinal section of the string at 0.25 nm from the silicon-oxide.
The figure reports the hole density comparison at t = 5 µs between the simulation where was set τn
max = 10
−9 s (blue curve) and the simulation
with τmaxp = 3 · 10−10 s (red curve). . . 76 4.14 Representation of the substrate region for a TCAT geometry. . . 77 4.15 Electrostatic potential profile of the substrate for (a) Nasub= 5 · 1018[cm−3]
and (b) Nasub = 1 · 1018[cm−3]. . . .
List of Figures
4.16 Longitudinal section of the CB energy at different time instants. The cut is of taken at 0.25 nm from the silicon-oxide interface. The dashed line shows the equilibrium value. . . 79 4.17 holes current density profile at (a) t = 1.5[µs] before the end of the falling
edge and (b) t = 10[µs] after the falling edge of WLs. . . 80 4.18 Time evolution of the conduction band energy of the channel underneath
W L15. The time origin corresponds to the end of the falling edge of the verify operation. . . 81 4.19 Comparison of the CB energy as a function of the position for different time
instants. The longitudinal section is taken at 0.25 nm from the silicon-oxide interface in a string where W L8 is erased. The dashed line shows the
equilibrium value. . . 82 4.20 Time evolution of the conduction band energy in a point of the channel
underneath W L12 that is the middle cell in the BLS region. . . . . 83
4.21 Representation of the hole density as a function of the longitudinal coordi-nate. The cut is taken at 0.25 nm from the silicon-oxide interface and at t = 0 s. The blue curve it is related to a string where just W L7 is ERASED, the red curve represents the hole density section for a string with W L7 and W L8 ERASED. . . . . 84
4.22 Time evolution of the hole density underneath the spacer between the DSL and W L15. . . . . 85
4.23 Comparison of the electron flow at the BL (blue curve) with respect to the currents calculate by the SRH and B2BT generation rate (red and yellow curves, respectively) and the hole current coming from the BODY contact (green curve). . . 86 4.24 Time evolution of the barrier height present in the channel position
Sommario
La tecnologia NAND flash rappresenta una delle principali soluzioni nel mercato delle memorie non volatili. La costante richiesta di performance migliori e un maggiore risparmio di spazio ha spinto le industrie di semiconduttori a svolgere continuamente di-versi sforzi nel processo di scaling di queste memorie. La miniaturizzazione delle memorie continua da oltre trenta anni e negli ultimi tempi la caratteristica feature size (F) che de-scrive la dimensione delle celle è giunta a valori di circa 15 nm. Grazie a ciò, tali memorie possiedono una elevata densità oltre a mantenere un basso costo di produzione, il che le rende un ottima evoluzione che possa sostituire gli hard-disk magnetici.
Nonostante ciò, negli ultimi anni l’estrema miniaturizzazione di queste memorie ha portato al sorgere di nuovi problemi tecnologici e di affidabilità, cosi che la riduzione di F è diventata sempre più difficile. Questi problemi sono correlati alla natura quantiz-zata della carica, quindi sono intrinsici e inevitabili. Per questo motivo è stato necessario trovare un nuovo design di queste memorie. La soluzione è stata quella di passare da una intrisica struttura bidimensionale dei MOSFET ad una struttura tridimensionale. Questo nuovo design ha portato alla creazione delle memorie 3D NAND Flash, che sfruttano la dimensione verticale per l’implementazione di ulteriori celle. Questo tipo di tecnologia è in grado di aumentare la densità di dati salvati senza ridurre eccessivamente la F. Anzi, la capacità di memoria è elevata già ad F sufficientemente grande da evitare i problemi dell’estrema miniaturizzazione e questo la rende una tecnologia veramente affascinante. La variazione principale di questa nuova tecnologia risiede in una innovativa struttura del canale. Infatti esso cessa di essere essenzialmente uno strato planare di silicio sotto i tran-sistor e diventa una struttura a pillar dove l’inversione di carica è comandata da control gates (CGs) che circondano il canale. Questa tecnologia però è ancora lontana dall’essere senza difetti, infatti in tale struttura sono comparsi disturbi durante la scrittura delle celle che non erano mai stati visualizzati nelle memorie 2D. Questi disturbi possono produrre errori nel salvataggio dei dati ed uno di questi disturbi, il Down-Coupling Phenomenon (DCP), è analizzato in questo lavoro.
Il DCP è un disturbo che avviene durante la fase di verifica delle celle appena prima dell’inizio della programmazione di queste. Nella parte finale della verifica, operazione
molto simile ad una lettura delle celle, la tensione ai control gates (CGs) scende da un valore superiore alla massima tesione di soglia (VT) fine alla tensione di ground. Durante
questo transitorio, i transistor della stringa, nel caso siano programmati, si spengono nel momento in cui la tensione ai gate scende sotto la tensione di soglia delle celle e il canale entra in stato flottante. A questo punto si instaura tra i gates ed il canale un accoppiamento capacitivo che fa in modo che la tensione del canale segua la discesa della tensione ai gates e che l’operazione si concluda con un voltaggio negativo nel canale. Il disturbo sorge dal momento che dopo tale operazione inizi la programmazione delle celle. Questa, affinchè celle non selezionate non vengano scritte indesideratamente, sfrutta il Self-Boosting Effect (LSBE) dove il canale viene portato ad alte tensioni. Nel momento in cui al canale venga eseguita la procedura del boosting partendo da tensioni negative, il voltaggio finale risulterà abbassato e ciò può produrre errori di programmazione.
Al momento si è a conoscenza della presenza del DCP ma non è stato ancora analizzato il modo in cui la stringa di memoria riesca a tornare alla situazione e in quanto tempo essa riesca a farlo. Questo lavoro è incentrato proprio sullo studio della fisica che giace sotto questo fenomeno e particolare attenzione verrà data alla fase di ritorno all’equilibrio da parte della memoria. Abbiamo utilizzato il software Sentaurus TCAD per simulare il transitorio che descrive la fine della fase di verifica. Siamo partiti dall’analisi l’analisi di una struttra tridimensionale in cui è stato implementato un solo gate che controlla l’intero canale. Abbiamo utilizzato tale struttura per ottenere dei risultati inizialmente più semplici da analizzare. Infatti tale design permette di trascurare tutte quelle interazioni elettrostatiche presenti tra i vari gate che complicano l’analisi del fenomeno. Da ciò che abbiamo analizzato su tale struttura, abbiamo creato un preliminare modellino compatto che possa simulare il fenomeno. In seguito siamo passati allo studio delle simulazioni eseguite sulle due principali strutture della tecnologia 3D: la Bit-Cost Scalable (BiCS) e la Terabit Cell Array Transistor technology. Nello specifico abbiamo analizzato come i portatori di carica riescono ad entrare ed uscire dal canale una volta che i transistor sono nella stato di spenti. Abbiamo comparato le modalità di ripristino dell’equilibrio tra il caso di memoria BiCS e di memoria TCAT. Alla fine abbiamo concluso il lavoro con un analisi quantitativa del transitorio dovuto al DCP, chiarendo quale sia la fisica di base che caratterizza il ritorno all’equilibrio di questo fenomeno. In questo modo aperto le porte per una dettagialta valutazione del DCP sull’affidabilità delle memorie 3D NAND Flash e per lo studio di nuovi designs della stringa che portino ad un miglioramento delle prestazioni.
Abstract
The NAND Flash technology represents a main solution in the market of non-volatile memories. The constant requests of higher performances and a higher space saving have brought the semiconductor industries to continuously carry out several efforts in the scaling process of these memories. The miniaturization of these memories began more than thirty years and today it has achieved a so advanced level that the characteristic size (F) has reached the value of about 15 nm. Thank to this, NAND Flash memories have a high storage density, other than a low production cost, and so they represent a good evolution of the magnetic hard-disk.
Even though, in the last years, the extreme miniaturization of the memories has brought to the outcome of new stability problems such that the scaling of F has be-come more difficult. These problems are related to the quantized nature of the charge, so they are intrinsic and unavoidable. For this reason a new design of the memories was necessary. The solution was to change from an intrinsic bi-dimensional structure of the MOSFETs to a three dimensional structure. This new design has brought to the creation of the 3D NAND Flash memories that exploit the vertical dimension to create further cells. This kind of technology is able to increase the bit storage density without reduc-ing too much the characteristic size F. The storage capacity is so much high already for sufficiently large F that this technology avoid the problems of the extreme scaling and for this reason this solution is so fascinating. The main variation of this new technology lies in the innovative channel structure. In fact, essentially the channel is no longer a planar layer of silicon underneath the transistor but is a pillar where the charge inversion is controlled by control gates (CGs) that surround the channel. This technology is still far away from being flawless, indeed during the writing of the cells unprecedented disturbs arise in the 3D structure while in the 2D design they were never seen. This disturbs can produce errors of the data and one of them, the Down-Coupling Phenomenon (DCP) is analyzed in the current work.
The DCP is a disturbs that occurs during the verify phase of the cells, just before the writing operation. In the last part of the verify phase, an operation alike the read one, the voltage of the CGs decreases from a value higher than the maximum threshold voltage
(VT) to the ground voltage. During this transient, the string transistors, in case they have
a positive VT, are turned off when the gates voltage gets lower than the threshold and the
channel enter in a floating state. At this point a capacitive coupling arises between the gates and the channel and this makes the potential voltage of the channel negative once the verify operation ends. The disturb take place due to the fact that then the program operation begins. This operation, in order to not write unselected cells, exploits the Local Self-Boosting Effect (LSBE) where the channel is brought to high voltages. When the boosting effect takes place starting from a negative potential, the final voltage is lower than the wanted one and this produces programming errors.
At the moment the DCP is known just for this behavior but the way in which the system could return to the equilibrium and in how ch time it has not been analyzed yet. Indeed, this work is focused on the study of the physics that lies underneath this phenomenon with particular attention to the return to the equilibrium of the memory. We have used the software Sentaurus TCAD in order to simulate the transitory that describe the end of the verify operation. We started from the analysis of a simplified structure in which there was implemented just one control gate that controls the channel. In this way we have obtained results easier to analyze because this structure allows to avoid those electrostatic interactions that are present between the various gates. With what we have obtained by this analysis, we have implemented a preliminary compact model that could replicate the simulate the phenomenon. Next, we moved to the analysis of the effect in the two main designs for the 3D NAND Flash technology: the Bit-Cost Scalable (BiCS) and the Terabit Cell Array Transistor technology. In particular we have analyzed how the carriers can enter and exit from the channel once the transistors are switched off. We have compared the ways in which the BiCS and the TCAT structures can return to the stationary condition. In the end we have concluded our work with a quantitative analysis of the DCP transient, pointing out the physical events that characterize the return to the equilibrium of this phenomenon. In this way, we have opened new perspectives for a detailed evaluation of the impact of the DCP on the reliability of 3D NAND Flash memories and for the study of new string designs that could bring to an improvement of the performances of these memories.
Chapter 1
Introduction to NAND Flash memories
The NAND Flash technology has drawn many interests due to the several advantages that this technology can offer. For this reason, many efforts were done by the semicon-ductor industries in oder to make the Flash technology an even better resource. In the last years the mechanical stress immunity and the huge capabilities of the NAND memo-ries made this technology a good replacement to the hard disk drives. In this chapter, an introduction on the 2D NAND technology will be given, the main array operations will be presented and the principal issues stated. Next, the motivations that pushed the investors to move to the 3D NAND Flash technology, in order to keep going with the miniaturiza-tion of cells, will be explained. In the end a brief presentaminiaturiza-tion of this new technology will be given.
1.1
Flash memories success
The huge growth of the electronic market during the last years has been feasible thanks to the development of nonvolatile solid-state memories which are able to store a huge amount of data by using a small quantity of silicon and so keeping the cost-per-cell relatively small. With the passing of the years, the introduction of better technology processes and the development of better designs led the Flash technologies to become a very reliable solution for non-volatile memories. The success was achieved thanks to the constant miniaturization of the memories that brought to a memory capacity, defined in terms of gross bit storage capacity (GBSD), exceeding the 1 Gbit/mm2. Fig. 1.1 shows the trend of the Feature size (F) along the years, highlighting a reduction of a factor√2 every two years, in agreement with what the Moore’s law states. Despite the cost savings, the miniaturization drove the technologies to its physical limits and brought out reliability problems and new phenomena that both worsened the device functionalities and increased the system complexity. In particular, at very small dimensions, the discrete nature of the
1.2. 2D NAND Flash memories
Figure 1.1: F values for 2D NAND Flash memories manufactured by the leading companies in the semiconductor sector between 2001 and 2015 (from International Solid-State Circuits Conference (ISSCC)).
charge plays a huge limitations because it induces an increase of the variability of the device, giving some problems or reliability. For this reason, in the last years, the interest of moving to the 3D Flash technology grew a lot, due to the benefits that it can produce, in particular the ability of increasing the density of stored data without decreasing the feature size.
1.2
2D NAND Flash memories
1.2.1
Functional principles
In this section, we want to introduce more in detail the technology which this work is about. The Fig. 1.2 reports the schematic structure of a planar Flash memory cell. In the image we can recognize the basic structure of a MOS n-type transistor with: two n+
wells that constitute the source and the drain, a p substrate and a control gate (CG). In addiction, there is an electrode between the CG and the active area in the substrate. This electrode is not electrically connected and for this reason it is called floating gate (FG). The oxide layer in between the active region and the FG is named tunnel oxide while that one between the FG and the CG is called blocking oxide.
In order to program the cell, a certain amount of electrons has to move inside the float-ing gate where the charge must be stored until a new operation on the cell is performed.
1.2. 2D NAND Flash memories
Figure 1.2: Schematic representation of a planar memory cell with floating-gate.
Fig. 1.3a and b show the band diagrams of a cell with positive and negative charge stored in the FG, respectively. In the former case, the state of the memory is called ERASED, while in the latter case the state is called PROGRAMMED. The presence of electrons in the FG for the programmed state makes the electrostatic potential lower, asking for a higher bias at the CG in order to get the same voltage drop on the substrate. In this way, the device has a higher threshold voltage (VT) and, by changing the amount of stored
charge, it is possible to control the VT of the transistor. Considering a memory cell with
just one logic level, it is customary to associate the logic level 1 to the erased state, when VT is low. The logic level 0 is instead associated to the programmed state, when the
threshold is high. Furthermore, the presence or not of electrons inside the FG makes the Id-Vcg curve, that is the drain current as function of the CG potential, shift rigidly by a
quantity ∆VT that is proportional to the amount of stored charge.
∆VT = −
q · nf g
Cpp
(1.1) Eq. 1.1 states the relation between those two quantities, where q is the fundamental electron, ncg is the charge density inside the floating-gate, while Cpp is the capacitance
between the control-gate and the floating-gate. Thanks to this, by applying a Vread voltage
to the CG and reading the current flowing at the drain, it is possible to determine the logic state of the cell.
1.2.2
Programming and erasing a memory cell
Once we realized that the presence of charge inside the FG is fundamental to determine the cell state, we need to understand how it is possible to move the electrons in and out the floating gate. For what concerns the NAND technology, the quantum tunneling is
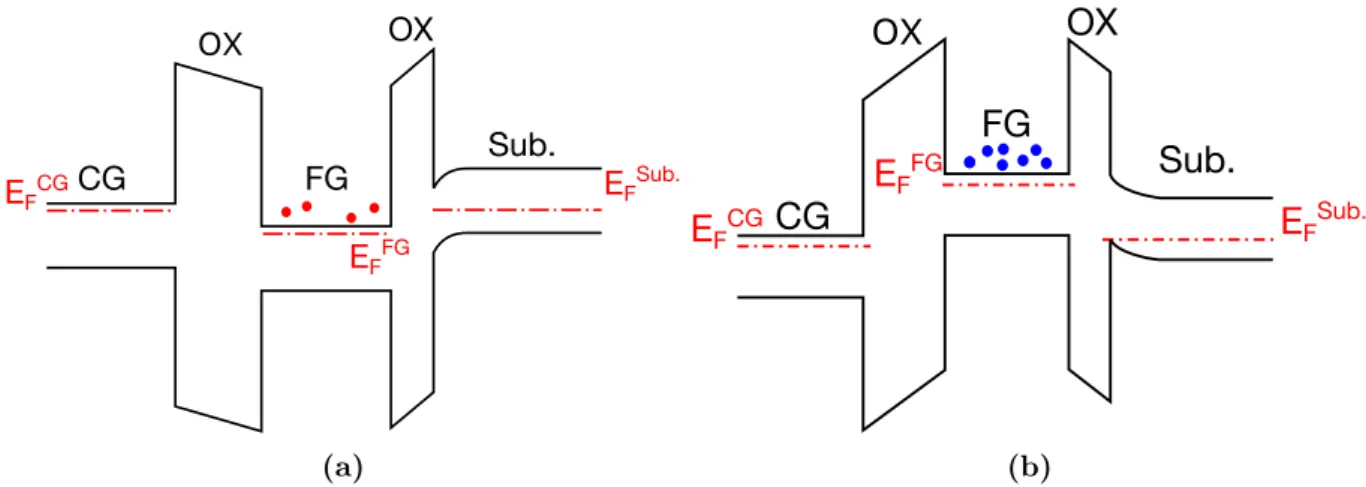
1.2. 2D NAND Flash memories CG FG OX Sub. OX EFCG EFFG EFSub. (a) EFCG EFFG EFSub. CG FG Sub. OX OX (b)
Figure 1.3: Band diagrams of a NAND Flash memory where (a) positive charge and (b) negative charge is stored.
exploited. If the tunnel oxide is sufficiently thin and Vcg is high enough, the band bending
makes the barrier no longer rectangular but triangular and the barrier thickness that the electrons see is smaller. This condition takes the name of Fowler-Nordheim (FN) regime and it is characterised by a non-negligible probability that the tunneling takes place, granting the programming of the cell.
The electron flux JF N just depends on the tunnel oxide field Fox and on the barrier
height φB with a relation described in the following equation:
JF N = AF NFox2e −BF N Fox (1.2) where AF N = q3(2mt+ 4 √ mtml) 16π2 ~qφBmox (1.3) and BF N = 4√2mox 3~q (qφB) 3 2 (1.4)
With mox we stated the tunneling effective mass, while mt and ml are the transversal
and longitudinal effective mass, respectively. The same physical effect can be exploited both in the programming phase and in the erasing phase as depicted in Fig. 1.4a and b, respectively. In the former case Vcg must be positive, while in the latter the control gates
must have a negative bias. These techniques are very efficient in power terms because, while the gate voltage controls the tunneling flux, source and drain are kept equipotential. So, there is no flowing current between these two regions and the power dissipation is kept at the minimum.
1.2. 2D NAND Flash memories EFCGCG FG OX Sub. OX EFFG EFSub. qVCG (a) EFCG CG FG OX Sub. OX EFFG EFSub. qVCG (b)
Figure 1.4: Band diagram for 2D NAND memory during (a) the programming operation and (b) the erasing operation.
1.2.3
Array structure
A planar NAND Flash memory architecture usually is designed as in Fig. 1.5a, where we can see that the transistors are connected in series to form a string. Each string is connected to the respective bit line (BL), while, on the other side, all the strings end up into a common source line (SL). The control gates are driven by word lines (WLs) that run orthogonally with respect to the string direction. The drain select line (DSL) and source select line (SSL) are employed to select the desired string during the various operations that the memory bears. Finally, the cells adjacent to the DSL and SSL are considered dummy because they could behave differently with respect to the inner transis-tors. The source of this different behavior is the presence of fringing fields, i.e. peripheral fields, whose field lines come from adjacent cells, that produce some variations on the electrostatic potential. For this reason the dummy cells are not count as storing cells and their WLs are labeled by using the name dummy lines.
The cells belonging to one string are integrated on the same silicon stripe, while different strings are separated by shallow trench isolations (STIs), as reported in Fig. 1.5b. The picture shows also the F size that in planar Flash memories is usually associated to the width of the WL. In the end, in Fig. 1.5c we can see a cross-section of the memory structure along the string direction.
1.3. Array operations
(a)
(b)
(c)
Figure 1.5: (a) Circuital scheme of a 2D NAND Flash array, highlighting the strings of floating-gate transistors driven by shared WLs. BL = bit-line; DSL = drain-select line; DU L = dummy-line; W L = word-line; SSL = source-select line; SL = source-line; (b)Planar layout of a 2D NAND Flash memory, (c) cross section of the array along the string direction (from [1]).
1.3
Array operations
As mentioned previously, the digital information is associated to the charge stored in the floating gate. Due to the linear relationship between the charge and the ∆VT, it was
realized that a single cell can store more than one bit. This can be done by discretizing the threshold voltage in 2BP C levels, where BPC stands for bits per cell. In case of single level cell BP C = 1, for a multi level cell BP C = 2, and for a triple level cell BP C = 3. Fig. 1.6 depicts a schematic representation of the threshold voltages for the three technologies just spoken. For those memories with BP C > 1, all the states but the erased one are conventionally called programmed states.
1.3. Array operations
Figure 1.6: VT distribution of cells in different states for (a) a single level cell, (b) a multi level cell and (c) triple level cell (from [1]).
discussed in detail in the following: Read operation
The read operation consists in discriminating the VT of a targeted cell irrespective
of the threshold voltage of the other cells. In order to do so, the string must be connected to a sensing circuit where a sense amplifier allows to define if the selected VT is lower or higher than VRX, a reference voltage. The bias scheme is reported
in Fig. 1.7a where we can see that the selected cell is biased to VRX, while all the
others are biased to VpassR , a voltage higher than the maximum VT level, such that
the unselected cells are in a high conductive state, irrespectively of their threshold voltage position. Moreover, the DSL and SSL are high as well as the BL, while the SL is kept to ground. In this way, a current can flow through the circuit and the threshold voltage can be sensed. We have to keep in mind that for the MLC and TLC, the read operations must be performed more than once to exactly define the position of VT.
Program operation
As we said above, the FN tunneling is exploited to inject electrons into the FG and program the cell. With this scope, the string is biased as reported in Fig. 1.7b, in particular the selected cell sees a very high VP voltage, while the unselected cells
are biased to VpassP , different from the VpassR of the read operation. Moreover, the SL is disconnected from the string because the SSL is grounded, on the contrary the DSL is high and connects the grounded BL to the string. In the meanwhile, the
1.3. Array operations
Figure 1.7: Array representation of a NAND string with bias scheme for (a) read, (b) program and erase operation (from [1]).
body of the string is kept to ground and the dummy lines are set to a voltage VDU L
lower that VP
pass in order to decrease the electric field inside the dielectric material
in the region between the DSL/SSL and the rest of the string. In this way, electrons can flow from the BL into the channel whose voltage is kept to 0, then they can get to the FG thanks to the FN regime allowed by the high VP ≈ 20 V . Since
MLC and TLC memories require a fine placement of the VT, a particular voltage
pulses scheme for VP is needed. This technique is called Incremental Step Pulse
Programming (ISPP) method and consists of a fast sequence of pulses of increasing amplitude with a verify, as reported in Fig. 1.8. In such way, it is possible to better control the amount of charge injected into the floating gate and, in the end, have a threshold voltage very close to the desired level.
Erase operation
The erase operation is performed at the same time for all the cells belonging to one string. It exploits again the FN regime but, since high negative bias cannot be stood by the memory circuits, the bias scheme imposes that the WLs are grounded, while the p-well is set to a high positive voltage VE. In this condition, the huge voltage
drop between the channel and the gates makes the holes flow into the FG, exploiting once again the FN regime. The way the p-well voltage is driven to its final bias takes
1.4. Scaling issues in planar NAND memories
Figure 1.8: Example of the ISPP process. In red is depicted the control gate bias while in black is shown the corresponding programme VT (from [2]).
place by means of fast voltage step pulses and the technique is called incremental step-pulse erase (ISPE), like the programming technique. In the meanwhile, BL along with SL, DSL and SSL are left floating in order to keep as lowest as possible the electrical stress on the other parts of the circuit. The bias scheme is reported in Fig. 1.7c. At the end of this, as in the program phase, a verify operation occurs to confirm that all the cells actually have negative threshold voltage, otherwise another erase operation is performed.
1.4
Scaling issues in planar NAND memories
The reliability of nonvolatile memories represents the capability to store the data for a long time interval and to retrieve them intactly even if the array has performed some other operations. With the continuously growing demand for storing data, during the years the NAND technologies kept increasing the GBSD by enhancing the number of bits per cell and decreasing the Feature size. Unfortunately, this scaling down led to significant reliability issues that forced the introduction of Error Correction Codes (ECCs) in order to manage those errors that arise during the operations of the NAND memory. Errors occur when the detected VT state of the targeted cell is changed from the desired VT value
that was set up. There are three main kinds of errors:
write errors: these are due to the inaccurate placement of VT during the program
1.4. Scaling issues in planar NAND memories
arise from statistical fluctuations of the number of carrier undergoing the tunneling from the channel to the floating gate. An intrinsic fluctuation arises from the not completely stable amount of charge that during each step of the ISPP is injected through the tunnel oxide. This is what is is called program noise.
disturb errors: they are due to changes in the cell VT while other operations are
per-formed on the array. For instance, due to the high WL bias during the read opera-tion, some electrons could be unintentionally injected into the FG. Another example of this kind of errors is the change of the VT of unselected due to the change of the
threshold in neighbors cells, that is also called cell-to-cell electrostatic interference. data retention errors: they are instabilities in the VT even if no operations are
perturb-ing the memory state. One possible source of this disturb could be the Stress-Induced Leakage Current (SILC), an undesired electron injection into the FG that takes place by means of the defects inside the tunnel-oxide layer. This phenomenon changes the low-field conductivity of the tunnel-oxide layer allowing the carriers passage even with almost no bias applied to the contacts. Defects in the tunnel-oxide layer can give rise to other VT changes. Some examples of events belonging to this category
of disturbs are the Random Telegraph Noise (RTN) and the charge detrapping. We have just seen that there are several physical effects that impact negatively the data storage and retention of a memory but in order to better understand how the extreme scaling is impacting the reliability of the 2D NAND Flash memories it’s better to further describe some of these issues.
1.4.1
Program noise
We have seen that the increase of the threshold voltage follows Eq. 1.1. This equation tells us that the threshold voltage is affected by the scaling. Indeed, the reduction of the cell area, coming along with the reduction of F, leads to a decrease of the cell capacitances that couples the floating gate to the floating channel and to the control gate. In turn, this is reflected on Cpp that becomes smaller. This means that single electrons have a greater
impact on the cell threshold voltage the same amount of charge has a greater impact on the threshold voltage, i.e. the same variation of stored charge produces a larger shift in ∆VT when Cpp is lower. Furthermore, the reduction of the characteristic feature size
of the cell decreases the number of transferred electrons to/from the floating gate. This explain how a small difference in the amount of charge could produce a relevant variation of the performances of the cell. So, as the value of the Cpp has reached minimal value,
1.4. Scaling issues in planar NAND memories
Figure 1.9: Pictorial representation of an electron undergoing the tunneling assisted by two traps states (from [3]).
consequence concerning the program process. In fact, due to the statistical nature of the electron injection during each pulse of the ISPP, the VT no longer can be considered
deterministic but becomes a statistical event that is affected by fluctuations. In case each ISPP pulse produces a small ∆VT, the variability of this quantity can be found out
considering a Poissonian distribution of the injected charge and resulting in the following equation: σ∆VT ' s qh∆VTi Cpp (1.5)
1.4.2
Stress-Induced Leakage Current
In order to have a correct retention of the data stored the floating gate, just a minimum tunnel oxide layers of few nanometers is needed. Even though, in the last years, the thickness of the oxide has been not affected by the scaling because it was seen that the repetition of many program/erase (P/E) cycles compromises the quality of the dielectric adjacent to the FG. In fact, the repeated application of high electric field causes the onset of traps states in the oxide layer that leads to the problem called Stress-Induced Leakage Current (SILC), i.e. the unwanted transfer of carriers from/to the FG. With the passing of time, the small thickness of the layer, together with the presence of defects, could bring to the unwanted transfer of carriers even if the gate voltage is low. This problem consists of an assisted tunneling injection of the electrons thanks to the presence of the defects in the oxide, as depicted in Fig. 1.9 where we can see the tunneling assisted by two traps close to each other. The picture shows a case where there are simultaneously two defects
1.4. Scaling issues in planar NAND memories
Figure 1.10: Schematic representation of the capacitances between first neighbor FGs (from [4]).
in the tunnel oxide layer. As we can seen, these isolated states modify the potential inside the oxide barrier. This modification consists in a lowering of the potential that in turn makes the effective thickness of the oxide smaller. Regarding the effective thickness, it is the thickness of the barrier seen by the electrons that accomplish the tunneling. This thickness is not the real spatial thickness of the oxide layer, actually these two values are independent. In fact, the barrier thickness is just determined by the electric field inside the oxide and it is precisely this value that affect the tunneling current as we have seen in Eq. 1.2. Even though, with the presence of defects, this barrier thickness can undergo variations of its value and this brings to a leakage current even when the electrostatic potential at the gates is low. In the end, this undesired current produces small ∆VT
that can become relevant in MLCs and TLCs memories where the separation between VT
levels is rather small and there is a reduced Cpp. All of this makes even an extremely
small leakage current be a significant problem for the reliability of the memory.
1.4.3
Cell-to-cell electrostatic interference
Due to the reduction of the cell size, the distance between adjacent cells is reduced and consequently the electrostatic interference becomes more important. The Cell-to-cell electrostatic interference actually is the onset of a ∆VT, usually positive, in a victim cell
due to the change of the VT state of other cells in the string. In particular the shift is
higher if the level variation takes place in first neighbor cells, called aggressor. In planar MOSFET the problem can be associated to the capacitive coupling between the FG of the aggressor and the FG of the victim, as depicted in Fig. 1.10 where some FG-FG
1.4. Scaling issues in planar NAND memories
(a) (b)
Figure 1.11: (a) Example of simulated current density for a MOSFET where atomistic doping is considered, (b) comparison of the density current in the case of a trapped electron (from [5]).
capacitances along the string direction are depicted. For this reason the phenomenon becomes dependent on the design of the string, in particular on the FG height and on the distance between FGs. The magnitude of the disturb can be found out with the following expression: ∆VTvict ' C par F G CF Gtot · ∆V agg T (1.6) where ∆Vvict T and ∆V agg
T are the threshold voltage shifts of the victim and aggressor,
respectively. CF Gpar is the parasitic capacitance between neighbor FGs, while Ctot
F G is the
total FG capacitance of the cell. Due to the fact that the scaling is not proportional for all the dimensions of a cell, the threshold voltage shift has become greater with the miniaturization of the cell. In fact, if on one hand the WL pitch is decreased, i.e. the width and the depth of a cell have been reduced, on the other hand the height of the floating gate has remained almost the same, such that the CF Gpar/CF Gtot ratio is increased with the scaling.
1.4.4
Random Telegraph Noise
Defects in the tunnel oxide layer are of different kinds and they give rise not just to write errors but also to retention errors. For instance, those defects localized at the interface between channel and oxide are the source of the RTN. This effect is essentially a two-level fluctuation of the current read at the drain. The fluctuation is generated by the event of capture or release of an electron from the defect at the interface. The event becomes particularly significant when the scaling of the cells is rather big. In
1.5. 3D NAND Flash memories
fact, the interplay of the localized nature of the defect and the percolative nature of the channel conduction could give rise to large variation of drain current and, in turn, to huge ∆VT shifts. Fig.1.11a and Fig.1.11b shows two examples simulated current density for
a deca-nanometer MOSFET. In this high scaled MOSFET, the atomistic nature of the doping leads to a statistical variation in number and position of the dopants. This doping condition is called Random Dopant Fluctuation (RDF) and it is the source of a particular non-uniform conduction in the channel. Indeed, the random disposition of the dopants gives rise to a filamentary current flow, i.e. percolative paths, where the conductivity is higher, are established. Then, if a defect is present right above a percolative path, the capture of just one electron is sufficient to produces a huge variation in the conductivity of the channel because it means that through that path the flow of carriers will be lower. The decrease of the conductivity brings to a reduction of ID that, in turn, can be associated
to an increase of the threshold voltage.
1.5
3D NAND Flash memories
In the last decade, it was seen that the scaling of the device was reaching the technology limit and so new solutions were necessary to keep up with the GBSD trend requested by the Moore’s law. For this reason, many efforts were driven to the study of the 3D NAND Flash technologies because with that structure is possible to increment the GBSD, keeping a quite large F. The main idea of the 3D NAND technologies is based on the exploitation of the vertical dimension to get a higher bit density in the same wafer area. Even though, it was seen that just a replica of the transistors along the z axis was not a convenient way to keep with the evolution of the memory but a rather complex redesign of the structure was necessary. From this geometry revolution, two main groups of 3D memories came out: the Vertical channel memories and the vertical gate memories. In this work the attention will be focused on the former one due to its relevance in the market.
1.5.1
Vertical channel structure
In Fig. 1.12, a representation of a vertical channel memory is reported. We can see that the WLs are no longer parallel lines but parallel planes that surround several vertical pillars. These pillars carry out the counterpart of the channel for the planar MOSFETs, so from this point on we will use the word channel to refer the whole pillar. Each intersection between a pillar and a WL corresponds to a single cell and the set of cells belonging to one pillar constitutes one string. The string is connected at the bottom to the source line, that is common to all the channels, while at the top, different rows of pillars are connected
1.5. 3D NAND Flash memories
Figure 1.12: Simple representation of a vertical channel memory (from [1]).
to different bit lines. Furthermore, the first and the last plane of WL are etched in order to create rows perpendicular to the BLs such that the single string could be selected.
Fig. 1.13a depicts a simple representation of a Gate All Around (GAA) cell, where we can see clearly that the gate contact is on the whole lateral surface of the pillar, allowing a better control of the electrostatics inside the channel. We notice that in the image there is a sequence of three different dielectrics. Indeed, in 3D NAND memories the substitution of the floating gate with a dielectric material, having a high density of traps, is a quite efficient solution. The reason for adopting this different design lies in the fact that localized traps make the trapping layer more immune to leakage problems. In particular, for the GAA geometry, the leakage involves not just the unwanted passage of charge through the tunnel layer but also the carrier flow through the blocking layer. This happens due to the high coupling that the cylindrical geometry actually grants to the control gates. So the solution was adopting the Oxide-Nitride-Oxide (ONO) stack made of SiO2-Si3N4-SiO2. The Si3N4 dielectric layer is the layer where the carriers are stored.
The storing takes place exploiting the capture of the carriers from the many traps present in the layer that, for this reason, is also called trapping layer. The WLs are composed of heavily doped polysilicon and some insulating layers are positioned between the control gates in order to avoid unwanted currents flow. Fig. 1.13b shows a vertical section of this structure.
1.5. 3D NAND Flash memories
(a) (b)
Figure 1.13: (a) Schematic view of a single cell for a GAA memory structure (b) Vertical section of a GAA 3D NAND memoriy(from [1]).
Figure 1.14: Manufacturing process flow (from [6]).
For what concern the production of this kind of structure, Fig. 1.14 shows the main steps of the manufacturing process. In particular we can see that the pillars are created after an etching operation that destroys the sacrificial columns and leave holes in the stack of the WLs. This hole is then filled with the desired layer in the correct order. First comes the deposition of the Oxide-Nitride-Oxide sequence, next the deposition of the silicon and finally the dielectric filler Due to the fashion in which the deposition takes place, a crystalline silicon cannot be used for the channel, but that is made up of polycrystalline silicon. This material is composed by several grains whose boundaries are characterized by the presence of many dangling bonds that acts like traps for the electrons. In order to have the least number of defects in the channel, the dielectric filler is adopted. Indeed, the filling of the centre part of the hole with the dielectric filler is convenient for two main reason. First, the grains tend to meet each other at the centre of the hole and in that region the concentration of trap states is higher. Second, the reduction of the
1.5. 3D NAND Flash memories
Figure 1.15: Vertical section of a TCAT flash memory (from [7]).
silicon thickness decreases the drawbacks given by the short channel effect. This means that, without the filler, if the length of the WL is too short, the field inside the channel becomes intrinsically two-dimensional, i.e. not just the longitudinal component of the field is relevant but also the radial one and this brings to a degradation of the system characteristics.
The whole manufacturing process described so far is called gate first and the particular kind of vertical memory that has been just described goes with the name of Bit-Cost Scalable (BICS) memory. There is another manufacturing process flow, the gate last process flow, that is used for the creation of the Terabit Cell Array Transistor (TCAT) memories. Fig. 1.15 shows a representation of this kind of memory. This technology has some differences with respect the former one. First, the WLs are made of metal and not of highly doped polysilicon and they do not have cylindrical symmetry. Second, in the case of gate first the substrate consists of just a unique region doped n+, instead in the case
of gate last the channel is linked to a p doped substrate with the presence of lateral wells doped n+ that work as source regions. A common characteristic of these two structures is the absence of the body contact. This constitutes a main difference with respect to the planar MOSFETs and it brings to the onset of new phenomenon during the operations of the memory. In fact, the design of the vertical channels force the carriers to move towards either the BL or the SL in order to get in/out the string. When this movement is impeded, the channel enters in a floating condition and new effect arises.
1.6. Advantages and issues of 3D memories
Figure 1.16: Schematic vertical section of a 3D NAND Flash memory highlighting the non-uniform pillar radius in the vertical direction (from [1]).
1.6
Advantages and issues of 3D memories
3D NAND Flash memories offer the main advantage of reducing those problems re-ported in section 1.4. This kind of memory has the possibility of increasing its GBSD even if the F of the memory is kept relatively large. The fact that the characteristic dimension of the cell is not so small mitigates the weight that each carrier has in determining the threshold voltage. Indeed, having a quite large F means that the variability of the VT due
to the program noise and to the RTN decreases because the statistics describing these effects is based on a higher number of events. This brings to a thinner ∆VT
distribu-tion and allows the achievement of a better endurance for 3D technologies. Then, the GAA structure produces other advantages. In particular, it reduces the cell-to-cell elec-trostatic interference between WLs. In fact, in vertical channel structure the interference is restricted just between first neighbors. Moreover, the better control of the cylindrical structure on the electrostatic of the channel reduces the short channel problems and allows the speed-up of the programming schemes.
Even though, the transition to vertical arrays is not occurring without the onset of new issues. The main drawbacks lie in the high density of defects in the polysilicon. Indeed, the presence of grain boundaries comes along with the presence of energy barriers in the channel that makes the RTN dependent on the lattice temperature and the channel resistance higher. This in turn brings to a reduction of the read current and the need of the development of better sensing circuits. Moreover, the manufacturing process itself is
1.7. Thesis work goals
not immune from problems. In fact the manufacturing technology is not able to produce pillars with constant radius along the whole height. What happens is that the pillars is thinner at the base, where it is connected to the SL, and larger at the top, as reported in Fig. 1.16. The tilting of the pillar produces a variability between cells belonging to the same string and in turn gives rise to a reliability problem. This issue is linked to the engineering problem of the progress of the 3D NAND Flash technology. In fact, due to the narrowing of the pillar at positions close to the SL, the diameter of the pillar cannot be scaled too much and so the first solution, in order to increase the GBSD, is enhancing the number of WLs. This is an attractive challenge because the enhancing of the number of layer leads to higher pillars and, in turn, to a higher channel resistance. This means that the read current will be progressively lower and further improvements in the sensing circuits are needed.
For what concerns the dynamic of the operations that occur in the 3D NAND Flash memories, they are very similar to what we have presented in the previous section for planar MOSFET. The main difference lies in the absence of the body contact for the 3D NAND Flash structures. This brings to the onset of new effects in order that the memory could carry out the different operations, an example is the exploitation of the GIDL during the erase operation in BiCS memory. On the other hand, due to the fact that the channel easily enters in a floating state without the body contact, new disturbs arises as well. One of them derives from what is called Down-Coupling Phenomenon (DCP) that will be discussed in detail in the remaining part of this work.
1.7
Thesis work goals
As we have mentioned, the transition from planar memories to a vertical technology has brought to a huge re-design of the string. Even if the functioning of the memories has not changed a lot, the differences in the structure make the inspection of the operations necessary. In particular, the absence of a direct connection of the BODY contact with the channel led to the onset of new phenomena related to the floating condition of the channel during some operations. The down-coupling phenomenon is one of this and in the following chapter this phenomenon will be described in detail. The goal of this work is actually understand the physics of this effect in order to be able of solving the related disturbs. At first, we will study the effect in the BiCS structure due to the simplicity of dealing with this geometry, simplicity that comes from the symmetry. Then, we will analyze the DCP in a TCAT structure in order to see if the presence of a p doped substrate could bring variations in the effect and, in turn, mitigate the disturbs associated to the phenomenon.
Chapter 2
Gate-induced drain leakage effect and
down-coupling phenomenon
In this chapter some important physical effects characterising the 3D NAND Flash technology will be analyzed. The gate-induced drain leakage effect will be described in more detail because it plays an important role in the neutralization of a disturb that takes place just in 3D NAND Flash memories during the program operation. This disturb can be generated when the down-coupling phenomenon and the self-boosting effect occur one after the other in a short time interval. So, in this chapter ,these two effects will be presented in order to give the basis to understand the work presented in the following part of this work.
2.1
Gate-induced drain leakage
In order to understand the results of the following chapters we need to describe some effects that take place during the operation of the NAND memory. An important phe-nomenon that we encountered during our simulation is a particular kind of carrier flow that involve the passage of the charge through the energy gap of the semiconductor and it takes the name of Gate Induced Drain Leakage (GIDL). It is a particular phenomenon of Band-To-Band Tunneling (B2BT) that it could take place when the bands are so bent that there are state in the valence band and in the conduction band sharing the same energy. In order to give a better explanation, we start with describing the phenomenon when it occurs in planar MOSFETs.
2.1. Gate-induced drain leakage
Figure 2.1: Subthreshold characteristic of planar n-MOSFETs showing a significant drain leakage current when VD is high (from [8]).
2.1.1
Physical origin of GIDL
The GIDL was seen for the first time in the 2D planar MOSFETs during the analysis of the OFF state current in sub-micrometer channel devices. The study showed that the OFF state current was higher than the expected sub-threshold current and soon it was understood that there was the presence of a leakage contribution. Fig. 2.1 shows the comparison of several transcharacteristics of planar MOSFETs when different voltages are applied at the drain. It can be seen that the current does not drop down to the null value when the gate voltage tends to VG = 0 and that this current is larger as the drain
voltage is higher.
The origin of this effect is attributed to the Band-to-band Tunneling (B2BT) at the junction between the drain and the body of the transistor when the junction is in a condition of reverse bias. In particular the phenomenon corresponds to the tunneling of electrons from the valence band (VB) to the conduction band (CB) of the n+ region of the drain where then the carriers flow through the contact due to the positive bias applied to the drain. On the other hand, as the electrons perform the tunneling, it leave empty states in the VB and so holes are generated at the VB side of the barrier. When holes appears in the VB, they feel the electric field established at the junction between the drain and the substrate so that they are pushed towards the substrate generating a hole current that flows at the BODY contact. Fig. 2.2a shows a schematic representation of the carrier displacement. From the picture we notice that the effect takes place in the zone of the drain superposed with the gate. In this region the positive voltage applied at the drain and the low or even negative voltage at the gate tend to push away the electrons and to leave positive charge at the surface underneath the gate. In the drain, in
2.1. Gate-induced drain leakage
(a) (b)
Figure 2.2: (a) Schematic representation of the carrier movement during the B2BT and (b) representation of the band bending and tunneling of the electron (from [8]).
the zone superposed with the gate, a band bending, like that one depicted in Fig. 2.2b, is created. We see in the picture, that the band bending can be so high that some states of the VB end up having the same energy of the CB. This fact generates the possibility that the tunneling mechanism takes place at the band gap. It means that, without a collision event, an electron in the VB can disappear, leaving in its position a hole, and instantaneously an electron appears in a state of the CB with the same energy of the disappeared electron. We also notice from the picture that the barrier thickness that the electron sees to perform the tunneling is determined by the tilting of the bands. In fact the thickness of the barrier depends on the electric field present at the position where the effect occurs. The problem can be traced back to the case of a triangular barrier where just the height of the barrier, i.e. the energy band gap, and the electric field determine the tunneling flux. Considering that, the tunneling current can be described with an expression alike the Eq. 1.2 that we have seen in the previous chapter to describe the FN regime.
2.1.2
GIDL in BiCS technologies
The GIDL is also present in 3D NAND memories where actually the phenomenon is not seen only in a negative way, but in some structures, like the BiCS memories, it is exploited during the erase operation. This operation in 3D memories has a dynamic very similar to the comparable operation in planar MOSFET. The bias scheme expect that the WLs are grounded while the channel is brought to a high electrostatic potential so that a huge voltage drop could establish the FN regime and inject holes into the trapping layer.
2.1. Gate-induced drain leakage
(a) (b)
Figure 2.3: (a) Schematic representation of the band-to-band tunneling in BiCS memories, (b) Simulated result for a erase operation (from [9]).
But in case of 3D NAND Flash technology, the channel is not directly connected to the body contact so it must be brought to high positive voltage in another way. The solution is to create a floating channel condition where the VW L is kept to ground and the same is
done with DSL and SSL so that all the transistors are turned OFF. In the meanwhile, the BL and the SL are biased at high voltage in order to push holes inside the channel. Even though, BiCS memories have the BL and the SL composed by a n-doped silicon, so they do not have a positive carrier supply. At this point the GIDL gets into action because the high voltage drop between the SL and the channel, or between the BL and the channel, makes the band-to-band tunneling possible. Fig. 2.3a shows a schematic representation of the band diagram. In particular the representations corresponds to a section parallel to the channel direction. The picture shows how the band bending present at the edge of the floating channel allows the tunneling of the electron. As the electron is generated at the SL side, a hole is generated inside the channel and in this way it is possible to inject positive carriers into the string and increase the voltage of the channel. Fig. 2.3b shows the temporal evolution of what we have just described. We can see that at the beginning, despite of the the increase of the BL and SL potential, the WLs are turned off. This brings to a floating condition of the floating channel that, being capacitively coupled with the CGs, remains at a low electrostatic potential. Then, the holes start being injected into the channel that increases its potential until it reaches the same value of the the BL and the SL. As we will see in the remaining part of this work, this kind of current flow is not exclusively associated to the BiCS memories or to the erase operation, but it can take place when in 3D NAND Flash memories the channel is in a floating state and there is a significant voltage drop with respect to the BL and the SL. In fact we will encountered
2.2. Disturbs related to the program operation
Figure 2.4: Schematic representation of a NAND Flash array where the various connection are highlighted (from [10]).
the GIDL during the program operation.
2.2
Disturbs related to the program operation
In this section we want to better describe the disturbs related to the program operation in order to have a better picture of the topic of the next chapters. To do so we want to remind the composition of the memory that is composed by a series of connections forming a matrix structure. Fig. 2.5 shows in detail how the array is subdivided. The transistors connected in series to one BL form what is called string. A control gate, connected across the strings, takes the name of word line (WL) and the set of transistors connected to the same WL, but belonging to different strings, form a page. This implies that when a certain operation is performed on the array, the bias scheme must ensure that unselected cells on the string are not affected by the operation. In the same time it must be ensured that unselected cells on the same page of the selected cell, but on different strings, maintain their original state as well. In the previous chapter we have showed Fig. 1.7 that reports the bias scheme related to the program operation in the selected string. In this case, we
2.2. Disturbs related to the program operation
Figure 2.5: Schematic representation of a program operation in a 2D NAND Flash array where in red are circled the cells subjected to pass disturbs and in green the cells subjected to program disturbs (from [10]).
have seen that the unselected WLs have a Vpassvoltage that is a lot lower than VP ≈ 20 V
applied to the selected WL. Due to the electrostatic interference between WLs, it is not possible to set VP ≈ 20 V and at the same time Vpass≈ 0. On the other hand, if Vpass is
too large the voltage drop between the channel and the unselected cells can be sufficient to establish the FN regime and produce a soft-programming. This unwanted injection of electrons in unselected cells produces shifts in the VT of the cells and it is called pass
disturb. For these reason usually the value of Vpass is set to approximately 8 V for 3D
NAND Flash memories. Fig. represents the NAND array and in red highlights the cells subjected to pass disturb.
Furthermore, we are also interested on what happens in unselected strings. We have to point out that the only difference in the scheme bias between a selected string and an inhibited one lies in VBL. In fact, the BL is not grounded but it has a voltage VCC equal
to that one applied to the DSL. In this way, when also the channel reaches about the electrostatic potential of VCC, the DSL is turned OFF and the channel enter in a floating


![Figure 1.7: Array representation of a NAND string with bias scheme for (a) read, (b) program and erase operation (from [1]).](https://thumb-eu.123doks.com/thumbv2/123dokorg/7508972.105029/23.892.233.662.147.556/figure-array-representation-nand-string-scheme-program-operation.webp)
![Figure 1.9: Pictorial representation of an electron undergoing the tunneling assisted by two traps states (from [3]).](https://thumb-eu.123doks.com/thumbv2/123dokorg/7508972.105029/26.892.320.573.155.407/figure-pictorial-representation-electron-undergoing-tunneling-assisted-states.webp)
![Figure 2.1: Subthreshold characteristic of planar n-MOSFETs showing a significant drain leakage current when V D is high (from [8]).](https://thumb-eu.123doks.com/thumbv2/123dokorg/7508972.105029/36.892.269.621.150.427/figure-subthreshold-characteristic-mosfets-showing-significant-leakage-current.webp)
![Figure 2.4: Schematic representation of a NAND Flash array where the various connection are highlighted (from [10]).](https://thumb-eu.123doks.com/thumbv2/123dokorg/7508972.105029/39.892.262.616.151.608/figure-schematic-representation-nand-flash-various-connection-highlighted.webp)
![Figure 2.5: Schematic representation of a program operation in a 2D NAND Flash array where in red are circled the cells subjected to pass disturbs and in green the cells subjected to program disturbs (from [10]).](https://thumb-eu.123doks.com/thumbv2/123dokorg/7508972.105029/40.892.298.590.153.628/figure-schematic-representation-operation-subjected-disturbs-subjected-disturbs.webp)
![Figure 2.9: Simulation results of DCP for different V T on neighbors cell (from [13]).](https://thumb-eu.123doks.com/thumbv2/123dokorg/7508972.105029/45.892.195.704.457.694/figure-simulation-results-dcp-different-v-neighbors-cell.webp)