Faculty of Engineering
Department of Chemistry, Materials
and Chemical Engineering “G. Natta”
Doctoral Program in Materials Engineering
Carbon Nanostructures for Electrochemical Energy
Conversion and Storage Applications
Doctoral Dissertation of: Mazdak Hashempour Igderi Supervisor:
Prof. Antonello Vicenzo Tutor:
Prof. Massimiliano Bestetti The Chair of the Doctoral Program: Prof. Chiara Castiglioni
Conversion and Storage Applications
By
Mazdak Hashempour Igderi
A dissertation submitted in partial fulfillment of the requirements for the degree of
Doctor of Philosophy in Materials Engineering
at
Politecnico di Milano 2015
Abstract
In the current dissertation, under the general framework of “Carbon nanostructures for electrochemical energy conversion and storage applications”, a range of activities with main focus on synthesis and electrochemical characterization of carbon nanostructured materials have been carried out. Accordingly, the thesis has been divided into three chapters and a summary of each activity will be presented in the following as the objective and results of a chapter.
(i) Chemical vapor deposition (CVD) direct growth of carbon nanotubes (CNTs) on stainless steel (SS) and their application for the bipolar plates of proton exchange membrane fuel cells (PEMFCs): in this part, a systematic study of the parameters affecting the direct growth of CNTs on SS is presented and the suitability of the resulting material for working in electrochemical environments is investigated. CNTs were successfully grown on SS via a simple CVD method and without application of any external catalyst after fine tuning all the surface characteristics of SS as well as the growth parameters. It was found out that during the controlled atmosphere heating of SS up to CNT growth temperature, its surface undergoes nano–scale modifications and the type of the subsequently grown filamentous carbon shows a direct relation to the size of surface nano– features formed as a result of certain pretreatments on SS such as polishing, etching, heating condition and atmosphere. CNTs were the dominant growth products where the average size of SS surface nano–features was below 60 nm. Due to the surface modifications of the SS during the high temperature CVD treatment in carbonaceous atmosphere, a reduced corrosion resistance of the SS was found to occur. In particular, chromium depletion of SS due to chromium carbide formation and an accelerated sensitization caused an infirm behavior of the material in electrochemical
media, appearing in the form of intergranular corrosion. Accordingly, although problems such as electrical contact resistance of bare SS in corrosive environment (that is feeble mainly due to passive oxide layer) were addressed, the CNT coating provided by this method was evaluated insufficient as for a corrosion barrier in the electrochemical media such as bipolar plates of PEMFCs.
(ii) Investigation on different carbon nanostructures as the catalyst support of the PEMFCs: in this part, fabrication of Pt electrocatalyst supported on different carbon materials, namely, CNT, reduced graphene oxide (RGO) and hybrid CNT–RGO is demonstrated using a rapid and single step microwave–assisted polyol process (MWAPP), and the activity of Pt towards the oxygen reduction reaction (ORR) is studied on different supports. Due to direct relation of the abundance of defects on the support and Pt concentration and dispersion, inherently inert CNTs showed the lowest and RGO with large number of defects showed the highest concentration of the deposited catalyst. Accordingly, a Pt nanoparticle (NP) size trend as follows was found on different supports: RGO–Pt < CNT– RGO–Pt < CNT–Pt. XPS studies, demonstrated the highest content of oxygen on RGO–Pt and the lowest on CNT–Pt while the composite support had an intermediate oxygen content, resulting in a C/O ratio trend of the supports in the following order: RGO–Pt (7.26) < CNT–RGO–Pt (17.49) < CNT–Pt (21.32). These observations supported the assumption of the higher conductivity of CNT support than the RGO. Moreover, the high resolution XPS results, demonstrated the highest content of sp2 component of C 1s spectra on CNT compared to others, whereas all the oxygen functional groups were more abundant on RGO. In particular, the biggest jump in the content of a certain functional group from CNT to RGO was realized for HO–C=O (carboxyl) groups. The chemical state of the catalyst was also found to be affected by the support type and in particular, by its initial oxygen content, so as the highest and lowest metallic Pt (Pt0) contents were observed on CNT–Pt and RGO–Pt, respectively. In almost all these XPS studies, CNT–RGO–Pt showed concentrations between CNT–Pt and RGO– Pt. Area specific activity evaluation of the samples towards ORR showed a clear outperformance of all the lab-made samples compared to the commercial Vulcan XC72–30%Pt over the entire kinetic region. In
particular, the specific activities of RGO–Pt, CNT–RGO–Pt and CNT–Pt samples at E = 0.90 VRHE, were 2.25, 2.3 and 3.13 times higher than the commercial sample, respectively. Regarding the mass specific activity, the effect of electrical conductivity found to become more important and RGO– Pt showed the poorest behavior. However, CNT–Pt and CNT–RGO–Pt showed 58% and 80% improvements compared to the commercial sample at E = 0.90 VRHE. CNT–RGO–Pt support showed particularly high mass activity due to simultaneous benefitting from the conductivity of CNTs working as nano–interconnects between RGO sheets, and wettability and surface area factors of RGO. It was finally concluded that hybridizing the 1D and 2D support families (CNT–RGO), shared the features of individual components of the hybrid, so as to result at the same time in high area and mass specific activities outrunning the performance of commercial catalysts.
(iii) Investigation on different carbon nanostructures as the active materials for the supercapacitors: this part is mainly concentrating on the electrochemical behavior of CNT and RGO as the active materials for the electrochemical double layer capacitors (EDLCs) or supercapacitors, compared to activated carbon (A.C.) as the commercially available material for this application. Furthermore, different combinations of these three carbon species were investigated to have a clearer understanding of the potentials and risks of hybridization strategy for preparation of the supercapacitor carbon based active materials. Along with thorough microstructural characterizations, electrical conductivity measurements were also carried out on all materials using a lab-made facility, demonstrating orders of magnitude higher conductivities of CNTs (332 S m–1) and RGO (1 S m–1) compared to A.C. (10 µS m–1). Supercapacitor electrodes were prepared via the so–called “paste method” from the desired compositions of active materials in three main classes including A.C.–CNT, A.C.–RGO and A.C.–CNT–RGO. Electrochemical characterization of the electrodes was carried out using cyclic voltammetry (CV), cyclic charge– discharge (CD) and electrochemical impedance spectroscopy (EIS) techniques in a 1 M Na2SO4 solution and parameters related to EDLC performance such as specific capacitance (Cs), internal resistance (Ri), energy density (Es), power density (Ps), relaxation time (τ0), ideality of the
performance and lifetime were evaluated. Specific capacitance and energy density studies showed that a big contribution in the deficiency of pure A.C. electrodes was originating from the lack of electrical conductivity. Addition of more conductive species (i.e., both CNT and RGO) could address this problem. In A.C.–CNT class a maximum was observed in the Cs and Es in the intermediate compositions (CNT contents) below which the composite suffered from low conductivity and above which, the lower specific surface area CNTs was limiting the capacitance. In A.C.–RGO class however, a continuous increase of both specific capacitance and energy was observed by RGO content due to simultaneous improvement of conductivity and almost similar surface area. A.C.–CNT–RGO class showed the lowest dependence on the composition of the added constituents since a good conductivity (supplied by the constant 25% CNT content) and an acceptable surface area (provided by different contents RGO and A.C.) guaranteed and almost always high capacitance. Studies on the rate capability, power performance, frequency response and internal resistance of the electrodes showed a superior behavior of pure CNT electrodes (a τ0=0.19 s, Ri=0.83 Ω and a =22 kWkg–1 at matched impedance condition) or those containing a high content of CNTs. RGO (with a τ0=6.31 s, Ri=6.38 Ω and a
=5.6 kWkg–1 at matched impedance condition for pure RGO) was
behaving better that A.C. (a τ0>100 s and a =4.1 kWkg–1 at matched impedance condition) in this respect, but still more sensitive to rate compared to CNTs. Composite three component electrodes of A.C.–CNT– RGO class benefited from low ionic diffusivity resistance of mesopores of CNTs along with high surface area of RGO, presenting high rate capability and energy density at the same time (τ0 1 s, Ri 1.4 Ω and a 10 kWkg–1 steadily all over the range composition). Moreover, the A.C.–CNT– RGO class also showed the highest degree of ideality in performance with ideality factors (IF) >0.9 over the entire CD current range (quite close to unity as the ideal capacitor). Finally, durability studies showed one of the few infirmities of the composite electrodes compared to pure ones. The negative effect of hybridization on durability was considered to be originating from the integrity loss of the active film, including mechanical and electrical interconnections of the constituents, generating heterogeneity in electronic and ionic properties of the entire electrode. In this respect, the
larger the morphological dissimilarities of the initial constituents, the higher the susceptibility to durability shortcomings. From another point of view, however, this can be looked at as a technical problem in the electrode preparation process that can be improved by optimization of the paste treatment and binder materials as well as possibly some stabilization post treatments.
Contents
Abstract ... i
List of Figures ... x
List of Tables ... xvi
1 Direct growth of carbon nanotubes on stainless steel ... 1
1.1 Introduction ... 1
1.1.1 Objective... 4
1.2 Experimental ... 5
1.2.1 Materials and preparation ... 5
1.2.2 CNT/CNF Synthesis ... 6
1.2.3 Microstructural characterization ... 8
1.2.4 Electrochemical characterization and corrosion measurements ... 9
1.3 Results and discussion ... 9
1.3.1 Synthesis of CNTs/CNFs ... 9
1.3.1.1 Effect of surface morphology ... 9
1.3.1.2 Effect of surface etching ... 20
1.3.1.3 Effect of growth time ... 28
1.3.1.4 Effect of surface oxidation-reduction ... 28
1.3.2 Corrosion evaluation ... 32
1.3.2.1 Microstructural characterization before corrosion ... 32
1.3.2.2 Electrochemical characterization ... 35
1.3.2.2.1 Potentiodynamic tests ...35
1.3.2.2.2 Potentiostatic tests ... 36
1.3.2.3 Microstructural characterization after corrosion tests ... 38
1.4 Conclusion ... 48
2.1 Introduction ... 52
2.1.1 Fuel cells and materials challenges ... 52
2.1.2 Support materials ... 53
2.1.2.1 Carbonaceous supports ... 54
2.1.2.1.1 Carbon blacks and graphite materials ... 54
2.1.2.1.2 Activated carbon ...57
2.1.2.1.3 Mesoporous carbons ... 59
2.1.2.1.4 Carbon fibers and nanofibers ... 62
2.1.2.1.5 Carbon nanotubes ... 64
2.1.2.1.6 Carbon nanohorns, nono onions and nanocoils ... 67
2.1.2.1.7 Nanodiamonds and doped diamonds ... 69
2.1.2.1.8 Graphene and reduced graphene oxide ... 71
2.1.2.2 Composite carbonaceous supports ... 76
2.1.2.3 Non-carbonaceous supports ... 76
2.1.3 Interactions between carbon support and catalyst ... 77
2.1.4 Objective... 82
2.2 Experimental ... 84
2.2.1 Carbon supports preparation ... 84
2.2.1.1 CNTs synthesis ... 84 2.2.1.2 CNTs purification ... 86 2.2.1.3 GO synthesis ... 86 2.2.2 Catalyst synthesis ... 87 2.2.3 Microstructural characterization ... 88 2.2.4 Electrode preparation ... 89 2.2.5 Electrochemical characterization ... 90
2.3 Results and discussion ... 91
2.3.1 Supports preparation ... 91
2.3.2 Catalyst synthesis on supports ... 94
2.3.2.1 TEM studies ... 95
2.3.2.2 TGA studies ... 98
2.3.2.4 XPS studies ... 103
2.3.2.4.1 Survey scans ... 103
2.3.2.4.2 Narrow scans ... 107
2.3.2.4.2.1 Carbon narrow scans ... 108
2.3.2.4.2.2 Platinum narrow scans ... 112
2.3.3 Electrochemical characterization ... 116
2.3.3.1 Electrochemical surface area (ECSA) ... 116
2.3.3.2 Oxygen reduction reaction (ORR) ... 121
2.3.3.2.1 Electrocatalytic activity ... 125
2.4 Conclusion ... 131
3 Carbon nanostructures as active materials of supercapacitors ... 135
3.1 Introduction ... 135
3.1.1 Carbon-based electrode materials ... 137
3.1.1.1 Activated carbons (A.C.s) ... 137
3.1.1.2 CNTs ...140
3.1.1.3 Graphene and reduced graphene oxide ... 141
3.1.1.4 Templated ordered mesoporous carbons ... 144
3.1.1.5 Other carbons ... 146
3.1.2 Objective... 146
3.2 Experimental ... 148
3.2.1 Carbon supports preparation ... 148
3.2.1.1 CNTs synthesis and purification ... 148
3.2.1.2 GO synthesis ... 148 3.2.1.3 GO reduction ... 150 3.2.2 Microstructural characterization ... 150 3.2.3 Electrode preparation ... 151 3.2.4 Electrodes classification ... 154 3.2.5 Electrochemical characterization ... 155 3.2.6 Conductivity measurement ... 158
3.3.1 Microstructural characterization of the active materials ... 160
3.3.1.1 TEM studies ... 160
3.3.1.2 XRD studies ... 162
3.3.1.3 TGA studies ... 163
3.3.1.4 SEM studies of the pastes ... 164
3.3.2 Electrical characterization ... 173
3.3.2.1 Conductivity measurement ... 173
3.3.3 Electrochemical characterization ... 176
3.3.3.1 Specific capacitance and energy density ... 176
3.3.3.1.1 A.C. – CNT electrodes ... 180
3.3.3.1.2 A.C. – RGO electrodes ... 182
3.3.3.1.3 A.C. – CNT – RGO electrodes ... 183
3.3.3.2 Rate capability ... 185
3.3.3.3 Ideality of the performance ... 190
3.3.3.4 Durability ...194
3.3.3.5 Frequency response and relaxation time based on EIS ... 196
3.3.3.5.1 A.C. – CNT electrodes ... 200
3.3.3.5.2 A.C. – RGO electrodes ... 201
3.3.3.5.3 A.C. – CNT – RGO electrodes ... 202
3.3.3.6 Power performance ... 203
3.3.3.6.1 Power density ...203
3.3.3.6.2 Internal resistance and matched impedance power (Pmax) ... 206
3.3.3.7 Ragone plots... 210
3.4 Conclusion ... 212
References ... 217
Appendix A ... 243
Catalyst amount calculation and ink composition ... 243
Vulcan 30wt% Pt... 243
CNT-Pt ... 244
RGO-Pt ... 245
List of Figures
Fig.
1.1 SEM surface micrographs of (a) sample A1 and (b) sample P1 before CNT growth. ... 10Fig.
1.2 Low (50x50 μm scan, left column) and high (1x1μm scan, right column) resolution AFM imagesof the samples of groups A and P before and after the reducing atmosphere heating; (a, b) group A samples before reducing atmosphere heating, (c, d) group P samples before reducing atmosphere heating, (e, f) group A samples after reducing atmosphere heating, (g, h) group P samples after reducing atmosphere heating. ... 12
Fig.
1.3 Nano-hills diameter distribution for as-received and polished samples before (A and P) andafter (A Red and P Red) reducing atmosphere heating. ... 12
Fig.
1.4 SEM micrographs of the samples (a) A1, (b) higher magnification of A1, (c) P1, (d) and (e) highermagnifications of P1. ... 14
Fig.
1.5 SEM micrographs of the samples (a) A2, (b) higher magnification of A2, (c) P2, (d) highermagnifications of P2. ... 16
Fig.
1.6 XRD patterns of bare stainless steel, CNT on stainless steel (A1) and CNF on stainless steel (OR).... 16
Fig.
1.7 TEM micrographs of carbon nanostructures in group A. ... 18Fig.
1.8 AFM images of as-received and polished samples after different etching durations. AE (a, b)and PE (e, f) samples are etched in HCl for 5 min and AES (c, d) and PES (g, h) are etched in the same solution for 10 min (left column images are 50×50μm low resolution scans and right column images are 1×1μm high resolution scans). ... 22
Fig.
1.9 Nano-hills diameter distribution for A, AE, AES, P, PE, and PES samples. ... 22Fig.
1.10 SEM micrographs of samples AE1 (a, b), AE2 (c, d) and AES2 (e, f) in different magnifications.... 23
Fig.
1.11 SEM micrographs of the samples PE1 (a, b), PE2 (c, d) and PES2 (e, f) in differentmagnifications. ... 25
Fig.
1.12 Low (50x50 μm scan, left column) and high (1x1μm scan, right column) resolution AFM imagesof the samples of groups AE and AES after the reducing atmosphere heating; (a, b) group AE samples after reducing atmosphere heating, (c, d) group AES samples after reducing atmosphere heating. .... 26
Fig.
1.13 Nano-hills diameter distribution for A, AE, AES samples after reducing atmosphere heating. . 26Fig.
1.14 Low (50x50 μm scan, left column) and high (1x1μm scan, right column) resolution AFM images of the samples of groups OR; (a, b) after oxidation treatment step and (c, d) after reduction step followed by the primary oxidation. ... 29Fig.
1.15 Nano-hills diameter distribution for OR samples. ... 29Fig.
1.16 SEM micrographs of sample OR in different magnifications. ... 31Fig.
1.17 SEM micrographs of as-grown samples showing (a) CNTs and (b) CNFs. ... 32Fig.
1.18 XRD patterns of as-received and as-grown samples. ... 33Fig.
1.19 SEM micrographs of 316 SS substrates stripped from (a, b) CNT and (c, d) CNF. ... 34Fig.
1.20 Potentiodynamic curves of 316 SS, 316 SS+CNT, 316 SS+CNF and SS-NH samples in 1 M H2SO4 + 2 ppm HF solution at 80oC. ... 36Fig.
1.21 Potentiostatic curves of 316 SS, 316 SS+CNT and 316 SS+CNF samples in 1 M H2SO4+ 2 ppm HF solution at 80oC, (a) saturated with H 2, at –0.1 V vs. SCE, and (b) saturated with O2, at 0.6 V vs. SCE. ... 37Fig.
1.22 XRD patterns of corroded samples. ... 39Fig.
1.23 (a) SEM micrograph of 316 SS after 10000 s potentiostatic test under anodic environment conditions, (b) higher magnification of (a). ... 40Fig.
1.24 SEM micrographs of “CNT on 316 SS” sample after 10000 s potentiostatic corrosion test under the anodic environment conditions showing three different zones and different magnifications of each zone. ... 41Fig.
1.25 SEM micrographs of “CNF on 316 SS” sample after 10000 s potentiostatic corrosion test under the anodic environment conditions showing four different zones and different magnifications of each zone. ... 43Fig.
1.26 SEM micrographs of 316 SS+CNT stripped sample after 10000 s of potentiostatic corrosion test under the anodic environment conditions. (a) Secondary electron mode, (b) back scattered mode, (c) point analysis locations and (d) EDS results at three different zones, compared to pristine 316 SS. ... 45Fig.
1.27 SEM micrographs of cross sectioned stripped 316 SS+CNT samples (a) etched with Nital 2% before corrosion test and (b) without etching after 10000 s of potentiostatic corrosion test under the anodic environment conditions. ... 46Fig.
1.28 (a) SEM micrograph of an etched (Nital 2%) cross section of a stripped CNT sample before corrosion test and (b) EDS line scan results from point A to point B. ... 47Fig.
2.1 Primary particle of carbon black. (Grivei, E., TIMCAL Belgium) ... 55Fig.
2.2 Microstructure of activated carbon (Norit®) ... 58Fig.
2.3 Microstructure of ordered mesoporous carbon [187]. ... 60Fig.
2.4 The ideal pore size of OMC for easy access of the reactants to the catalyst [196]. ... 61Fig.
2.5 (a) HRTEM images of CNOs produced by the arc discharge in water [293], (b) The icosahedral-quasicrystal-like model of an onion carbon particle constructed with the classical molecular dynamics technique [294]. ... 67Fig.
2.6 (a) A magnified TEM micrograph of CNOs with inset representing a simulated single CNH and (b) lower magnification of the same, showing an aggregate of CNHs making a “Duhlia”. Inset schematically showing the same [295]. ... 68Fig.
2.7 TEM micrograph of a CNC with inset on right showing the multi-walled structure of the coil (from [310]) and the inset on left, showing a simulated model of the coil [298]. ... 69Fig.
2.8 (a) The conversion of a “carbon onion” (multi-walled concentric fullerene-like balls) into a diamond using particle beams. A growing diamond is seen inside concentric graphitic layers [314], (b) a nanodiamond crystal. ... 70Fig.
2.9 Classification grid for the categorization of different graphene types according to three fundamental properties: number of graphene layers, average lateral dimension, and atomic carbon/oxygen ratio [335]. ... 73Fig.
2.10 Illustration of the amphoteric character of carbon materials [419]. ... 79Fig.
2.11 (a) high magnification and (b) high resolution TEM images of CNTs synthesized by CVD method after purification. ... 92Fig.
2.12 TGA of as synthesized and purified CNTs. ... 93Fig.
2.13 TEM micrograph of a few layered GO sheet. ... 93Fig.
2.14 schematic representation of Pt synthesis on different supports using MWAPP. ... 94Fig.
2.15 TEM micrographs of the CNT supported Pt catalysts (a) high magnification TEM of the the distribution of Pt NPs on the CNTs, (b) HRTEM of Pt and CNT, (c and d) FFTs of CNT and Pt, respectively. ... 95Fig.
2.16 Morphology and corresponding particle size distribution of (a and b) CNT-Pt, (c and d) RGO-Pt and (e and f) CNT-RGO-Pt systems. ... 97Fig.
2.17 TGA studies on (a) CNT–Pt, (b) RGO–Pt, (c) CNT–RGO–Pt and (d) overlay of the three systems.... 99
Fig.
2.18 XRD patterns of CNT and GO as the starting support materials before Pt synthesis. ...102Fig.
2.19 XRD patterns of the three support-catalyst systems. ...102Fig.
2.20 XPS surveys of the three support–catalyst systems. ... 105Fig.
2.21 (a) Mass concentration of the elements present in different supports based on quantification results (averaged) of the XPS survey and (b) C/O ratio calculated from the same... 106Fig.
2.22 High-resolution deconvoluted XPS spectra of C 1s for (a) CNT–Pt, (b) RGO–Pt (c) CNT–RGO–Pt and (d) comparison plot of chemical states of Pt in different supports. ... 110Fig.
2.23 High-resolution deconvoluted XPS spectra of Pt 4f for (a) CNT–Pt, (b) RGO–Pt (c) CNT–RGO– Pt and (d) comparison plot of chemical states of Pt in different supports. ... 113Fig.
2.24 Cyclic voltammograms of different support–catalyst systems for ECSA determination carried out at 20 mVs–1 in de-aerated 0.1 M HClO 4. ... 118Fig.
2.25 Bar charts of (a) Pt loading and (b) ECSA of different support–catalyst systems. ... 118Fig.
2.26 loading of different oxidation states of Pt, (Pt0, Pt2+ and Pt4+), on the electrodes tested for ECSA and ORR determination. ...120Fig.
2.27 A typical anodic sweep of the ORR polarization curve carried out at different rotation rates. Measurement of the diffusion and kinetic controlled currents is shown schematically at E = 0.40 VRHE and E = 0.90 VRHE, respectively. ... 121Fig.
2.28 ORR polarization curves recorded during the anodic sweep (0.05V to 1.1 V RHE) at 20 mV s–1. Electrode rotation rate. ... 123Fig.
2.29 activity plots of different support–catalyst systems (a and b) Tafel plots of mass and area specific activities, respectively, and (c and d) the values of mass and area specific activities at E = 0.9 VRHE. ... 127Fig.
3.1 Specific power against specific energy, also called a Ragone plot, for various electrical energy storage devices. If a supercapacitor is used in an electric vehicle, the specific power shows how fast one can go, and the specific energy shows how far one can go on a single charge. Times shown are the time constants of the devices, obtained by dividing the energy density by the power [468]. ... 136Fig.
3.2 Illustration of the preparation steps of supercapacitor electrodes. ... 153Fig.
3.4 Diagram of the protocol adopted for comprehensive electrochemical characterization of theelectrodes... 157
Fig.
3.5 Schematic of the conductivity measurement cell. ... 159Fig.
3.6 HMTEM and HRTEM micrographs of (a and b) CNT, (c and d) RGO and (e and f) A.C. ... 161Fig.
3.7 XRD patterns of purified CNTs, GO, and RGO prepared via thermal reduction under N2+H2 (RGO(NH)) or N2+H2+C2H4 (RGO(NHC)) atmosphere. ... 162Fig.
3.8 TGA results of the purified CNTs and RGO. ... 163Fig.
3.9 SEM micrographs of pure A.C. electrode paste in two magnifications. ... 164Fig.
3.10 SEM micrographs of A.C.–5%CNT electrode paste in different magnifications... 165Fig.
3.11 SEM micrographs of A.C.–25%CNT electrode paste in different magnifications. ... 167Fig.
3.12 SEM micrographs of pure CNT electrode paste in different magnifications. ... 167Fig.
3.13 SEM micrographs of A.C.–5% RGO electrode paste in different magnifications. ... 168Fig.
3.14 SEM micrographs of A.C.–25% RGO electrode paste in different magnifications. ... 169Fig.
3.15 SEM micrographs of pure RGO electrode paste in different magnifications. ... 170Fig.
3.16 SEM micrographs of A.C.–25%CNT–25%RGO electrode paste in different magnifications... 171Fig.
3.17 SEM micrographs of RGO–25%CNT electrode paste in different magnifications. ... 172Fig.
3.18 Results of the dried paste thickness measurement via SEM as a function of the paste composition. ... 173Fig.
3.19 Conductivity measurements of the raw initial materials. ... 174Fig.
3.20 Conductivity measurements of the paste electrodes of supercapacitors. ... 176Fig.
3.21 Specific capacitance of a typical electrode calculated via CV at different scan rates and CD at different currents. ... 177Fig.
3.22 Demonstration of the methodology used for specific capacitance and energy calculation based on the CD technique. ... 178Fig.
3.24 Specific capacitance (a, c, and d) and specific energy (b) of A.C.–RGO electrodes. ... 183Fig.
3.25 Specific capacitance (a, c, and d) and specific energy (b) of A.C.–CNT–RGO electrodes. ... 185Fig.
3.26 CVs of (a) pure A.C., (b) pure CNT, (c) pure RGO, (d) A.C.–50%CNT and (e) A.C.–50%RGOelectrodes normalized by scan rate and electrode mass for rate capability studies. ... 187
Fig.
3.27 CVs of (a) A.C.–25%CNT–5%RGO, (b) A.C.–25%CNT–15%RGO, (c) A.C.–25%CNT–25%RGO and (d)RGO–25%CNT electrodes normalized by scan rate and electrode mass for rate capability studies. ... 190
Fig.
3.28 Ideality factor (IF) of different electrodes as a function of CD current. ... 192Fig.
3.29 Specific capacitance change over a 10000 CD life cycle testing. ... 195Fig.
3.30 The EIS results of a typical supercapacitor, (a) Nyquist presentation with inset magnifying thehigh frequency region, (b) real and imaginarycapacitance obtained by elaboration of the raw EIS data, as a function of the frequency. ... 198
Fig.
3.31 EIS results of A.C.–CNT class electrodes presented in the form of (a) real and (b) imaginarycapacitances as functions of frequency. ... 200
Fig.
3.32 EIS results of A.C.–RGO class electrodes presented in the form of (a) real and (b) imaginarycapacitances as functions of frequency. ...201
Fig.
3.33 EIS results of A.C.–CNT–RGO class electrodes presented in the form of (a) real and (b)imaginary capacitances as functions of frequency. ... 202
Fig.
3.34 Relaxation time τ0 of different classes of electrodes as a function of the composition. ... 203Fig.
3.35 Power performance of different classes of supercapacitor electrodes as a function ofdischarge specific current. ... 205
Fig.
3.36 Supercapacitor electrical equivalent circuit adopted from [548]. ... 207Fig.
3.37 (a) internal resistance of a typical sample calculated at different CD currents, (b) averageinternal resistance of different electrodes as a function of the composition and (c) the power of matched impedance for different electrodes as a function of the composition. ...210
List of Tables
Table
1-1 List of the samples with different preparation steps used in this work. During the growthstep of either CNT or CNF, the flow rate of N2, H2 and C2H4 was maintained at 100, 5 and 20 sccm,
respectively. During the reduction step after oxidation in air for CNF synthesis, the flow rate of N2 and
H2 were 100 and 50 sccm. ... 7
Table
2-1 Quantification results (averaged) of the XPS survey spectra of different support–catalystsystems. ... 106
Table
2-2 Position constraints used for deconvolution of C 1s components. ... 108Table
2-3 Quantification results (averaged) of high-resolution deconvoluted XPS spectra of C 1s ofdifferent support–catalyst systems. ... 110
Table
2-4 Quantification results (averaged) of high-resolution deconvoluted XPS spectra of Pt 4f ofdifferent support–catalyst systems. ... 114
Table
2-5 Detailed table showing peak positions and percentage contributions obtained fromdeconvolution of the high resolution XPS spectra of all the support–catalyst systems studied. ... 114
Table
2-6 Comparison of the mass-specific (Im) and area-specific activities (Is) of different support–catalyst systems for the ORR at E = 0.90 V versus RHE determined from the anodic sweep (0.05 V to
1.10 V) at 20 mV s–1. ... 127
Table
2-7 Potential based activity indicators of different samples ... 1291 Direct growth of carbon nanotubes
on stainless steel
1.1
Introduction
Carbon nanotubes have arrived in such popularity and have been paid so great attention by researchers in two last decades that trying to enumerate a full and detailed list of their characteristics, synthesis techniques and possible applications is out of might and sight of this work. Consideration of numerous synthesis methods, each with its own features and parameters, makes us to suffice to a review of the literature finely related to the approach corresponding to the scope of our work.
Amongst various carbon nanotube/fiber (CNT/CNF) synthesis methods, chemical vapor deposition (CVD) has been recognized as a versatile and robust method due to several advantages such as capability to produce dense and uniform deposit, reproducibility, good adhesion, adjustable deposition rates, ability to control crystal structure, surface morphology and orientation of the CVD products, reasonable cost and wide scope in selection of chemical precursors [1]. Although new research directions have been established under the topic of “structural nanoparticle catalysts” trying to grow CNTs on unusual substrates such as noble metals [2–6], ceramics [7,8] and semiconducting nanoparticles [9–12], the 3d transition metals like iron, cobalt and nickel are predominantly used as catalyst for CNT growth [13–15]. Researches in this area can be divided in two main groups: 1)
Indirect growth of CNTs on a noble substrate decorated with transition
metal catalyst particles and 2) Direct growth of CNTs on a catalytic substrate. Different substrates such as aluminum [16], copper [17–22], silicon [23–28], ceramics and ceramic templates [29–33], and different
substrate decoration techniques –such as varieties of physical vapor deposition techniques [34–39], electrodeposition [16,17], sol-gel [40,41], co-reduction of precursors [42,43], impregnation [44,45], incubation [46], thermal decomposition of carbonyl complexes [47,48], metal-organic chemical vapor deposition [49–54]– have been investigated in the so-called
indirect method.
On the other hand, attempts to investigate the direct growth of CNTs on a catalytic substrate are a negligible proportion of the literature. Few attempts on cobalt substrate [55,56], some on nickel [27,55,57–59] and some on stainless steel with iron as the main catalytic element [60–70] form the relevant literature.
Basically, CVD uses a controlled atmosphere containing a carbonaceous species at a suitable temperature to decompose the carbon precursor on a catalytic surface and subsequently, by supersaturating the catalyst particle, make the extra carbon to precipitate in a certain crystalline form, namely, graphite [71]. In this regard, proper preparation of the catalyst layer on the surface of the substrate to be covered by CNTs is a vital step. Accordingly, the availability of substrate materials showing catalytic activity for CNT synthesis translates into an effective facilitation of the synthesis by elimination of a crucial step, namely, catalyst preparation, and therefore, to economic justification as well [72]. Considering potential applications like electrodes for supercapacitors [73–76] and fuel cells [77–81], electrodes for capacitive deionization [82,83] and capacitive mixing for extracting energy from salinity difference of water resources [84–86], field emission probes [23,55,87–89], sensors [90–92], catalyst support for wastewater treatment [66] and low friction applications [93–95], stainless steel can be considered as a potential candidate for direct growth of CNT, due to its high content of iron as the catalyst element. Direct growth of CNT on a catalytic substrate may offer in principle important advantages, in particular a strong bonding to the substrate and consequently lower contact resistance and improved electron/thermal transport properties, then promising improved efficiency in many of the above mentioned applications.
Direct growth of CNTs on stainless steel has been recently studied by using enhanced CVD methods such as direct current plasma enhanced CVD
(DCPECVD) [93], radio frequency plasma enhanced CVD (RFPECVD) [96,97], microwave plasma enhanced CVD (MWPECVD) [55] and plasma enhanced hot filament CVD (PEHFCVD) [95]. These methods benefit from the possibility of relatively low operating temperature and rely on surface treatment by plasma for the formation of nanoparticle like roughness providing catalytic sites. Obviously, PECVD systems are more costly compared to traditional CVD equipment.
Vander Wal et al. tried to grow CNTs directly on 304 stainless steel meshes with different surface pretreatments such as oxidation, oxidation-reduction and laser ablation oxidation [67]. They investigated the effect of different types and flow rates of precursor gases such as acetylene (C2H2) /benzene mixture and CO/benzene mixture on the CNT formation and showed that CO was less active than the others. They also showed that the oxidation pretreatment followed by adequate reduction is a critical point in the synthesis of uniform CNTs. The effectiveness of oxidation-reduction pretreatment on CNT growth was also confirmed by others [66,68,69]. Chemical etching of the stainless steel substrate was another preparation method used successfully for CNT growth by several researchers [61–64]. Nevertheless, possible pretreatments are not limited to chemical etching and alternatives such as micro-shot-peening [70] and ion bombardment [65] were also tested with good results in terms of CNT growth. Recently, attempts have been made to directly grow CNTs on stainless steel without any special pretreatment by CVD using acetylene as precursor gas [60]. In this respect, the industrial application of the CVD technique is confronted with safety and health issues raised by the use of dangerous carbon sources such as acetylene, xylene and benzene which are the precursors most frequently used in the literature. Using species such as ethylene can significantly decrease the associated risk, though not eliminating it completely. However, the lower relative reactivity of ethylene compared to gases such as acetylene [98,99] is a serious drawback to be overcome by optimizing the growth process parameters.
1.1.1
Objective
In this work we intend to directly grow CNTs and CNFs on stainless steel using ethylene as the carbon source via a simple CVD method without use of any extra catalyst layer. It will be shown that pretreatment steps such as ion bombardment, etching, oxidation-reduction, etc. are not necessary to achieve simple growth of entangled CNT layers. Growth mechanism will also be studied and elucidated relying on detailed topographic and statistical investigation of the surface nano-features. As a complementary step, different pretreatment methods reported in the literature are applied and experimentally tested, characterizing the results of each pretreatment in terms of both modification of the surface nanostructure, before the growth step, and the influence of each treatment on the structure of the final products, after growth.
The other side of our motivation behind this work, is directed towards the suitability of the produced material for one of the major field of interest for application of this material, namely electrochemical energy conversion and storage. As briefly reviewed before, many of the potential applications for CNTs are related to the electrochemical performance of the electrode made of CNTs (in our particular, stainless steel/CNT electrode), that in any instance, may imply exposure of the electrode to an electrochemically aggressive environments. Accordingly, the investigation on the corrosion behavior of such materials is a necessary step to confirm their viability for those applications. However, to the best of our knowledge, an in-depth study on the corrosion response of stainless steel/CVD grown CNT has not been performed yet. Thus, in this work we also aim to explore the changes in the substrate caused by the CNT growth which then may affect its corrosion behavior, as expected in view of the well-established vulnerability of stainless steel to corrosion upon high temperature exposure to carbon rich environments [100–103]. More precisely, this work is intended to investigate the corrosion behavior of 316 stainless steel coated with different types of filamentous carbon materials, namely, CNT and CNF, directly grown on the substrate by CVD method. Since these types of conductive carbon do not form a dense and compact layer, the occasion is offered for studying the effects of CNT/CNF growth conditions on the
corrosion behavior of stainless steel. Electrochemical testing for corrosion assessment was conducted under conditions simulating the working environment of bipolar plates (BPs) in polymer electrolyte membrane fuel cells (PEMFCs) [81]. Actually, the highly corrosive environment in which BPs should work, namely high acidity and relatively high temperature, makes this instance stand out as an upper limit in terms of the severity of the corrosion conditions within the aforementioned applications. Hence, any possible weakness of the system which could not possibly appear in milder corrosion conditions was more likely to be revealed herein.
1.2
Experimental
1.2.1
Materials and preparation
Stainless steel (type 316) sheets cut into the size 15×15×1 mm were used as catalytic substrate. Different pretreatment procedures were used, including: grinding and polishing, etching with hydrochloric acid solution, and oxidation–reduction process.
The preparation of mirror polished samples was performed by sequential grinding with SiC abrasive paper, 600 , 800, 1200 and 2000 grit, followed by a final polishing with alumina powder 0.3 μm.
For those samples planned to be used in the etched state, dipping into concentrated hydrochloric acid (Sigma-Aldrich, puriss. p.a., ≥32%) for different durations of 5 and 10 min was carried out to achieve different etching levels and test their effects on subsequent CNT growth.
Careful cleaning including 10 min sonication in acetone and 10 min sonication in distilled water followed by nitrogen drying was applied to all of the samples (as-received, mirror polished and etched) to remove organic and inorganic contaminants. Then, samples were transferred to the CVD reactor.
1.2.2
CNT/CNF Synthesis
The reactor was a horizontal quartz tube (ISO 4793-1980, diameter 20 mm, length 880 mm) heated in a temperature controlled electrical furnace (Carbolite, mod. Endotherm VST 24-16). The tube was coupled to a gas flow control system (flow meter, Brooks Instrument BV, Model 5878). 316 SS substrates were fixed on an alumina stage and then placed into the quartz tube at a location calibrated for temperature control.
As the shielding and carrier gas, nitrogen was used in all tests. Except for the case of oxidation-reduction pretreatment, in all other tests the tube containing the samples was first purged with the carrier gas (continuous flow of 100 sccm) and hydrogen (5 sccm) at room temperature and then heated up to 760 °C. The heating rate was 15 °C/min and the temperature was checked with a thermocouple (Delta Ohm HD2108.1). The temperature profile in the flow direction along the furnace axis was evaluated by point by point measurement, showing a trapezoidal shape. Accordingly, the central zone of the furnace, of about 20 cm length, was isothermal and then selected as the convenient place for sample location. After reaching the desired temperature, a 10 min hold time was allowed to achieve a stabilized temperature. During the whole heating up and holding time, the nitrogen and hydrogen gases flowed constantly (for brevity, this step will be referred to in the following as “reducing atmosphere heating”). After stabilizing the temperature, ethylene (C2H4) was fed into the tube with a flow rate of 20 sccm. Following the admission of ethylene, the process time was set to either 10 or 20 min to assess the effect of growth time.
The samples subjected to the oxidation-reduction pretreatment were placed in the appropriate location in the tube, as noted above, and heated up to the desired temperature in air at atmospheric pressure. The tube was then connected to the nitrogen line (100 sccm) and all connections sealed. Tube reactor was purged with nitrogen for 10 min to fully remove the air and then hydrogen was introduced (50 sccm) for 20 min to reduce the oxidized samples. After this step, ethylene was allowed to flow in the reactor along with the other gases similar to all other samples.
By the end of the growth period, the ethylene flow was interrupted while hydrogen and nitrogen were left to flow continuously to prevent oxidation during cooling down.
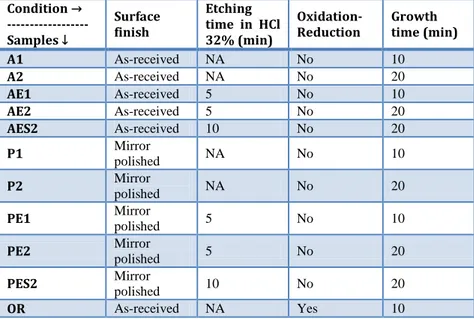
Table
1-1 summarizes all of the preparation and synthesis conditions for the different samples referred to hereafter. For reference, A stands for as-received samples without etching, AE for as-as-received and moderately etched (5 min) samples, AES for as-received and strongly etched (10 min) samples, P for polished samples without etching, PE for polished and moderately etched (5 min) samples, PES for polished and strongly etched (10 min) samples and OR for oxidized-reduced samples.Table 1-1 List of the samples with different preparation steps used in this work. During the growth step of either CNT or CNF, the flow rate of N2, H2 and C2H4 was maintained at
100, 5 and 20 sccm, respectively. During the reduction step after oxidation in air for CNF synthesis, the flow rate of N2 and H2 were 100 and 50 sccm.
Condition → --- Samples ↓ Surface finish Etching time in HCl 32% (min)
Oxidation-Reduction Growth time (min)
A1 As-received NA No 10 A2 As-received NA No 20 AE1 As-received 5 No 10 AE2 As-received 5 No 20 AES2 As-received 10 No 20 P1 Mirror polished NA No 10 P2 Mirror polished NA No 20 PE1 Mirror polished 5 No 10 PE2 Mirror polished 5 No 20 PES2 Mirror polished 10 No 20 OR As-received NA Yes 10
The mass gain of the samples (hereafter referred to as deposited carbon) was calculated from the mass difference before and after the CVD treatment
by using a Sartorius M2P electronic microbalance with an accuracy of 0.001 mg.
Finally, to study the effect of the CVD process temperature on the electrochemical behavior of the sample in the absence of any carbonaceous gas, a series of 316 SS samples were treated in the tubular furnace under the same thermal and atmospheric conditions mentioned for CNT growth, but without ethylene admission.
1.2.3
Microstructural characterization
Deposited carbon layers were characterized for phase analysis by grazing incidence ray diffraction (XRD) technique using an 1830 PW Philips X-ray generator equipped with a PW 3020 Philips goniometer and a PW 3710 Philips control unit. The radiation used was Cu Kα, with scan step time of 0.50 s and step size (2θ) of 0.02° having the sample in the thin film geometry arrangement at 0.5° glancing angle and with rotating detector. Surface topographic characterization was performed using an NT-MDT Solver Pro Atomic Force Microscope (AFM) instrument operated in contact mode with dedicated software. Evaluation of the surface nano-features was performed based on the DFL (deflection related signal) images of the AFM. DFL signals which are the difference signal between top and bottom halves of the AFM photodiode can be used to perform a more precise topography imaging. Contact silicon cantilevers (CSG 10) with tip radius of 10 nm curvature were used to probe the surface. Further elaboration and analysis on AFM data was made by WSXM (v5.3) software [104].
Microstructural characterizations of as-received, as-grown and corroded samples were carried out using scanning electron microscope (SEM, using either a Zeiss EVO 50 EP equipped with energy dispersive X-ray (EDX) or a Stereoscan 360 Cambridge SEM instrument). Nanostructures of CNTs and CNFs were further characterized with a transmission electron microscope (Philips CM200 FEG TEM). CNT and CNF specimens for TEM analysis were obtained by scratching as-grown samples while being immersed in a small volume of ethanol and sonicating the suspension for 60 min.
1.2.4
Electrochemical characterization and corrosion
measurements
The corrosion behavior of coated and uncoated samples was studied by performing potentiodynamic and potentiostatic tests, using a standard three-electrode cell set-up, in 1 M H2SO4 + 2 ppm HF solution, at 80°C. As the working electrode, different samples were used, namely, the bare as-received 316 SS, nitrogen heat treated 316 SS (SS-NH) and CNTs or CNFs coated 316 SS. A platinum coated titanium sheet was used as the counter electrode and a saturated calomel electrode (SCE) as the reference electrode. Electrochemical tests were conducted using a Modulab system (Solartron Analytical).
Potentiodynamic experiments were performed in the potential range from – 0.5 to 1 V vs. SCE at a scan rate of 1 mV s–1 in deaerated electrolyte saturated with nitrogen. Potentiostatic tests were carried out at potentials of –0.1 V and 0.6 V vs. SCE in an H2 or O2 saturated electrolytes, respectively, in the attempt to simulate the polarization conditions of the cathode and anode in a real fuel cell system [105–107]. Before each experiment, samples were left immersed in the electrolyte for 60 min to allow equilibration with the corrosive environment. Open Circuit potential (OCP) measurements in all cases showed a steady trend.
1.3
Results and discussion
1.3.1
Synthesis of CNTs/CNFs
1.3.1.1 Effect of surface morphology
Fig.
1.1 (a) and (b) show the SEM micrographs of bare 316 SS in the as-received (a) and mirror polished (b) states. According to the micrographs in Fig.
1.1, protruding grains could be distinguished at the surface of as-received samples, while after polishing the surface appears obviously smooth and featureless.Fig. 1.1 SEM surface micrographs of (a) sample A1 and (b) sample P1 before CNT growth.
For confidence, a polished sample was subjected to metallographic etching with Beraha′s (I) reagent (H2O: 100 ml, HCl: 20 ml, K2S2O5: 0.5 g, NH4HF2: 2.4 g) [108] and observed under the optical microscope. The etched sample revealed the same granular morphology as in the as-received sample.
For a more thorough investigation on the effects of surface features on CNT growth, low and high resolution AFM scans were performed and the results are shown in Fig.
1.2. In order to clarify the role of the heat pretreatment under controlled atmosphere on the evolution of the morphology of the catalytic substrate, AFM characterization was accompanied by detailed statistical analysis of nano-features lateral sizes which will be discussed herein. According to AFM results, prior to reducing atmosphere heating, a very fine nanoscale roughness characterizes the surface of group A samples (Fig.
1.2 (b)) while these features are eliminated to a great extent in the case of group P samples (Fig.
1.2 (d)). Fig.
1.3 shows the normal (Gaussian) distribution of nano-features lateral size for as-received and polished samples before and after the reducing atmosphere heating. Apparently, the as-received sample had a very narrow distribution of nano-hills diameter, with the frequency peak in the range of 7 nm, while the polished sample had almost thoroughly lost its surface features and no meaningful statistical analysis could be performed. The AFM analysis also confirms the strongeffect of polishing on the original samples (Fig.
1.2 (c and d)). Obviously, concerning the effect of the substrate surface morphology on the CNTFig. 1.2 Low (50x50 μm scan, left column) and high (1x1μm scan, right column) resolution AFM images of the samples of groups A and P before and after the reducing atmosphere heating; (a, b) group A samples before reducing atmosphere heating, (c, d) group P samples before reducing atmosphere heating, (e, f) group A samples after reducing atmosphere heating, (g, h) group P samples after reducing atmosphere heating.
growth, mainly the nanoscale features are of interest rather than micro or macro scale features. In this regard, the granular microstructure with large grain sizes of 10-20 μm and grain boundary depth of around 0.5 μm of as-received samples (Fig.
1.2 (a)), will not be considered further in this study.Fig. 1.3 Nano-hills diameter distribution for as-received and polished samples before (A and P) and after (A Red and P Red) reducing atmosphere heating.
0 25 50 75 100 125 150 175 200 A P A Red P Red
Frequncy (Counts - Arb. Units
)
Fig.
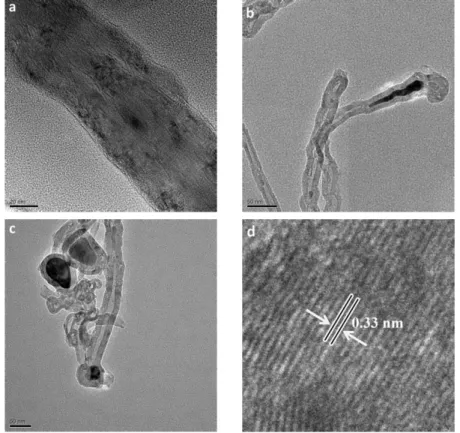
1.4 shows SEM micrographs of A1 (a, b) and P1 (c, d, e) samples. Both at low and high magnifications (Fig.
1.4 (a and b)), sample A1 shows a uniform and homogeneous coverage of CNTs. On the contrary, in the case of sample P1, some bare areas can be distinguished (for instance, within the area encircled by the ellipse drawn in Fig.
1.4 (e)). Comparing CNTs of samples A1 and P1 (Fig.
1.4 (b) and (d), respectively), smaller diameter and greater homogeneity along the tubes length could be recognized for sample A1. Furthermore, sample A1 shows an almost exclusive formation of CNT, while in sample P1 the presence of carbon nanofiber (CNF) is not negligible.Since most of the nanoscale roughness of the surface was removed by polishing, formation of proper sites for filamentous carbon growth relies mainly on the surface evolution during the preliminary steps of synthesis. Attention should be paid to the morphological evolution caused by the heat treatment in flowing hydrogen in order to clarify the differences in CNT growth on polished and unpolished samples. As AFM images suggest, while the microstructures of samples of group A and P (Fig.
1.2 (e) and (g), respectively) did not show remarkable changes, the nanostructures of these samples (Fig.
1.2 (f) and (h), respectively) experienced significant modifications. Fine and uniform granular features with an average lateral diameter of 55 nm formed on group A and a semi-granular less uniform nanostructure formed on group P samples after reduction under hydrogen. Nano-hills of group P possess an average diameter of 75 nm which is larger compared to group A (Fig.
1.3).The surface restructuring revealed by AFM and leading to nanostructure formation is apparently a complex phenomenon resulting from the interplay and compromise between different competing and concurrent factors. The environmental conditions, i.e. high temperature and reducing atmosphere, will probably activate surface reconstruction processes –as a result of oxide reduction and associated with hydrogen adsorption– leading to atomic and
Fig. 1.4 SEM micrographs of the samples (a) A1, (b) higher magnification of A1, (c) P1, (d) and (e) higher magnifications of P1.
nanoscale chemical and structural rearrangement at the surface. Surface energy driven processes will nonetheless overlap with thermally activated processes, such as phase separation and transformation –in particular, carbide precipitation – and recrystallization, which in turn are particularly
sensitive to the thermo-mechanical history of the substrate material. The rather elusive and definitely complex nature of these phenomena require a devoted and focused investigation, which was outside the scope of the present work.
Since these nano-features would serve as the catalytic sites for the CNT growth [60,61,65–68,96], there would be a direct relation between the diameter of the tubes and those of the catalyst particles. Larger nano-hills would favor the growth of thicker CNTs or, rather, CNFs. Further, if in some regions these nano-hills are not formed or there are relatively large flat zones, the growth of filamentous carbon is disfavored in those areas. Non-catalytic sites will instead be covered by amorphous carbon or graphite [67,89].
Fig.
1.5 shows the SEM images of A2 (a, b) and P2 (c, d) samples experiencing 20 min exposure to carbon source. It can be seen that by increasing the growth time, the uniformity of the coverage was maintained for unpolished samples and improved for the polished ones. Furthermore, the diameter of carbon filaments increased compared to 10 min growth time CNTs, which complies with both an increase in the number of walls of CNTs and an increase in the proportion of CNFs in the total product. Fig.
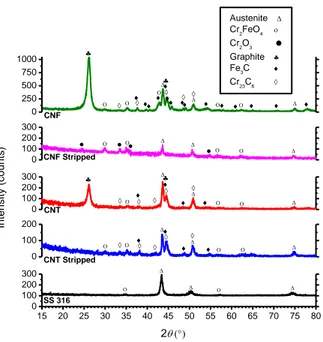
1.6 shows the XRD patterns of stainless steel before and after growth of different filamentous carbon products. Bare stainless steel shows characteristic peaks of austenite phase at 2θ equal to 43.38o, 50.23o and 74.40o corresponding to (111), (200) and (220) planes of FCC austenite, respectively. Weak peaks corresponding to a thin oxide layer on the pristine steel can also be recognized. After growth of CNT/CNF, characteristic peaks of hexagonal graphite were observed at 2θ angles equal to 26.09o and 44.57o corresponding to (002) and (101) crystallographic planes, respectively, along with weaker peaks such as (004) plane at 54.21o, (102) plane at 50.79o and (100) plane at 42.21o which are all present but not marked to avoidconfusion. According to the peak at 26.09o, the interplanar spacing of (002) planes in the CNT is 0.341 nm. Although some recent theories such as re-ordering of chaotic carbon even discuss the possibility ofFig. 1.5 SEM micrographs of the samples (a) A2, (b) higher magnification of A2, (c) P2, (d) higher magnifications of P2.
Fig. 1.6 XRD patterns of bare stainless steel, CNT on stainless steel (A1) and CNF on stainless steel (OR).
15 20 25 30 35 40 45 50 55 60 65 70 75 80 SS 316 + CNF SS 316 + CNT Intensity (Ar b. Units) 2 Graphite Austenite Cr2FeO4 Cr23C6 Fe3C SS 316 (Austenite)
formation of carbon nanocrystals with preferred orientation within the amorphous carbon matrix seeding the growth of crystalline carbon species such as CNTs [109], evidences such as presence of metals and metal carbides peaks in XRD patterns, suggest more likely growth mechanisms as follows. Notably, XRD pattern of the OR sample showed the presence of cementite and possibly a small fraction of chromium carbide, though overlapping of carbides peaks (and of graphite) does not allowed unequivocal conclusions. The presence of very weak reflections that could be attributed either to iron or chromium carbides was also recognized in the A1 sample. Metallic carbides are formed during the exposure of stainless steel to ethylene at high temperature. Similar combination of iron and chromium carbides with filamentous carbon and Cr2FeO4 has been reported in the literature concerning the metal dusting corrosion of stainless steel [110–112]. Moreover, iron carbide, cementite, was reported to be the effective nature of the catalyst in CNT growth by different authors [98,113,114]. Applicability of either of these viewpoints to our case should be discussed on the basis of the TEM images.
Fig.
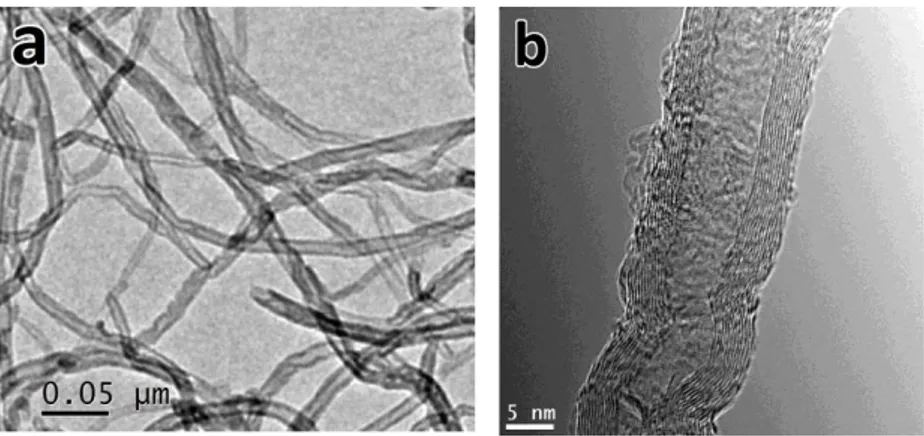
1.7 shows the TEM micrographs of carbon nanostructures in group A samples. It confirms that MWCNTs with up to 30 walls are formed with inner diameter less than 10 nm and outer diameter up to 50 nm. However, the products are not limited to CNTs and some CNFs are formed also (Fig.
1.7 (a)). Generally, without using a precisely engineered catalyst, avoiding the formation of CNFs seems to be difficult. Interplanar spacing of 0.33 nm can be observed between the tube walls (Fig.
1.7 (d)) in good agreement with the value calculated from the XRD peak of (002) planes of hexagonal graphite. Two different types of catalyst particles could be observed in the micrographs. The first one (Fig.
1.7 (b)) is a thin conical shaped nanorod with an average diameter less than 10 nm similar to the inner diameter of CNTs. The second type (Fig.
1.7 (c)) includes relatively large particles encapsulated at the tips of CNTs with an average diameter of 50 nm similar to or slightly larger than the outer diameter of CNTs.Instances of the first type (Fig.
1.7 (b)) are believed by several groups to be the proof of base growth mode [60,115]. In our case, catalyst nano-hills which are naturally parts of the substrate surface seem to have injected these shoot shaped materials either by partial break-up or by undergoing a quasi-liquid transformation resulting in catalyst transfer into the tube channel. In either case, the catalyst particle inside the tube seems to be in a quasi-liquid [60,114] or fluctuating crystalline [113] state after standing out from the surface, making it easily deformable under the stretching forces of the tube walls.Regarding the second type (Fig.
1.7 (c)), the presence of catalyst nanoparticles at the tips of CNTs is mainly interpreted as an evidence of tipgrowth mode in the literature [41,116,117]. Based on proposed explanation
in an early work by Baker et al. [71] as well as in some later works, growth mode depends mainly on the interaction of the catalyst and the support and low adhesion would favor catalyst particle detachment from the substrate and sticking to the CNT tip giving rise to the tip growth mode. However, in our case the catalyst-substrate interaction is supposed to be strong since the catalyst is actually the same as and integrated with the substrate. Therefore, the question can be as follows. How could relatively large particles be detached from the substrate to pursue the tip growth mode? There are very early discussions on the phenomenology of “metal dusting” describing it as “localized or general overall surface damage, in potentially carburizing and reducing gas environments with or without oxygen, in the temperature range of 450°-800°C” with a variety of damage products such as graphite mixed with metal, metal carbides and metal oxides, generally called as dust [118]. Although this type of damage is categorized as a gaseous corrosion with localized damage (e.g., deep pits), its sidelong symptoms such as graphite coverage on the surface [119], break-up of the bulk metallic structure into powder or dust [120,121], formation of metallic carbides [112] and growth of filamentous carbon [122] are all present in this work suggesting that the very elementary stages of dusting are involved in the formation of nanoscale catalyst particles broken-up from the substrate. According to Szakálos [110], a sequence of dusting mechanisms can lead to CNT/CNF formation. Namely, in the case of austenitic steels which cannot form cementite, primarily graphite nucleates and deposits on the austenite surface. Then, by carbon interstitial diffusion into the sub-layer, graphite tends to grow within the near surface material. Consequently, graphite saturation will cause deformation and break-up of the metal surface. This graphite deposition and particle break-up was described as the “type II-mechanism” of dusting. Subsequently, the broken-up particles can play the role of catalyst particles for the filamentous carbon growth (the “type IV-mechanism” according to Szakálos nomenclature). In this regard, the required catalyst particles for the tip growth mode observed in Fig.
1.7 (c),could have been formed by successive recurrence of type II and type IV dusting mechanisms. Further evidence for this hypothesis could be found in SEM micrographs. In the bare areas of samples like P1 (Fig.
1.4 (e)) sparse presence of particles with a size range of 50-100 nm is observed (pointed by arrows) implying surface break-up and particle removal. Some of these particles also show CNTs attached to them demonstrating their role in the catalysis of CNT growth. Furthermore, in samples with longer growth time (like Fig.
1.5 (b and d) a blur view of an outspread granular layer can be distinguished beneath the thin CNT layer. This feature can be attributed to the graphite covering primarily broken-up particles removed from the surface as well as amorphous carbon. Longer exposure times to the carbonaceous atmosphere could have extended the surface break-up and particle removal period. Reminding the catalytic effect of these particles, the same feature can be the reason why increasing the growth time, decreases the uncovered area.1.3.1.2 Effect of surface etching
In order to investigate the effect of etching on the CNT growth, topographic and compositional characterizations were performed on the etched samples. Fig.
1.8 shows the AFM images of the etched samples. In terms of morphology, the effect of etching can be realized as the formation of granular nano-features on the surface that tend to enlarge by increasing the etching time. Two by two comparisons of high resolution AFM images of AE-AES samples (Fig.
1.8 (b and d), respectively) or PE-PES samples (Fig.
1.8 (f and h), respectively) demonstrate the formation and size change of these nano-features.
Fig.
1.9 shows the distribution of nano-features lateral size for A, AE, AES, P, PE, and PES samples. Formation of nano-hills with an average diameter of 28 nm is observed for both as-received and polished samples after 5 min etching (samples AE and PE, respectively). However, by increasing theetching time up to 10 min, nano-hills average diameters increased up to 35 and 57 nm for AES and PES samples, respectively.


![Fig. 2.4 The ideal pore size of OMC for easy access of the reactants to the catalyst [196]](https://thumb-eu.123doks.com/thumbv2/123dokorg/7520616.106001/81.629.203.426.228.485/fig-ideal-pore-size-omc-access-reactants-catalyst.webp)