Received July 4, 2019, accepted July 24, 2019, date of publication July 31, 2019, date of current version August 28, 2019. Digital Object Identifier 10.1109/ACCESS.2019.2932274
Detecting Clinical Signs of Anaemia From Digital
Images of the Palpebral Conjunctiva
GIOVANNI DIMAURO 1, ATTILIO GUARINI2, DANILO CAIVANO1, FRANCESCO GIRARDI 3,
CRESCENZA PASCIOLLA2, AND ANGELA IACOBAZZI2
1Dipartimento di Informatica, Università degli Studi di Bari ‘‘Aldo Moro," 70125 Bari, Italy 2Cancer Institute ‘‘Giovanni Paolo II’’- IRCCS, 70124 Bari, Italy
3ASL Bari, 70123 Bari, Italy
Corresponding author: Giovanni Dimauro ([email protected])
ABSTRACT The potential for visually detectable clinical signs of anaemia and their correlation with the
severity of the pathology have supported research on non-invasive prevention methods. Physical examination for a suspected diagnosis of anaemia is a practice performed by a specialist to evaluate the pallor of the exposed tissues. The aim of the research presented herein is to quantify and minimize the subjective nature of the examination of the palpebral conjunctiva, suggesting a method of diagnostic support and autonomous monitoring. Here we describe the methodology and system for extracting key data from the digital image of the conjunctiva, which is also based on analysis of the dominant colour classes. Effective features have been used herein to establish the inclusion of each image in a diagnosis probability class for anaemia. The images of the conjunctiva were taken using a new low cost and easy to use device, designed to optimize the properties of independence from ambient light. The performance of the system was tested either by extracting manually the palpebral conjunctiva from images or by extracting them in a semi-automatic way based on the SLIC Superpixel algorithm. Tests were conducted on images obtained from 102 people. The dataset was unbalanced, since many more samples of healthy people were available, as often happens in the medical field. The SMOTE and ROSE algorithms were evaluated to balance the dataset, and some classification algorithms for assessing the anaemic condition were tested, yielding very good results. Taking a photo of the palpebral conjunctiva can aid the decision whether a blood sample is needed or even whether a patient should inform a physician, considerably reducing the number of candidate subjects for blood sampling. It also could highlight the suspected anaemia, allowing screening for anaemia in a large number of people, even in resource-poor settings.
INDEX TERMS Anaemia, haemoglobin, conjunctiva, non-invasive medical device, image analysis.
I. INTRODUCTION
Anaemia is a condition in which the blood oxygen-carrying capacity is insufficient to meet the body’s physiological needs, with a high onset even during pre-adolescence, mainly due to a reduced number of red cells. It is a global pub-lic health problem with major consequences for human health and requires preventive diagnostic tools [1]–[4]. The lower threshold generally accepted for the concentration of haemoglobin in the blood for the adult population are: 13.0 g/dL in men and 12.0 g/dL in women; a certain tolerance due to different age and race should be considered. The goal of the study presented in this paper is the development of The associate editor coordinating the review of this article and approving it for publication was Yonghong Peng.
solutions aimed at supporting diagnostic suspicions. To high-light critical conditions, such as the need for a blood trans-fusion, or to allow autonomous monitoring of haemoglobin levels, high accuracy devices are needed. Moreover, in con-texts without surgery and adequate instrumentation, reduced costs of devices and ease of use are a priority. Further-more, since non-invasive methods allow the monitoring of responses to treatment, this method plays an important role in guiding a more effective and less expensive monitoring programme.
In this section, we briefly deal with the definition, onset methods and epidemiological studies on anaemia, which are fundamental for a correct identification of the application context and the symptomatology of the patients.
FIGURE 1. Main causes of anaemia (adapted from European School of Haematology Handbook on Disorders of Iron Metabolism,
2009).
A. THE ERYTHROCYTES
Erythropoiesis is the process of erythrocyte production in the blood, with specialization ascribed to the general process of haematopoiesis originating in the bone marrow. Bone marrow and erythropoietin, a hormone produced by the kidneys, regulate the process of erythropoiesis, favouring a constant rate of change in the number of erythrocytes in the blood [9]. Adequate production of red blood cells prevents conditions such as anaemia and tissue hypoxia. To promote normal erythropoiesis, iron, vitamin B12, folate and correct haemoglobin synthesis are also required. The latter represents the predominant protein found in erythrocytes, responsible for transporting oxygen from the lungs to the other tissues. Anaemia caused by deficiencies of the aforementioned fac-tors results in production patterns of abnormal and different erythrocytes [10]. Many disorders that cause anaemia, such as cancer, are common among older people. Fig. 1 shows the main causes of anaemia, but their distribution is strongly dependent on the areas of the world, as well described in https://www.who.int/nutrition/publications/micronutrients/ anaemias-tools-prevention-control/en/.
B. EVALUATION
Although the symptomatology may vary according to the degree and type of anaemia, distinctive features often accom-pany its presence. To carry out a correct diagnosis, careful study of the anamnesis, an effective physical examination and a series of essential instrumental examinations are nec-essary. Recurrent symptoms common to all types of anaemia include fatigue, dizziness or light-headedness, headache, pal-lor, chest pain, weakness, irregular heartbeat, shortness of breath, and cold hands and feet. During the physical exam-ination, heart rate, respiratory rate and conjunctival pallor of the tongue or nail bed are evaluated [11]–[17]. The meticu-lousness of the evaluations corresponds, in the medical liter-ature, to a strong correlation with the presence and severity of anaemia. The physical examination therefore assumes a more than relevant role in the diagnosis process, opening the way for the development of technologies to support medical personnel. Ultimately, the blood count determined by analysing the main blood cells will provide answers to expectations.
C. EPIDEMIOLOGY
Epidemiological estimates of anaemia are subject to vari-ations depending on the definition of the limit parameters and the quality of the analytical samples used. Given the wide scope of the problem, epidemiological studies in recent decades are partial and often questionable. Among the vari-ous empirical studies, those carried out by the World Health Organization (WHO) find greater applicative feedback in the medical and statistical field [5]–[7], but it must be noted that some authors dispute the above studies [1], [8]. However, there is an open debate concerning which haemoglobin lower threshold should be considered to define anaemia. Recently, new lower limits have been proposed based on the databases NHANES-III and Scripps-Kaiser, in which the haemoglobin concentration was determined with standardized auto-mated methods: these limits are 13.7 g/dL for white men (20–59 years) and 13.2 g/dL for men after the age of 60 years; the corresponding value for women is 12.2 g/dL indepen-dently of age. In Afro-Americans, these limits are lower: 12.9 g/dL in younger men and 12.7 g/dL in men older than 60 years, while the corresponding value for women is 11.5 g/dL for all ages. A recent large population survey showed that nearly ten percent of elderly (over 65), without distinguishing between gender, were anaemic. Mild anaemia cases represent the majority, having estimated a summary percentage of 4% for all other grades. The percentage of male anaemic patients reaches the minimum between 17 and 49 years. For women, the condition occurs between the ages of 50 and 64 years [18]. One third of anaemia cases in adults are attributable to iron deficiencies, folate and vitamin B12. Iron deficiency anaemia summarizes approximately 50% of nutrient-scarred anaemia cases, of which bleeding caused by gastrointestinal lesions is the first cause.
D. TECHNOLOGIES TO POWER THE HEALTHCARE AND MEDICAL SERVICE
We wonder if personal medical systems (or low-cost and non-invasive systems) based on artificial intelligence can power the healthcare and medical service. As written in the WHO report, it is extremely difficult to draw up a complete and reliable picture of the state of anaemia around the world, even in more economically advanced areas. What is certain is that the available estimates suggest a phenomenon of great impact on the world population and, without prejudice to differences in the local dimension of the epidemic, no area of the world is exempt. It is even more difficult to estimate the cost of coping with the disease: costs for prevention (or for failure to prevent), the cost of traditional analysis for instrumentation, personnel and facilities. It is difficult to estimate the economic and social cost for anaemic patients or those suffering from other pathologies that are also anaemic, who must frequently undergo laboratory analysis.
However, some indications can be obtained from real data of the Italian National Health Service (SSN). The SSN in Italy is virtually free for citizens, but in fact paid 2 times by the
citizens themselves: with taxes and with the ticket (a further contribution for each benefit). The most common methods to perform a blood count, on which the diagnosis of anemia is based, are typically the analysis carried out in:
1. public hospitals for external patients; 2. public hospitals for hospitalized patients; 3. private laboratories, paid entirely by patients; 4. private laboratories, partially reimbursed by the SSN; The analysis in 4) are not paid by the SSN, but they represent a significant cost for citizens. We can reason on real data taking into consideration a survey carried out at the SSN of the metropolitan area of the city of Bari (Puglia, Italy) which counts about 1,000,000 inhabitants. In 2018, in public hospitals (point 1), 157,478 blood counts were performed on external patients. The cost for each full blood count is estimated at 3.61$, therefore we can state with certainty that in the year 2018, more than 560,000$ were spent. The citizens of the city of Bari are about 2% of the Italian population. Extending the investigation, in a brutal manner, to the entire national territory we can estimate the cost of blood counts performed in more than 20 Million $ per year, only referring to point 1. It should not be forgotten that a small fee (ticket) is paid directly by the patient regardless of the public or private structure and must be added to these costs. In Italy the laboratory analyses at points 2, 3 and 4 are much more than those of point 1. It is easy to understand the enormous cost that weighs on the SSN and on citizens for laboratory tests only for the verification of the blood count. It should be underlined that the blood count is not carried out only for the diagnosis of anaemia, but the certainty of an imposing cost remains. It is not the case here to dwell further, but these costs must be added to those for therapies and for post-diagnosis admissions due to failure to prevent or late diagnosis.
Well, the scientific evidence in the literature and the results presented in this paper show that digital technologies can make it possible to exclude from the laboratory analysis a good part of the population that is certainly healthy (from the point of view of anaemia) but, even more interestingly, they can provide a reliable alarm on people with suspected severe anaemia. It is worthwhile to invest in research and development of technologies such as the one presented in this paper, with the dual purpose of significantly reducing the costs borne by the national health systems and power the healthcare and medical services that would be exempted from a considerable amount of practically useless activities.
II. RELATED WORK
Advances in digital image processing is playing a key role in the medical field. The instrumentation, diagnostic processes and therapeutic applications have undergone considerable technological improvement. Having underlined in the previ-ous section the fundamental role of the physical examina-tion in the diagnostic process for anaemia, here we report a brief overview of innovative technological frontiers, based on low cost and non-invasive technologies, to support an effective diagnosis. While minimizing the subjective nature
of an observation test falls within the primary objectives, machine learning systems are winning solutions, using sta-tistical methods for the recognition of patterns that are dif-ficult to generalize by human beings. The most promising approaches based on low-cost and non-invasive technologies followed in recent years are oriented towards the measure-ment of haemoglobin by analysing the colour of the finger-tips, nail bed and the palpebral conjunctiva. We will examine the most recent ones in the following sections.
Through digital image processing, some authors investi-gated the relationship between the pallor of fingertips and the concentration of haemoglobin in the blood [19], [21], [41], [42]. Patients were subjected to a standard blood analysis to assess their haemoglobin level, and a smartphone camera was used to record a video of their fingertips. The RGB channels for each pixel contained in the frames were described by histograms and represent the features of the input vectors for a regression model. Techniques of linear regression and partial least squares were used to evaluate the belonging of the specimens to one of two classes of haemoglobin levels. In the paper [21], innovative ideas are provided on the use of colour spaces. Ten different features have been extracted from the video frames and, starting from a raw form of the matrix of features, optimized from the computational perspective, the authors reached a maximal form. The model was then tested for an incremental number of components. HemaApp is an application for monitoring haemoglobin lev-els based on the method described above with the innovative use of different artificial light sources [20]. With the aim to extract the pulse signal recorded in each video, a filter was applied to remove the oscillations caused by breathing and to estimate the heartbeat. The features were generated starting from the intensity values of each wavelength, and a support vector machine provided significant results. Further studies are reported in [22], [44].
A different approach, based on the redness of the palpebral conjunctiva, is described in the article [23]. The acquisition was facilitated by a custom-made device, similar to a virtual reality viewer. The hardware consists of a Raspberry Pi card, a camera module and some LEDs. The colour features pro-vide a representation focused on red levels. To identify the image margins of the palpebral conjunctiva, an edge detector algorithm was used with the addition of a Gaussian filter.
Over the past 30 years, various algorithms and devices have been studied and designed in an attempt to estimate the level of hemoglobin or, more simply, to determine the state of anaemia taking into account the color of the exposed mucous membranes and in particular the conjunctiva of the eyelid. Since 1989, a simple colorimetric instrument was compared with the conjunctiva to estimate hemoglobin concentration in the blood [24]. In [25], the authors analysed colour features of the palpebral conjunctiva based on a standard grey card with the aim of correcting the colors of the photographs based on environmental lighting. In their experiment, they found a moderate correlation between the Hb concentration and the colour features. In [26], it was proposed a new
entropy feature. Furthermore, the authors compared two different classification schemes based on a support vector machine and an artificial neural network, obtaining relatively good performance. The novelty introduced in [27] concerns the use of a combined approach based on a modified Kalman filter and penalty regression, effectively reducing the number of suspect cases. In [28], the authors taken into considera-tion the spectral reflectance of the palpebral conjunctiva and obtained 86% sensitivity for overt anaemia cases, but the sophisticated equipment used are not commonly available and high expensive. In [29], [30], a good correlation between the concentration level of haemoglobin and the conjunctival pallor was obtained based on a smartphone-based system. A comparison of different mobile and digital cameras and different lighting conditions based on the HSI model the Elman neural network was reported in [40]. A recent study on anaemia assessment through observation of the palpebral conjunctiva of pregnant patients with a smartphone was also reported in [39], aiming to limit postpartum haemorrhage often due to anaemia during pregnancy.
With this study we show that it is possible to rely on digital image of the eyelid conjunctiva photographed with a smart-phone to highlight the suspicion of anaemia. This result was due to a very simple tool, the software based on a balanced dataset and a low cost smartphone. Specifically, this study takes into consideration 102 people, a couple of new features, new algorithms for extracting colour characteristics, a method for assisted selection of the area of the palpebral conjunctiva (SLIC superpixel), and experimentation with oversampling of the dataset with the SMOTE and ROSE algorithms to balance the anaemic (minority) and non-anaemic (majority) samples.
III. DIAGNOSTIC SUPPORT
The development of the solution presented herein to support the diagnostic process of anaemia is based on the device for acquisition of the conjunctival region and the software system for the end user, patient or doctor.
A. ANATOMY OF THE CONJUNCTIVA
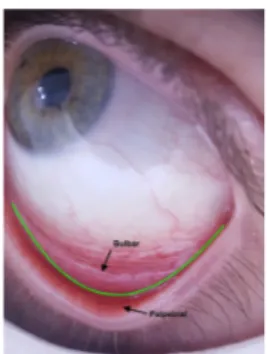
Careful study and knowledge of the anatomy of the con-junctiva, in particular of the eyelid, are behind the devel-opment of a solution to support the diagnosis of anaemia. The conjunctiva is a mucous membrane that extends from the inner palpebral margins up to the eyeball, covering the arches and excluding the corneal area. The high degree of vascularization, guaranteed by the abundant presence of micro-vessels, makes the palpebral conjunctiva a perfect can-didate for observation during the physical examination. The palpebral conjunctiva, compared to the bulbar conjunctiva, better highlights the vascularization of the underlying area and allows one to highlight the minimum variations (Fig. 2) in blood colour. The assumption has been confirmed by the scientific literature, estimating the Pearson correlation index between the haemoglobin value and the redness of the conjunctiva, as reported for example in [25], [29] and [32]. Additionally, veterinary haematology studies have reported
FIGURE 2. Bulbar and palpebral conjunctiva.
FIGURE 3. The conjunctiva acquisition device.
interesting results about the effectiveness of the ‘third eyelid’ as a sensing site [38].
B. TECHNICAL PROBLEMS
A practical medical device to highlight the suspicion of ane-mia based on digital images of the conjunctiva must have the following characteristics: fast and precise, user friendly, low cost, patient-operated at home, robust with respect to ambient light condition and, above all, ensure probability of no-alarm equal to zero. Furthermore, it should make the patient’s history, the current results, and photos available to the doctor, in the case of suspect alarm. This way it can be widely diffused as a tool of personal medicine. The whole estimation system consists of three components: smartphone and software module, macro-lens and special spacer. The macro-lens, enclosed in the spacer shown in Fig. 3, make it possible to take photos of the conjunctiva very close up, allowing you to see tiny details. The spacer is designed so as to easily place it around the area of the eye and, due to its suit-able slant, allows the camera to take a photo focused precisely on the eyelid conjunctiva; in this prototype LED lights are mounted around the spacer. This device is insensitive to ambi-ent light and takes high-resolution pictures of the conjunctiva (2448x3264 pixel, 24bit/pixel), as shown in Fig. 2 and Fig. 4. It must be said that most of the success of this study is due precisely to this acquisition device.
C. IMAGE SEGMENTATION
The software system, through an intuitive interface, allows anaemia monitoring and the possibility of a direct medical consultation by immediately sending all data to a physi-cian. The acquisition process, after photographing the orbital
TABLE 1. Manual selection of palpebral conjunctiva, unbalanced dataset.
FIGURE 4. Example of supervised selection of the palpebral conjunctiva using the SLIC superpixel.
region, involves a segmentation phase based on the SLIC Superpixels algorithm [31]. This algorithm classifies a sig-nificant number of pixels in atomic regions, replacing the classic general grid structure, as in Figure 4. In the same figure it can be seen the green line traced by the patient, or the physician to indicate the region of interest on the smartphone, so as to focus regions belonging mainly to the palpebral conjunctiva. The division into macro-regions of pixels facilitates the selection of a region of interest that is the subject of feature extraction.
IV. IMAGE ANALYSIS AND FEATURE EXTRACTION
The absorption characteristics of the wavelengths of light by haemoglobin give it its typical colour. Omitting the chemical aspects and dwelling on the visible spectrum, haemoglobin absorbs wavelengths between 490 nm and 570 nm (green) and reflects those between 630 nm and 760 nm (red). This characteristic condition accompanies redness of skin, mucous membranes and organs [33]. One of the prerogatives of a diagnostic support tool for anaemia is based on the ability to quantify, for example, by calculating an erythaematous index, the paleness of the palpebral conjunctiva. The disciplines in which this measurement finds applications are different: dermatology, physiology, pharmacology and cosmetic sci-ence. The dermatological field has allowed us to estimate the results of the argon pulsed laser for the treatment of flat haemangioma and has provided an objective and quantifiable assessment of skin reactions to allergy tests. The natural irresolution of the physician caused by the subjectivity of a visual examination can find a solution in the supposedly impartial aid of the software.
TABLE 2.Confusion matrix related to Table 1 (kNN classifier, K=1).
The images contained in the dataset created during this research derive from an acquisition process that minimizes the introduction of ambient light. Then the need for a colour balance algorithm is irrelevant herein. Furthermore, a unique smartphone was used for the entire activity. The aforemen-tioned premises have made it possible to avoid an initial phase of image standardization.
We based our experiments on two features, the erythema-tous index (EI) as described in [33] and component a∗of the CIE-Lab colour space. Parallel experiments were conducted based on the erythematous index as defined in [32] and [34], but greater effectiveness was not achieved.
Erythema is due to vasodilation with an increase in ery-throcytes in the site of interest. In our case, blood vessels are well exposed, and the ‘blood colour’ is evident: this characteristic is not even influenced by fever. Haemoglobin captures light radiation from yellow to violet with varying intensity, reflecting only red light. Therefore, higher quan-tities of haemoglobin in vessels correspond an increase in reflected red light and decrease of green light. Based on this property, we can calculate the EI.
Furthermore, the component a∗ of the CIE-Lab colour space was considered. In this space, the changes of the colour coordinates are strictly related to the changes in the colour perceived by the human visual system. This difference can be quantitatively estimated by taking the Euclidean distance between the colour coordinates [35]. Specifically increasing a∗ values (greater than zero) are typical indicators of the increasing redness of the conjunctiva.
A. COLOUR CLUSTERING
To calculate the colour features used herein, a defined number of prevalent colours was chosen in terms of recurrence using the partitioned clustering algorithm K-means. In Fig.5 the pixels of an image are represented in a three-dimensional
TABLE 3. Manual selection of palpebral conjunctiva, dataset balanced with SMOTE, 4 iterations, NN-> k=1.
FIGURE 5. Representation of colors prevalent in the palpebral conjunctiva (k = 10).
space in which each axis corresponds respectively to the R, G and B channels of the RGB colour space. The spatial arrangement of the image allows us to calculate the Euclidean distances between the points for the assignment of significant centroids, from the point of view of colour. Graphically, the final cluster distribution is predictable, with the denser heterogeneous areas constituting the final partitions and the centroid representing the prevailing colour (Fig. 5). The num-ber of tones selected by the algorithm is equivalent to the parameter ‘‘K ’’.
The choice of the number of partitions is challenging. Indicatively, a value too low in the case of a high number of distinct tones results in a considerable approximation and is similar to the arithmetic average. In contrast, a value that is too high makes it difficult to identify the real quantity of points belonging to distinct clusters, but too similar to each other. In both cases, the ability of the algorithm to privilege the dominant colours diminishes. Based on the experiences conducted for the specific dataset, the images of the palpebral conjunctiva contain on average 10 significant colours for feature extraction.
V. DATASET
The experiments were carried on 102 persons (46 men, 56 women, age 18-87 years, 25 persons with Hb <11.5 gm/dL) at the Haematology Departments of the ‘Ospedale della Murgia - Fabio Perinei’’ (Altamura, Italy). All of them signed the informed consent form. The colour of
TABLE 4.Confusion matrix related to Table 3 (kNN classifier, K=1).
FIGURE 6. Eyelid conjunctiva out of focus.
FIGURE 7. Palpebral conjunctiva badly exposed.
the conjunctiva is not affected by skin colour, for this reason we have not taken this factor into account. After taking the photo of the conjunctiva, all the participants were taken a blood sample and their hemoglobin level measured in the laboratory. A light data cleaning was performed: few photos were discarded, in some cases because they were not perfectly in focus, or sometimes shaded areas or bright spots affected the overall colour of the region of interest. We assured a perfect illumination of the region of interest and that it was exposed as best as possible. An example of the images of the conjunctiva that were not focused is reported in in Fig. 6, and another one in which the palpebral conjunctiva was not well exposed is in Fig. 7.
We based the anaemia alarm condition on a 2-class evalua-tion principle: the patient’s condievalua-tion is marked as ‘risk’ when Hb<11.5 g/dl and ‘safe’ when Hb>=11.5. The full dataset is reported in appendix.
TABLE 5. Manual selection of palpebral conjunctiva, dataset balanced with ROSE, N=254, hmult.majo=0.01, hmult.mino=0.01.
TABLE 6. Confusion matrix related to Table 5 (kNN classifier, K=1).
A. DATASET BALANCING PROBLEMS
An imbalanced learning problem appears in the supervised classification when one of the classes is not sufficiently rep-resented. Class imbalance condition can affect many fields and applications, and the case presented in this paper too. Many papers have focused on the implications of ignoring this problem, as well as designing suitable solutions to solve or relieve it. The presence of a marked imbalance in the class distribution may lead to consequences in obtaining a reliable classification task: simply, rare examples are ignored and classification rules can accommodate to the prevalent class. Typically, the imbalance problem is addressed by altering the class distribution through data resampling, such as over-sampling (with sample replacement) of the lacking class and undersampling (without replacement) of the majority class. This replacement mainly is a random one. Other balancing methods generate new artificial samples that are ‘similar’ to the rare ones. The generation of new data, not really observed, contributes to reduces overfitting and improves the ability for generalization.
In this work, we provide class balancing through two algo-rithms known in the literature, and we study their perfor-mance in the case of safe and risk classes related to anaemia. The first is the Random Over-Sampling Examples (ROSE), a smoothed bootstrap-based technique [36]. ROSE helps to relieve the severity of the effects of an imbalanced distribu-tion of classes by supporting both the model estimadistribu-tion and model assessment. The ROSE technique creates new artificial data. The second is SMOTE [37] based on an over-sampling approach in which the minority class is over-sampled by creating synthetic samples rather than by over-sampling with replacement. While SMOTE also leaves the original data in the dataset, ROSE leaves no data in the original state, i.e., each instance is resampled.
VI. EXPERIMENTAL RESULTS
As mentioned in section 3.3, we extracted the region of interest trough the function implemented to assist the user in segmenting the eyelid image. Furthermore, also a doctor identified and extracted directly the regions of interest of the photos, manually. As a result, we now have two sets of ROIs to analyse. The results obtained through both segmentations are presented in the following section.
A. MANUAL SEGMENTATION OF THE PALPEBRAL CONJUNCTIVA
The first experiment, the results of which are reported in Table 1, refers to the conjunctives manually segmented without any dataset balancing. The classification algorithms reported in Table 1 were considered. The 10-fold-stratified-cross-validation technique was used to test the efficiency of the prediction models obtained. Table 1 shows a report for the trained classifiers with the dataset described above, composed of 77 SAFE instances and 25 RISK instances.
In Table 1, it is possible to identify some classifiers that provide good results, but all of them show a probability of no alarm greater than zero. For example, for the classifica-tion algorithm kNN (k = 1), the confusion matrix is shown in Table 2, where there are 11 occurrences of false negatives. We remember that in a system such as this, it is crucial to reduce false negatives to the minimum value, possibly zero.
The error of all the classifiers is very similar and quite high, but the unbalanced dataset characteristic must be taken into consideration. For this reason, we also evaluated the perfor-mance of the classifiers after balancing the dataset using the SMOTE and ROSE balancing algorithms. The balance was iterated, observing the performance of the classifiers. The SMOTE algorithm increases the total number of instances in the dataset at each iteration. The ROSE algorithm instead allows establishment of the parameter N, which represents the total number of elements in the balanced dataset obtained after the application of the algorithm. In Table 3 is a report for trained classifiers after 4 iterations of SMOTE (nearest neighbour, k = 1), and the dataset composed of 154 SAFE instances and 200 RISK instances.
In this case, the classification algorithm that appears to have the best performance is kNN, and the good result is best observed in Table 4, which shows the absence of false negatives.
TABLE 7. Dataset balanced with SMOTE, 6 iterations, NN→k=1 and ROSE, N=354, hmult.majo=0.01, hmult.mino=0.01.
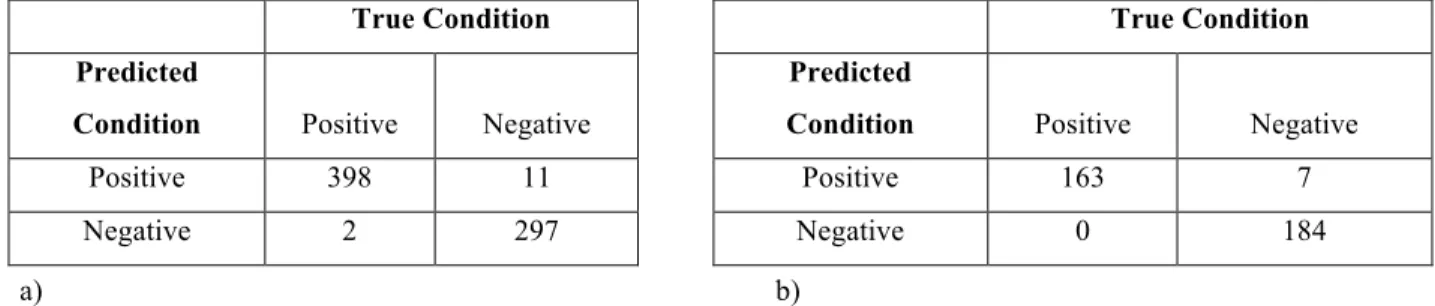
TABLE 8. Confusion matrices of the classification based on the balanced dataset; a) classifiers trained with the set balanced through SMOTE (6 iterations); b) classifiers trained with the set balanced through ROSE (N=354).
In Table 5 are reported the results obtained with the trained classifiers after balancing the dataset with ROSE (N = 254, hmult.majo = 0.01, hmult.mino = 0.01), which is now com-posed of 127 SAFE and 127 RISK instances.
Also in this case, the classification algorithm that appears to be the best performing is kNN, and the absence of false negatives can be seen in Table 6.
B. ASSISTED SEGMENTATION OF THE PALPEBRAL CONJUNCTIVA
In this phase of the study, selection of the palpebral con-junctiva took place in the manner described in the paragraph ‘Image segmentation’, i.e., assisting the patient or the doctor through the appropriate function based on the division of the image into superpixels. The experiment is important because the ultimate aim of this research is to build and disseminate a free tool that can be used independently by the patient as well as by specialized personnel. The best results have been obtained with kNN; therefore, we report only the values of this classifier in Table 7 and the related confusion matrices in Table 8.
Comparing the results obtained, we can conclude that the ROSE balancing algorithm is a little more effective than the SMOTE algorithm and allows the system to reduce to zero the probability of failure to alarm using the images of the con-junctiva extracted with the support of the SLIC Superpixels algorithm.
Clearly, a kNN classifier and features a∗ and EI make a reliable evaluation of the suspicion of anemia possible. Dataset balancing as described above, concur in satisfying the important constraint that requires zero false negatives. In fact, it is acceptable that some healthy people undergo blood
test-ing due to false positive results, while false negatives would not highlight a severe pathology, or the need of a transfu-sion. In this last case the diagnostic system is dangerously misleading.
The results described above were obtained without any customization of the software system with respect to the patient characteristics: as an example, taking into consid-eration characteristics that change the thresholds of anemia status, such as the gender and age of the patients, can lead to a significant improvement in performance. The photographs of the conjunctiva that we used for the experiment are taken without strict instructions, in order to simulate a condition of real use.
VII. CONCLUSION
This study is part of a research project for a non-invasive method for monitoring and identifying potential risk of anaemia. In this paper, a system to detect clinical signs of anaemia from digital images of an exposed tissue, specifically the palpebral conjunctiva, has been presented. The new acqui-sition device (spacer and lens) is not expensive and simple to use and greatly supports the acquisition of digital images for this analysis. In fact, the absence of ambient light in the acquisitions was found to be fundamental, making preventive standardization processes of the images superfluous. The use of colour clustering applied to images has allowed abstraction from irrelevant details. The dataset, appropriately balanced, allowed a better estimation of the relationship between the pathology and conjunctival pallor. In support of end users, the implementation of a classifier for forecasts attributable to two risk classes was useful. The obtained results guar-antee the reliability of the system and the possibility of using it as a personal monitoring tool. The obtained results
could: 1) considerably reduce the number of candidate sub-jects for blood sampling; 2) highlight the suspected anemic state of persons at risk, as 9-12 year old girls who experi-ence menarche; 3) help massive screening also where well-equipped laboratory facilities and trained personnel are often
unavailable as in resource-poor settings, especially in rural areas.
APPENDIX
REFERENCES
[1] E. Beutler, ‘‘The definition of anemia: What is the lower limit of nor-mal of the blood hemoglobin concentration?’’ Blood, vol. 107, no. 5, pp. 1747–1750, 2006. doi:10.1182/blood-2005-07-3046.
[2] M. Nelson, ‘‘Anaemia in adolescent girls: Effects on cognitive function and activity,’’ Proc. Nutrition Soc., vol. 55, no. 1B, pp. 359–367, 1996. doi:10.1079/pns19960035.
[3] Assessing the Iron Status of Populations, Report of a Joint World Health Organization/Centers for Disease Control and Prevention, Geneva, Switzerland, 2004.
[4] B. de Benoist, E. McLean, I. Egli, and M. Cogswell, Eds., ‘‘World-wide prevalence of anemia 1993-2005,’’ WHO Global Database Anaemia, Geneva, Switzerland, 2008.
[5] E. McLean, ‘‘WHO vitamin and mineral nutrition information system,’’ Worldwide Prevalence of Anaemia, Tech. Rep., 2008.
[6] WHO. Accessed: May 1, 2018. [Online]. Available: http://www.who.int/ nutrition/topics/ida/en/
[7] The World Health Report 2002: Reducing Risks, Promoting Healthy Life, World Health Organization, Geneva, Switzerland, 2002.
[8] J. D. Cook, C. H. Flowers, and B. S. Skikne ‘‘The quantitative assessment of body iron,’’ Blood, vol. 101, no. 9, pp. 3359–3364, 2003.
[9] M. J. Koury, Red Blood Cell Production and Kinetics. London, U.K.: Wiley, 2016. doi:10.1002/9781119013020.ch08.
[10] A. Porwit, J. McCullough, and W. N. Erber, Blood and Bone Marrow
Pathology. Edinburgh, Scotland: Elsevier, 2011.
[11] I. M. Benseñor, A. L. G. Calich, A. R. Brunoni, F. F. do Espírito-Santo, R. L. Mancini, L. F. Drager, and P. A. Lotufo, ‘‘Accuracy of anemia diagnosis by physical examination,’’ Sao Paulo Med. J., vol. 125, no. 3, pp. 170–173, 2007. doi:10.1590/s1516-31802007000300008.
[12] N. Tsumura, N. Ojima, K. Sato, M. Shiraishi, H. Shimizu, H. Nabeshima, H. Nabeshima, K. Hori, and K. Hori, ‘‘Image-based skin color and tex-ture analysis/synthesis by extracting hemoglobin and melanin informa-tion in the skin,’’ ACM Trans. Graph., vol. 22, no. 3, pp. 770–779, 2003.
[13] E. Angelopoulou, ‘‘Understanding the color of human skin,’’ in Proc. West
Electron. Imag. Int. Soc. Opt. Photon., 2001, pp. 243–251.
[14] M. G. N. Spinelli, J. M. P. Souza, S. B. de Souza, and E. H. Sesoko, ‘‘Reliability and validity of palmar and conjunctival pallor for anemia detection purposes,’’ Rev. Saude Publica, vol. 37, no. 4, pp. 404–408, 2003.
[15] H. Kalter, G. Burnham, P. R. Kolstad, M. Hossain, J. A. Schillinger, N. Z. Khan, S. Saha, V. de Wit, N. Kenya-Mugisha, B. Schwartz, and R. E. Black, ‘‘Evaluation of clinical signs to diagnose anaemia in uganda and Bangladesh, in areas with and without malaria,’’ Bull. World Health
Org., vol. 75, no. 1, p. 103, 1997.
[16] T. N. Sheth, N. K. Choudhry, M. Bowes, and A. S. Detsky, ‘‘The relation of conjunctival pallor to the presence of anemia,’’ J. Gen. Internal Med., vol. 12, no. 2, pp. 102–106, 1997.
[17] R. M. D. Silva and C. A. Machado, ‘‘Clinical evaluation of the paleness: Agreement between observers and comparison with hemoglobin levels,’’
Rev. Brasileira Hematol. Hemoterapia, vol. 32, no. 6, pp. 444–448, 2010. [18] K. V. Patel, ‘‘Epidemiology of anemia in older adults,’’ Seminars Hematol.,
vol. 45, no. 4, pp. 210–217, 2008.
[19] M. K. Hasan, N. Sakib, R. R. Love, and S. I. Ahamed, ‘‘RGB pixel analysis of fingertip video image captured from sickle cell patient with low and high level of hemoglobin,’’ in Proc. IEEE 8th Annu. Ubiquitous Comput.,
Electron. Mobile Commun. Conf. (UEMCON), 2017. doi: 10.1109/uem-con.2017.8249004.
[20] E. J. Wang, W. Li, D. Hawkins, T. Gernsheimer, C. Norby-Slycord, and S. N. Patel, ‘‘HemaApp: Noninvasive blood screening of hemoglobin using smartphone cameras,’’ in Proc. Int. Joint Conf. Pervasive
Ubiqui-tous Comput. (UbiComp), New York, NY, USA, 2016, pp. 593–604. doi: 10.1145/2971648.2971653.
[21] M. K. Hasan, M. Haque, N. Sakib, R. Love, and S. I. Ahamed, ‘‘Smartphone-based human hemoglobin level measurement analyzing pixel intensity of a fingertip video on different color spaces,’’ Smart Health, vols. 5–6, pp. 26–39, Jan. 2018. doi:10.1016/j.smhl.2017.11.003. [22] E. J. Wang, W. Li, J. Zhu, R. Rana, and S. N. Patel,
‘‘Noninva-sive hemoglobin measurement using unmodified smartphone camera and white flash,’’ in Proc. 39th Annu. Int. Conf. IEEE Eng. Med.
Biol. Soc. (EMBC), Seogwipo, South Korea, 2017, pp. 2333–2336. doi: 10.1109/EMBC.2017.8037323.
[23] V. Bevilacqua, G. Dimauro, F. Marino, A. Brunetti, F. Cassano, A. Di Maio, E. Nasca, G. F. Trotta, F. Girardi, A. Ostuni, and A. Guarini, ‘‘A novel approach to evaluate blood parameters using computer vision techniques,’’ in Proc. IEEE Int. Symp. Med. Meas. Appl. (MeMeA), May 2016, pp. 1–6. doi:10.1109/memea.2016.7533760.
[24] C. I. Sanchez-Carrillo, T. de Jesus Ramirez-Sanchez, and B. J. Selwyn, ‘‘Test of a noninvasive instrument for measuring hemoglobin concentra-tion,’’ Int. J. Technol. Assessment Health Care, vol. 5, no. 4, pp. 659–667, 1989.
[25] S. Suner, G. Crawford, J. McMurdy, and G. Jay, ‘‘Non-invasive determi-nation of hemoglobin by digital photography of palpebral conjunctiva,’’
J. Emerg. Med., vol. 33, no. 2, pp. 105–111, 2007.
[26] Y.-M. Chen, S.-G. Miaou, and H. Bian, ‘‘Examining palpebral conjunctiva for anemia assessment with image processing methods,’’ Comput.
Meth-ods Programs Biomed., vol. 137, pp. 125–135, Dec. 2016. doi:10.1016/ j.cmpb.2016.08.025.
[27] Y.-M. Chen and S.-G. Miaou, ‘‘A Kalman filtering and nonlinear penalty regression approach for noninvasive anemia detection with palpe-bral conjunctiva images,’’ J. Healthcare Eng., vol. 2017, Jul. 2017, Art. no. 9580385. doi:10.1155/2017/9580385.
[28] O. Kim, J. McMurdy, G. Jay, C. Lines, G. Crawford, and M. Alber, ‘‘Combined reflectance spectroscopy and stochastic modeling approach for noninvasive hemoglobin determination via palpebral conjunctiva,’’
Physiol. Rep., vol. 2, no. 1, 2014, Art. no. e00192.
[29] G. Dimauro, D. Caivano, and F. Girardi, ‘‘A new method and a non-invasive device to estimate anemia based on digital images of the conjunctiva,’’
IEEE Access, vol. 6, pp. 46968–46975, 2018.
[30] G. Dimauro, L. Baldari, D. Caivano, G. Colucci, and F. Girardi, ‘‘Auto-matic segmentation of relevant sections of the conjunctiva for non-invasive anemia detection,’’ in Proc. 3rd Int. Conf. Smart Sustain. Technol.
(SpliTech), Split, Croatia, Jun. 2018, pp. 1–5.
[31] R. Achanta, A. Shaji, K. Smith, A. Lucchi, P. Fua, and S. Süsstrunk, ‘‘SLIC superpixels compared to state-of-the-art superpixel methods,’’ IEEE Trans.
Pattern Anal. Mach. Intell., vol. 34, no. 11, pp. 2274–2282, Nov. 2012. doi: 10.1109/TPAMI.2012.120.
[32] S. Collings, O. Thompson, E. Hirst, L. Goossens, A. George, and R. Weinkove, ‘‘Non-invasive detection of anaemia using digital pho-tographs of the conjunctiva,’’ PLoS ONE, vol. 11, no. 4, 2016, Art. no. e0153286. doi:10.1371/journal.pone.0153286.
[33] M. Setaro and A. Sparavigna, ‘‘Quantification of erythema using digital camera and computer-based colour image analysis: A multicentre study,’’
Skin Res. Technol., vol. 8, no. 2, pp. 84–88, 2002. doi: 10.1034/j.1600-0846.2002.00328.x.
[34] T. Yamamoto, H. Takiwaki, S. Arase, and H. Ohshima, ‘‘Derivation and clinical application of special imaging by means of digital cameras and Image J freeware for quantification of erythema and pigmentation,’’ Skin
Res. Technol.vol. 14, no. 1, pp. 26–34, Feb. 2008. doi: 10.1111/j.1600-0846.2007.00256.x.
[35] A. K. Jain, Fundamentals of Digital Image Processing. Upper Saddle River, NJ, USA: Prentice-Hall, 1989, pp. 68, 71, and 73.
[36] G. Menardi and N. Torelli, ‘‘Training and assessing classification rules with imbalanced data,’’ Data Mining Knowl. Discovery, vol. 28, no. 1, pp. 92–122, 2014.
[37] N. V. Chawla, K. W. Bowyer, L. O. Hall, and W. P. Kegelmeyer, ‘‘SMOTE: Synthetic minority over-sampling technique,’’ J. Artif. Intell. Res., vol. 16, no. 1, pp. 321–357, 2002.
[38] T. Kim, S. H. Choi, N. Lambert-Cheatham, Z. Xu, J. E. Kritchevsky, F.-R. Bertin, and Y. L. Kim, ‘‘Toward laboratory blood test-comparable photometric assessments for anemia in veterinary hematology,’’ J. Biomed.
Opt., vol. 21, no. 10, Oct. 2016, Art. no. 107001,
[39] M. D. Anggraeni and A Fatoni, ‘‘Non-invasive self-care anemia detection during pregnancy using a smartphone camera,’’ in Proc. IOP Conf. Ser.,
Mater. Sci. Eng., vol. 172, 2017, Art. no. 012030.
[40] R. Muthalagu, V. T. Bai, and S. John. A Smart (Phone) Solution: An
Effec-tive Tool for Screening Anaemia—Correlation With Conjunctiva Pallor and Haemoglobin Levels. Accessed: May 6, 2019. [Online]. Available: http://tagajournal.com/gallery/v14.244.pdf
[41] M. K. Hasan, M. M. Haque, R. Adib, J. F. Tumpa, A. Begum, R. R. Love, Y. L. Kim, and I. A. Sheikh, ‘‘SmartHeLP: Smartphone-based hemoglobin level prediction using an artificial neural network,’’ in Proc. Annu. Symp.
[42] G. M. T. Ahsan, M. O. Gani, K. Hasan, S. I. Ahamed, W. Chu, M. Adibuzzaman, and J. Field, ‘‘A novel real-time non-invasive hemoglobin level detection using video images from smartphone camera,’’ in Proc. IEEE 41st Annu. Comput. Softw. Appl. Conf. (COMPSAC), Turin, Italy, Jul. 2017, pp. 967–972. doi:10.1109/COMPSAC.2017.29. [43] R. G. Mannino, D. R. Myers, E. A. Tyburski, C. Caruso, J. Boudreaux,
T. Leong, G. D. Clifford, and W. A. Lam, ‘‘Smartphone app for non-invasive detection of anemia using only patient-sourced photos,’’ Nature
Commun., vol. 9, Dec. 2018, Art. no. 4924.
GIOVANNI DIMAURO was born in Taranto, Italy, in 1964. He received the Laurea degree in computer sciences from the Università degli Studi di Bari ‘‘Aldo Moro," in 1987, where he is cur-rently an Associate Professor of computer pro-gramming, multimedia systems, and cooperative systems. His research activities, described in more than 150 papers published in scientific journals, proceedings, and books, include e-health, multi-media systems, and pattern recognition with appli-cations in medicine such as new diagnosis technology for anemia and in Parkinson’s disease.
ATTILIO GUARINI received the Laurea degree in medicine and surgery from the Università degli Studi di Bari ‘‘Aldo Moro." He is an Expert in hematology. He is specialized in general hematol-ogy and oncolhematol-ogy with the Università degli Studi di Bari ‘‘Aldo Moro." He is currently the Direc-tor of the complex hematology structure at the Giovanni Paolo II Cancer Institute, Bari, and the Medical Area Department. He is also a Teacher at the Schools of Specialization in Hematology, Infectious Diseases, and Obstetric, Università degli Studi di Bari ‘‘Aldo Moro." He is a Principal Investigator in national and international clinical trials. He has authored or coauthored more than 150 scientific contributions, including scientific papers and abstracts in national and international jour-nals. He is a member of many scientific boards.
DANILO CAIVANO graduated from the Univer-sità degli Studi di Bari ‘‘Aldo Moro" and received the Ph.D. degree from the Università degli Studi di Bari ‘‘Aldo Moro," in 2002, where he is currently an Associate Professor of software engineering. He carries out his research at the Software Engi-neering Laboratory, Department of Informatics. Since 2007, he has been the Chief Executive Offi-cer of SER&Practices, a spin-off company of the Università degli Studi di Bari ‘‘Aldo Moro" that he has contributed to start up. He is actively involved in the Project Man-agement Institute–Southern Italy Chapter and in the International Software Engineering Research Network. His research and teaching activities focus on topics related to software engineering with an emphasis on project and process management in collocated and distributed contexts and on software development, maintenance, and testing.
FRANCESCO GIRARDI was born in Bari, Italy, in 1962. He received the degree in medicine and surgery from the Università degli Studi di Bari ‘‘Aldo Moro," in 1986, and the bachelor’s degree in computer science, in 2013. In 1989, he is specialized in general hematology at the Università degli Studi di Bari ‘‘Aldo Moro." Since 2013, he has been cooperating with the Computer Science Department, Università degli Studi di Bari ‘‘Aldo Moro," and with the Elec-tric and Electronic Engineer Department, Politecnico of Bari. He is with Azienda Sanitaria Locale (ASL) Bari, Italy. His research activity includes e-health.
CRESCENZA PASCIOLLA was born in Putignano, Bari, in 1985. She is graduated in medicine and surgery from the Università degli Studi di Bari ‘‘Aldo Moro," Italy, where she is specialized in hematology. She performs clinical activity as a Hematologist at the Department of Hematology with Transplantation at the Giovanni Paolo II Can-cer Institute. She has authored many abstracts and publications in Italian and international journals. Her main field of research concerns the transplan-tation of hematopoietic stem cells in the field of hematological diseases malignant. She is enrolled in the Italian Hematology Society (SIE). She is also a member of the Italian Bone Marrow Transplantation Group (GITMO).
ANGELA IACOBAZZI received the Laurea degree in medicine and surgery from the Università degli Studi di Bari ‘‘Aldo Moro" and is an expert in hematology. She is specialized in general hema-tology and oncology at the Università degli Studi di Bari ‘‘Aldo Moro." she is currently the Vice Director of the complex hematology structure at the Giovanni Paolo II Cancer Institute, Bari. She has authored or coauthored many contribu-tions, including scientific papers and abstracts in national and international journals.