Development of novel methodologies for the optimization
of production processes of biopharmaceuticals.
Sviluppo di nuove metodologie per l’ottimizzazione dei
processi di produzione di prodotti biofarmaceutici
Dottorando: Marco Barba (XXI ciclo)
Academic supervisor: dott. Fabio Polticelli
Marco Barba
TABLE OF CONTENTS
DEFINITIONS AND ABBREVIATIONS ... I SUMMARY ... II RIASSUNTO...IV
1 INTRODUCTION... 1
1.1 PAT (Process Analytical Technology) ... 1
1.2 PAT tools... 2
1.2.1 Multivariate tools for data analysis... 3
1.2.2 Process analyzers... 3
1.2.3 Process control tools... 3
1.3 PAT principles ... 4
1.3.1 Real time release... 4
1.3.2 Risk-based approach... 4
1.4 Spectroscopic techniques ... 4
1.4.1 Circular Dichroism spectroscopy (CD) ... 4
1.4.2 Fourier- transformed infrared spectroscopy (FT-IR) ... 7
1.4.3 Raman spectroscopy ... 8
1.4.4 UV-Vis absorption spectroscopy ... 10
1.4.5 Fluorescence spectroscopy ... 11
1.5 Chemometrics analysis... 12
1.5.1 Principal component analysis (PCA)... 13
1.5.2 Partial least squares projection to latent structures (PLS)... 15
1.5.2.1 Orthogonal Partial Least Squares (O-PLS) ... 16
1.5.3 Multivariate calibration ... 17
1.6 Protein design ... 17
1.7 Aim of the thesis ... 18
2 RESULTS AND DICUSSION ... 19
2.1 Multi-Spectroscopic characterization of drug substance... 19
2.1.1 CD spectroscopy analysis ... 19
2.1.2 PCA analysis of CD spectra ... 21
2.1.3 FT-IR spectroscopy analysis... 25
2.1.4 PCA analysis of FT-IR spectra. ... 26
2.1.5 UV-Vis spectroscopy analysis... 27
2.1.6 PCA analysis of UV-Vis spectra ... 30
2.1.7 UV-Vis-NIR spectroscopy... 34
2.1.8 Raman scattering ... 41
2.1.9 PCA of Raman scattering spectra ... 42
2.1.10 Fluorescence mapping and emission... 43
2.1.11 Fluorimetry Second-order scatter mapping... 55
2.2 Quantification of degradation products by using CD and IR in combination with MVDA ... 57
2.2.1 CD spectra of matrix samples... 57
2.2.2 IR spectra of matrix samples ... 58
2.2.3 QC analysis of matrix samples ... 59
2.2.4 PLS/O-PLS model of CD spectra ... 60
2.2.5 PLS/O-PLS model of FT-IR spectra... 63
2.3 Engineering of metal-binding proteins based on conopeptides scaffold ... 71
2.3.1 Design of the metal binding site ... 71
2.3.2 Cupryphan metal binding ability probed by optical and fluorescence spectroscopy ... 72
2.3.3 EPR spectroscopy characterization of Cupryphan... 74
2.3.4 NMR spectroscopy characterization of Cupryphan ... 75
2.3.5 Design and characterization of the Arg-Cupryphan variant ... 78
2.3.6 Determination of superoxide dismutase activity of Cupryphans ... 79
3 CONCLUSIONS ... 80
3.1 Multispectroscopic characterization of drug substance... 80
3.1.1 Concentrated stock solutions ... 80
3.1.2 Ambient stored diluted solutions. ... 80
3.1.3 Individual spectroscopies... 81
3.2 Quantification of degradation products by using CD and IR in combination with MVDA ... 82
3.3 Engineering of metal-binding proteins based on conopeptides scaffold ... 84
REFERENCES... 85
LIST OF TABLES
Table 1. Characteristic amide bands in Raman spectra of proteins... 9Table 2. pH values of 4°C and room temperature stored solutions... 20
Table 3 Fluorescence maxima in Raman spectra... 42
Table 4. Ranges covered by the calibration matrix ... 57
Table 5. Observed vs. theoretical degradation values... 59
Table 6. RMSEE values of CD and IR combined-based PLS models ... 67
Table 7. RMSEP values of CD and IR combined-based PLS models ... 68
Table 8. RMSEE values of CD and IR combined-based O-PLS models... 69
Table 9. RMSEP values of CD and IR combined-based O-PLS models... 70
Table 10. Assignments of 1H and 13C resonances of Cupryphan in D2O at 300K, pH 8.0... 76
Table 11 Superoxide dismutase activity of Cupryphans... 79
LIST OF FIGURES
Figure 1. Origin of CD effect ... 5Figure 2. Far-UV spectra associated with various types of secondary structure... 6
Figure 3. The near-UV CD spectrum ... 6
Figure 4. Major vibrational modes for a non-linear group, CH2... 7
Figure 5. Infrared spectra of proteins ... 8
Figure 6. Origin of Rayleigh and Raman effect... 9
Figure 7. Spectral characteristics of chromophores in proteins ... 10
Figure 8. Schematic energy level diagram for absorbance and fluorescence... 11
Figure 9. Fluorescence spectrum of Trp ... 12
Figure 10. Notation used in PCA ... 14
Figure 11. A geometric interpretation of PCA ... 14
Figure 12. Principal components of PCA... 15
Figure 13. PLS regression model ... 16
Figure 14. Near-UV CD spectra of concentrated samples... 19
Marco Barba
Figure 16. Far-UV CD spectra of diluted samples ... 21
Figure 17. PCA score plot of near-UV CD spectra of concentrated samples ... 21
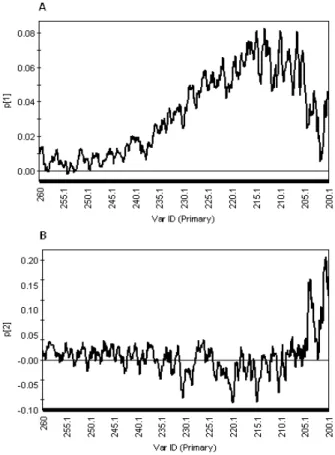
Figure 18. PCA loading plots of CD near-UV spectra of concentrated samples. ... 22
Figure 19. PCA score plot of near-UV CD spectra of diluted samples... 23
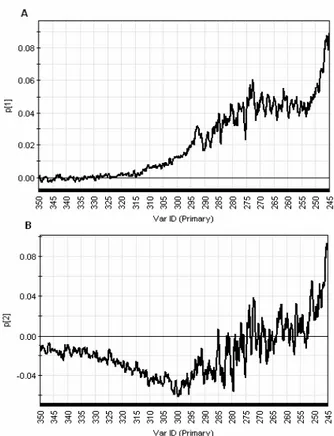
Figure 20. PCA loading p1 plot of near-UV CD spectra of diluted samples ... 23
Figure 21. PCA loading plot p2 of near-UV CD spectra of diluted samples ... 24
Figure 22. PCA score plot of far-UV spectra... 24
Figure 23. PCA loading plots of far-UV spectra... 25
Figure 24. FT-IR spectra of concentrated samples ... 26
Figure 25. PCA score plot of FT-IR spectra ... 26
Figure 26 PCA loading plot p1 of FT-IR spectra... 27
Figure 27 PCA loading plot p2 of FT-IR spectra... 27
Figure 28. UV-Vis spectra of concentrated samples ... 28
Figure 29. UV-Vis spectra of dilute samples (room temperature) ... 29
Figure 30. UV-Vis spectra of diluted samples (4°C)... 29
Figure 31. PCA score plot of UV-Vis spectra of concentrated samples... 30
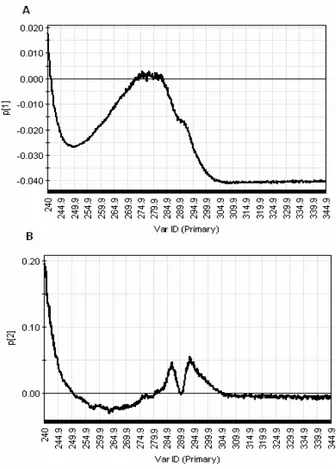
Figure 32. PCA loading plots of UV-Vis spectra of concentrated samples... 31
Figure 33. PCA score plot of UV-Vis spectra of diluted samples (room temperature) ... 32
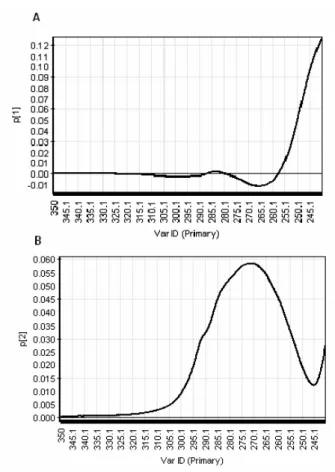
Figure 34. PCA loading plots of UV-Vis spectra of diluted samples (room temperature) ... 32
Figure 35. PCA score plot of UV-Vis spectra of diluted samples (4°C)... 33
Figure 36. PCA loading plots of UV-Vis spectra of diluted samples (4°C)... 34
Figure 37. Vis region of normalized UV-Vis-NIR spectra of concentrated samples ... 34
Figure 38. NIR region of normalized UV-Vis-NIR spectra of concentrated samples... 35
Figure 39. UV-Vis-NIR normalised spectra of diluted samples ... 35
Figure 40. NUV region of UV-Vis-NIR spectra of diluted samples... 36
Figure 41. Visible region of UV-Vis-NIR spectra of diluted samples... 36
Figure 42. NIR region of UV-Vis-NIR spectra of diluted samples. ... 37
Figure 43. PCA score plot of UV-Vis-NIR spectra of concentrated samples ... 37
Figure 44. PCA loading plots of UV-Vis-NIR spectra of concentrated samples ... 38
Figure 45. PCA score plot of Vis region of UV-Vis-NIR spectra of diluted samples ... 39
Figure 46 Vis region PCA loading plot p1 of UV-Vis-NIR spectra of diluted samples... 39
Figure 47. NUV PCA score plot of UV-Vis-NIR spectra of diluted samples... 40
Figure 48. NUV PCA loading plot p1 of UV-Vis-NIR spectra of diluted samples ... 40
Figure 49. NUV PCA loading plot p2 of UV-Vis-NIR spectra of diluted samples ... 41
Figure 50. Raman scattering of concentrated samples ... 41
Figure 51. PCA score plot of Raman spectra... 42
Figure 52. PCA loading plots of Raman spectra... 43
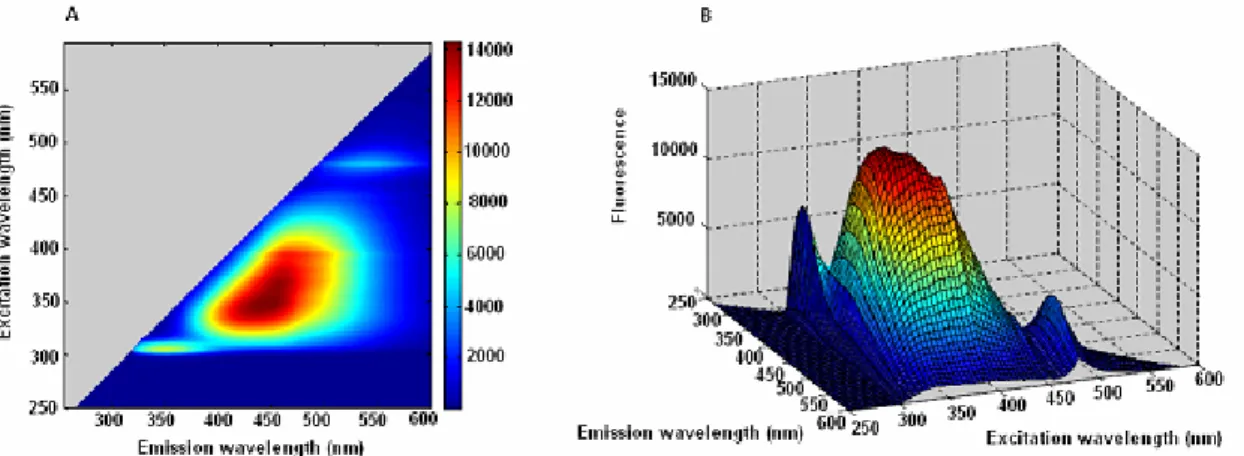
Figure 53. Excitation-emission map of drug substance... 44
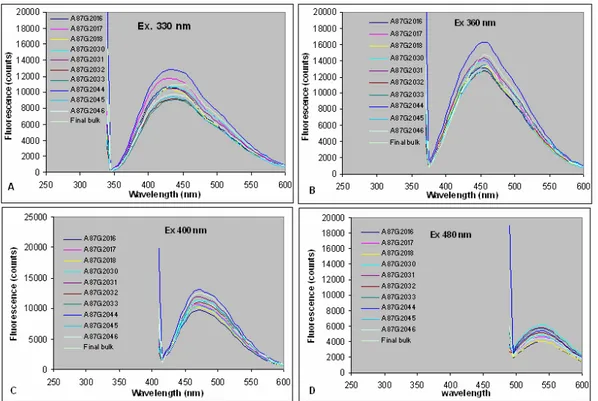
Figure 54. Fluorescence emission spectra at different excitation ... 44
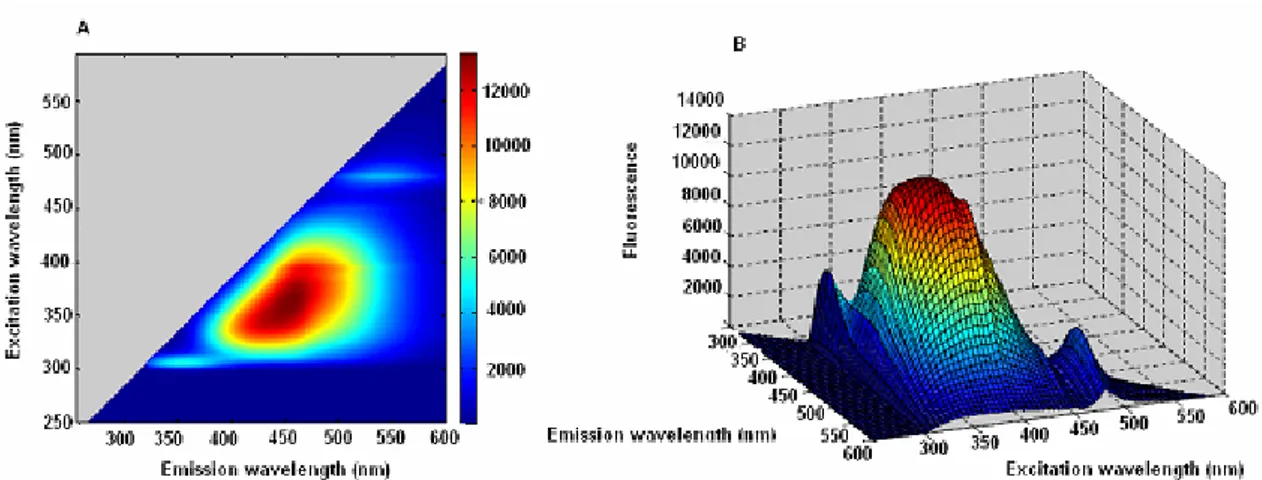
Figure 55. Fluorescence excitation-emission maps of A87G2016 ... 45
Figure 56. Fluorescence excitation-emission maps of A87G2017 ... 45
Figure 57. Fluorescence excitation-emission maps of A87G2018 ... 46
Figure 58. Fluorescence excitation-emission maps of A87G2030 ... 46
Figure 59. Fluorescence excitation-emission maps of A87G2031 ... 46
Figure 60. Fluorescence excitation-emission maps of A87G2032 ... 47
Figure 61. Fluorescence excitation-emission maps of A87G2033 ... 47
Figure 62. Fluorescence excitation-emission maps of A87G2044 ... 47
Figure 63. Fluorescence excitation-emission maps of A87G2045 ... 48
Figure 64. Fluorescence excitation-emission maps of A87G2046 ... 48
Figure 65. Fluorescence excitation-emission maps of final bulk ... 48
Figure 66. Fluorescence map of diluted samples ... 49
Figure 67. Fluorescence excitation-emission maps of A87G2016 and A87G2017 ... 50
Figure 68. Fluorescence excitation-emission maps of A87G2018 and A87G2030 ... 50
Figure 69. Fluorescence excitation-emission maps of A87G2031 and A87G2032 ... 51
Figure 71. Fluorescence excitation-emission maps of A87G2045 and A87G2046 ... 52
Figure 72. Fluorescence excitation-emission maps of final bulk ... 52
Figure 73. PCA score plot of fluorescence map of concentrated samples ... 53
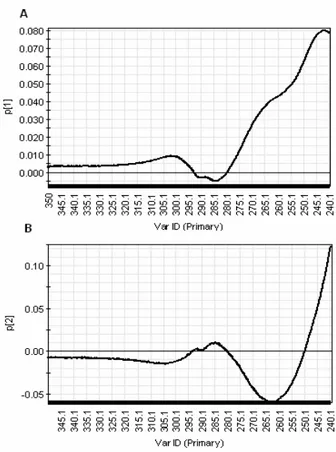
Figure 74. PCA loading plots of fluorescence map of concentrated samples ... 54
Figure 75. PCA score plot of fluorescence maps of diluted samples ... 54
Figure 76. PCA loading plots of fluorescence maps of diluted samples ... 55
Figure 77. Fluorescence maps of diluted samples ... 56
Figure 78. Fluorescence maps of scattering region ... 56
Figure 79. Near-UV CD normalised spectra ... 57
Figure 80. Far-UV CD normalized spectra ... 58
Figure 81. IR spectra of matrix samples ... 58
Figure 82. QC vs. PLS-predicted degradation values for near and far UV combined... 60
Figure 83. QC vs. PLS-predicted degradation values for near and far-UV... 61
Figure 84. RMSEP values for CD-based PLS models... 61
Figure 85. QC vs. O-PLS predicted degradation values for near and far-UV combined ... 62
Figure 86. QC vs. O-PLS predicted degradation values for near and far-UV... 62
Figure 87. RMSEP values of CD based O-PLS models... 63
Figure 88. QC vs. PLS predicted degradation values for IR spectra ... 64
Figure 89. RMSEP values of IR-based PLS models ... 64
Figure 90. QC vs. O-PLS predicted degradation values for IR spectra... 65
Figure 91. RMSEP values of IR-based O-PLS models... 66
Figure 92. QC vs. PLS predicted degradation values for CD and IR spectra combined ... 67
Figure 93. RMSEP values of CD and IR combined PLS models... 68
Figure 94. QC vs. O-PLS predicted degradation values for CD and IR spectra combined ... 69
Figure 95. RMSEP values of CD and IR combined O-PLS models... 70
Figure 96. Amino acid sequence of Cupryphans... 71
Figure 97. Energy minimized three-dimensional model of cupryphans ... 72
Figure 98. Emission fluorescence spectra of Cupryphan in presence of Cu2+ ions ... 73
Figure 99. Kd determination of Cu2+ to Cupryphan by fluorescence quenching experiments ... 73
Figure 100. Optical spectra of Cupryphan... 74
Figure 101. EPR spectra of Cupryphan ... 75
Figure 102. Titration of Contryphan-Vn with CuCl2 monitored by 1H-NMR... 75
Figure 103. Titration of Cupryphan with CuCl2 monitored by 1H NMR ... 77
Marco Barba Definitions and Abbreviations
DEFINITIONS AND ABBREVIATIONS
ATR Attenuated Total Reflectance
CD Circular Dichroism
DS Drug Substance
EDTA Ethylene Diamine Tetra-Acetic Acid
EMEA European Medicine Agency
EPR Electron Spin Resonance
FDA Food and Drug Administration
FT-IR Fourier Transform Infrared
HPLC High Pressure Liquid Chromatography
IE-HPLC Ion Exchange High Pressure Liquid Chromatography MVDA Multivariate Data Analysis
NIR Near Infrared
NMR Nuclear Magnetic Resonance
O-PLS Orthogonal Partial Least Squares
PAT Process Analytical Technologies
PC Principal Component
PCA Principal Component Analysis
PDB Protein Data Base
PLS Partial Least Squares
PTM Post Translational Modification
QC Quality Control
RMSEE Root Mean Square Error of Estimation RMSEP Root Mean Square Error of Prediction
ROESY Rotational nuclear Overhauser Effect Spectroscopy RP-HPLC Reverse Phase High Pressure Liquid Chromatography SE-HPLC Size Exclusion High Pressure Liquid Chromatography
SOD SuperOxide Dismutase
TFA Trifluoroacetic Acid
TOCSY Total Correlated Spectroscopy
UPLC Ultra Performance Liquid chromatography
SUMMARY
Process Analytical Technology (PAT) is defined by the FDA as a “System for designing, analyzing and controlling manufacturing through timely measurements of critical quality and performance attributes of raw and in-process materials and processes, with the goal of ensuring final product quality”. The goal of implementing PAT is defined therein as enhancing the understanding and the control of a production process. This broad definition encompasses testing of raw material for batch consistency as well as online sensors that provide feedback for the process control. In this context, rapid methods placed at-line, i.e. close to the process, can be considered to be PAT applications since they will both contribute to the understanding how individual steps impact on product quality and will accelerate and facilitate process development and optimization decisions. There are many tools available that enable process understanding for scientific, pharmaceutical development. These tools can provide effective and efficient means for acquiring information to facilitate process understanding and continuous improvement. From a physical, chemical and biological perspective, pharmaceutical products and processes are complex multi-factorial systems. Methodological experiments based on multivariate statistical principles provide useful means for the identification and study the effect and interaction of product and process variables. Traditional one-factor-at-time experiments cannot address these kinds of interactions. These tools enable the identification and evaluation of product and processes variables that may be critical to product quality and performance.
Thanks to the PAT initiative, spectroscopic sensors systems have gained interest for bioprocess monitoring because they allow rapid and non-destructive monitoring of product quality attributes. The improvements in spectrometers, detectors and optics have led to interesting applications related to PAT.
The main goal of the thesis is the development of novel methodologies based on spectroscopic techniques coupled with multivariate data analysis for the optimization of production process of biopharmaceuticals.
One of the approaches described here combines the strengths of various spectroscopic techniques, such as Circular Dichroism (CD), Infrared (IR), Raman, Fluorescence and UV-Visible-NIR measurements, to provide a more comprehensive description of a substance, the so-called “fingerprint”. This, in combination with Principal Component Analysis (PCA) may be use to establish and define quality, equivalence, and comparability of substances while also providing a means to monitor processes and provide relevant information about molecular changes in product. Moreover, it can highlight the relationships between different properties, for example that between structure and aggregation, and a better understanding of the nature of a product. The potential of such a fingerprint has an impact in a wide variety of areas within biopharmaceutical research and development.
The protein used in this study is a homo-dimeric Fc-fusion protein. In particular, for this first part of the project, focused on PCA of multispectroscopic data, were used ten batches of drug substance produced with the current process called “process C”. This bulk material has a concentration of “not less than” 160 mg/ml. Within this set, the batches differ with respect to hydrolysates that were used as feed during the fermentation process. In addition to these difference, three additional batches form the new “process D”, after some minor optimisations with respect to “process C”, were analysed. In order to generate a wider diversity of samples, with aspects of deterioration, solutions were diluted with water (instead of using a buffer) and then stored at room temperature for several weeks before spectroscopic analysis. The major consequence of this treatment is a change in buffer/additive concentrations, a change in pH, and a deterioration of solutions through aggregation, structural and chemical decomposition.
A comprehensive set of spectra of eleven batches thus were acquired, using a variety of techniques. Some twelve variants of five spectroscopies have been employed, covering the complete wavelength range from far-ultra violet to infrared and involving phenomena including absorption, fluorescence, Raman scattering, Rayleigh scattering and circular dichroism. Both concentrated stock and deliberately deteriorated dilute solutions were investigated. All of the techniques employed have yielded useful data of some forms in terms of identifying variance in the batches and are potentially complementary and cross-supporting.
Marco Barba Summary
Each set of spectra were subjected to multivariate data analysis, primarily PCA, to highlight patterns and differences between batches. Such analysis highlighted an apparent connection between the spectra and the history of batches regarding production date and hydrolysate type used. In particular, a series of anomalous absorptions in the visible wavelength region, together with potentially related fluorescent species, were identified. These may derive from contaminants, post-translational modifications (PTM) dependent on production conditions.
Another aim of the thesis was to assess the feasibility of obtaining quantitative data about degradation products of a therapeutic protein when employing Circular Dichroism and infrared spectroscopy in combination with multivariate data analysis, primarily Partial Least Squares (PLS) regression, and an extension of PLS, Orthogonal Partial Least Squares (O-PLS). This is a novel approach since the classical applications for CD and IR spectroscopy are the determination of secondary structure content of proteins. Also the use of multivariate statistical methods for the determination of secondary structure content is reported. Nevertheless, the present approach is to our knowledge the first one that seeks to exploit PLS in order to correlate CD and IR spectral data with quantitative data of common protein degradation forms.
In order to generate a suitable calibration matrix, a set of samples containing pre-defined levels of aggregates, oxidized forms, and free Fc, was generated. In order to ensure non-correlation of the degradation levels within the calibration matrix, the target concentrations therein were chosen according to an approach described by Brereton (2000). All the samples generated were then analyzed separately for each of the three degradation forms employing dedicated chromatographic QC assays in order to obtain accurate degradant levels. Furthermore, both CD (near and far UV) and IR spectra were measured. Both the QC and the spectroscopic data form the basis for the generation of various PLS/O-PLS models, i.e. based respectively CD or IR spectra alone, as well as CD and IR data combined.
The feasibility of employing PLS/O-PLS analysis to extract quantitative data for common protein degradation forms was successfully demonstrated for an Fc fusion protein. Both CD and IR spectra contained the relevant information, nevertheless, CD-based O-PLS models achieved a higher accuracy compared to that of IR-based models for predicting aggregate and oxidation levels, while the accuracy for free Fc levels could be equally well predicted. Combining CD and IR data improved the accuracy of the prediction for all degradation forms. In addition, we demonstrated that O-PLS models yielded to a better accuracy compared to that obtained with PLS models.
The last part of the thesis is based on the “protein design” methodologies. Aim of the present thesis is to study the scaffold stability of contryphan-Vn, a small peptide isolated from the venom of Conus ventricosus formed by only 9 residues and characterized by the presence of a single disulfide bridge, after substitution of 4 of 9 amino acids of its sequence.
Contryphans are bio-active peptides, isolated from the venom of marine snails of the genus Conus, which are characterized by the short length of the polypeptide chain and the high degree of unusual post-translational modifications. The cyclization of the polypeptide chain through a single disulphide bond, the presence of two conserved Pro residues and the epimerization of a Trp/Leu residue confer to Contryphans a stable and well defined structure in solution, conserved in all members of the family. The potential of Contryphans as scaffolds for the design of redox-active (macro)molecules was tested by engineering a copper binding site on two different variants of the natural peptide Contryphan-Vn, named Cupryphan and Arg-Cupryphan through the introduction of four His residues. The binding site was designed by computational modelling and the redesigned peptides were synthesized and characterized by optical, fluorescence, electron spin resonance and nuclear magnetic resonance spectroscopy.
The novel peptides, named Cupryphan and Arg-Cupryphan bind Cu2+ ions with a 1:1 stoichiometry and a Kd = 1.3(± 0.2) × 10-7 M and 1.0(± 0.4) × 10-7 M, respectively. Other divalent metals (e.g. Zn2+ and Mg2+) are bound with much lower affinity. In addition, Cupryphans catalyze the dismutation of superoxide anions with an activity comparable to other non-peptidic superoxide dismutase mimicks.
We tested the potential of conopeptides as scaffolds for the engineering of novel, metal based, biocatalysts starting from the simplest prototype of disulphide constrained conopeptides: the Contryphans. The results of the present work indicate that indeed this class of peptides could be successfully exploited to engineer novel, stable and redox active macromolecules.
RIASSUNTO
La produzione di prodotti biofarmaceutici è un processo complesso che si evolve costantemente durante l’intero sviluppo di un prodotto. Negli ultimi 30 anni sono stati fatti significativi progressi nello sviluppo di metodi di analisi delle caratteristiche chimiche (es. identità e purezza) di un prodotto. Nonostante ciò, alcuni aspetti chimico-fisici dei componenti di prodotti biofarmaceutici non sono ancora di facile comprensione. Di conseguenza, l’inerente e non rilevata variabilità dei materiali grezzi può manifestarsi anche nel prodotto finale. In più l’esigenza di aumentare la produzione e/o la purezza di un determinato prodotto potrebbe richiedere lo sviluppo di un nuovo processo o l’ottimizzazione dello stesso. L’eterogeneità di un prodotto biofarmaceutico può derivare anche da variazioni nel processo di produzione, risultando nella presenza di varie forme di modificazioni post-traduzionali o prodotti di degradazione. Chiaramente, l’obiettivo primario dello sviluppo o ottimizzazione di un dato processo di produzione è quello di ottenere la massima purezza del prodotto, minimizzando quindi le sue eventuali forme di degradazione. Nondimeno, soprattutto per molecole sul mercato e usate nei “clinical trial”, è molto importante assicurare la consistenza della molecola e dei suoi parametri critici di qualità, in modo da assicurare che qualsiasi cambiamento nel processo di produzione non influisca negativamente sulla sicurezza ed efficacia della stessa. Quindi, con l’obiettivo di accelerare i tempi di sviluppo, c’e’ un chiaro bisogno di sviluppare nuovi metodi che riducano i tempi di analisi sui campioni e allo stesso tempo massimizzino l’informazione ottenuta.
Process Analytical Technology (PAT) è definita come un “sistema per lo sviluppo, analisi e controllo della produzione attraverso misure appropriate dei parametri critici di qualità dei materiali grezzi e dei processi stessi, con l’obiettivo di assicurare la massima qualità del prodotto finale”. L’obiettivo della PAT è definito quindi come un aumentata comprensione e controllo dei processi di sviluppo. Questa definizione generale comprende test di consistenza sui materiali cosi come “sensori” on-line che forniscano informazioni per il controllo del processo. In questo ambito, metodi analitici rapidi posti in stretta vicinanza del processo possono essere considerati in conformità con quanto dettato dalla PAT, in quanto possono sia contribuire ad una maggiore comprensione di come ogni singolo step del processo possa influenzare la qualità del prodotto, sia accelerare e facilitare lo sviluppo e l’ottimizzazione dello stesso.
Esistono molti strumenti che pemettono una migliore comprensione dello sviluppo scientifico e farmaceutico. Questi possono fornire reali mezzi per acquisire informazioni volte a facilitare la comprensione di un dato processo e il suo continuo miglioramento. Da un punto di vista chimico e biologico, i prodotti biofarmaceutici e i processi di produzione sono complessi sistemi multifattoriali. Esperimenti metodologici basati su principi di statistica multivariata forniscono dei mezzi molto utili per l’identificare e studiare l’effetto e l’interazione tra prodotto e variabili del processo. I tradizionali esperimenti univariati (che analizzano un fattore alla volta) non sono in grado di identificare questo tipo di interazioni. Quindi, l’analisi multivariata permette di valutare quali variabili del prodotto e del processo possono essere cruciali per la qualità e la performance del prodotto finale. Grazie alla PAT, la spettroscopia ha guadagnato molto interesse per i processi di monitoraggio in quanto permette analisi rapide e non distruttive per il prodotto. In più, i miglioramenti raggiunti negli strumenti, nei detector e nelle ottiche hanno condotto ad interessanti iniziative conformi alla PAT.
L’obiettivo principale di questa tesi è lo sviluppo di nuove metodologie basate su tecniche spettroscopiche in combinazione con analisi multivariata per l’ottimizzazione dei processi di produzione di biofarmaceutici.
Uno degli approcci descritti unisce la forza di varie tecniche spettroscopiche quali dicroismo circolare (CD), Infrarossi (IR), Raman, Fluorescenza e UV-Vis allo scopo di fornire una migliore ed esauriente descrizione di una molecola, il cosiddetto “fingerprint”. Questo, in combinazione con la PCA (Principal Component Analysis) può essere utilizzato per stabilire la qualità, uguaglianza e eventuali differenze tra prodotti e allo stesso tempo fornire un mezzo per monitorare i processi di sviluppo e fornire informazioni rilevanti su possibili cambiamenti della molecola. Inoltre, può mettere in evidenza relazioni tra differenti proprietà (per esempio quella tra struttura e aggregazione) e una migliore comprensione sulla natura della molecola.
Marco Barba Riassunto
La molecola usata in questo studio è una proteina omodimerica di fusione con Fc. In particolare, per questa prima parte del progetto, incentrata sull’analisi di dati multi-spettroscopici attraverso PCA, sono stati utilizzati 10 batches di “drug substance” (DS) prodotti con il corrente processo di produzione chiamato “process C”. Questo materiale ha una concentrazione non inferiore di 160 mg/ml. Tra questi campioni, ci sono delle differenze in termini di idrolizzato usato come nutrimento durante il processo di fermentazione. Oltre a questi campioni, sono stati analizzati altri 3 campioni provenienti dal nuovo “process D”. Allo scopo di generare una più vasta varietà di campioni a livello di deterioramento, i campioni originali sono stati diluiti in acqua e conservati a temperatura ambiente per diverse settimane. Le conseguenze principali di questo trattamento sono il cambiamento delle concentrazioni di additivi/buffer e il conseguente cambio di pH, la formazione di aggregati e la decomposizione chimica e strutturale della molecola.
E’ stato generato un esauriente set di spettri a partire da undici diversi lotti di proteina, utilizzando una grande varietà di tecniche, coprendo l’intero “range” dal lontano ultravioletto all’infrarosso e coinvolgendo fenomeni quali assorbimento, fluorescenza, Raman e Rayleigh scattering e dicroismo circolare. Sono stati analizzati sia i campioni originali sia quelli diluiti, ed ogni tecnica utilizzata ha dato origine a risultati utili per l’identificazione di eventuale variazione tra i campioni in analisi.
Ogni set di spettri è stato analizzati attraverso analisi multivariata, soprattutto PCA, allo scopo di evidenziare similarità e differenze tra i campioni. Questo tipo di analisi ha evidenziato una apparente connessione tra gli spettri e la storia del campione in termini di data di produzione ed idrolizzato usato. In particolare, sono state evidenziate una serie di bande di assorbimento inaspettate nella regione del visibile, insieme a probabili molecole fluorescenti potenzialmente correlate a questi fenomeni di assorbimento. Queste ultime potrebbero derivare da contaminanti, modificazioni post-traduzionali (PTM) o trasformazioni post-PTM dipendenti dalle condizioni di produzione.
Un ulteriore obiettivo della tesi è quello di dimostrare la possibilità di ottenere dati quantitativi su prodotti di degradazione di una proteina terapeutica utilizzando spettroscopia di dicroismo circolare e infrarossi in combinazione con analisi multivariata, in particolare la Partial Least Squares (PLS) regression e la O-PLS (orthogonal-PLS), un’estensione della classica PLS. Questo è approccio nuovo in quanto le applicazioni classiche del CD e IR sono la determinazione del contenuto di strutture secondarie di una proteina. Nondimeno, il presente approccio è, secondo la nostra conoscenza, il primo che cerca di sfruttare la PLS allo scopo di correlare la spettroscopia CD e IR con dati quantitativi di comuni forme di degradazione di proteine.
Allo scopo di generare una matrice di calibrazione idonea, sono stati preparati una serie di campioni contenenti quantità predefinite di aggregati, ossidati e Fc libero. Per assicurare la non correlazione di ciascuna forma di degradazione all’interno della matrice di calibrazione, queste concentrazioni sono state scelte seguendo quanto descritto da Brereton (2000). Tutti i campioni generati sono stati quindi analizzati separatamente per ognuna delle tre forme di degradazione utilizzando le rispettive e specifiche analisi cromatografiche, allo scopo di determinare in maniera accurata i livelli di tutte e tre le forme di degradazione. Inoltre, tutti i campioni sono stati analizzati attraverso spettroscopia CD e IR. Sia i dati spettroscopici sia i dati cromatografici rappresentano le basi per generare i vari modelli PLS/O-PLS, basati sia su dati CD e IR singolarmente, sia su dati CD e IR combinati insieme.
Questo approccio ha dimostrato la capacità di estrarre dati quantitativi su alcune forme di degradazione proteiche per una proteina di fusione con Fc. Sebbene entrambi gli spettri CD e IR contengano informazioni rilevanti, si è dimostrato che i modelli O-PLS basati su dati CD hanno dato una accuratezza maggiore rispetto a quella ottenuta attraverso i modelli O-PLS basati su dati IR nel predire i livelli di tutte e tre le forme di degradazione. Inoltre, si è dimostrato come l’accuratezza di predizione raggiunta coni modelli O-PLS è maggiore di quella ottenuta con i rispettivi modelli PLS.
Nell’ultima parte della tesi ci si è soffermati sull’utilizzo del “protein design” nelle biotecnologie. In questo ambito, l’obiettivo della tesi è quello di studiare la stabilità dello scheletro peptidico del contrifano-Vn, un piccolo peptide isolato dal veleno della lumaca di mare Conus ventricosus formato da solo nove aminoacidi e caratterizzato dalla presenze di un singolo ponte disolfuro, dopo la sostituzione di 4 su 9 residui aminoacidici della sua sequenza.
I contrifani sono piccoli peptidi bio-attivi isolati dal veleno di piccole lumache di mare del genere Conus, caratterizzati dalla piccola lunghezza della catena peptidica e dall’alto grado di modificazioni post-traduzionali insolite. La ciclizzazione della catena peptidica attraverso il singolo ponte disolfuro, la presenza di due residui conservati di Prolina (Pro) e l’epimerizzazione di residui di Triptofano (Trp)/Leucina (Leu) conferiscono una struttura ben definita e stabile in soluzione, conservata in tutti i membri della famiglia. È stato testato il potenziale dei contrifani come struttura per il design di macromolecole attive dal punto di vista redox attraverso l’ingegnerizzazione di un sito di legame per il rame su due varianti del peptide naturale contrifano-Vn, chiamate Cuprifano e Arg-Cuprifano, inserendo quattro residui di Istidina (His). Il sito di legame è stato modellato attraverso modelling computazionale e le due varianti peptidiche sintetizzate e caratterizzate attraverso spettroscopia UV-Vis, fluorescenza, EPR (Electron Paramagnetic Resonance) e NMR (Nuclear Magnetic Resonance).
I nuovi peptidi Cuprifano e Arg-Cuprifano legano ioni Cu2+ con stechiometria 1.1 e una K
d = 1.3(± 0.2) × 10-7
M e 1.0(± 0.4) × 10-7 M, rispettivamente. Altri metalli divalenti (Zn2+ e Mg2+ ) vengono legati con una affinità
molto minore. Inoltre, i nuovi peptidi catalizzano la dismutazione di anioni superossido con un attività comparabile con quella altre molecole non peptidiche che mimano l’azione della superossido-dismutasi.
Quindi, sfruttando la stabilità dello scheletro peptidico del contrifano-Vn, la sua capacità di tollerare sostituzioni aminoacidiche che non influiscono sulla sua stabilità e struttura, questo lavoro ha dimostrato la possibilità di usare lo scheletro peptidico dei conopeptidi come base per l’ingegnerizzazione di nuovi biocatalizzatori e ingegnerizzare nuove e stabili macromolecole attive dal punto di vista redox
Marco Barba Introduction
1 INTRODUCTION
The manufacture of biological products is a complex process that constantly evolves throughout the development of a product (Bierau et al., 2007). It consists of a series of unit operations, each intended to modulate certain properties of the materials being processed. To ensure acceptable and reproducible modulation, consideration should be given to the quality attributes of incoming materials and their process-ability for each unit operation. During the last 3 decades, significant progress has been made in developing analytical methods for chemical attributes (e.g., identity and purity). However, certain physical and mechanical attributes of pharmaceutical ingredients are not necessary well understood. Consequently, the inherent, undetected variability of raw materials may be manifested in the final product (Food and Drug Administration, 2004).
Moreover, a number of constraints, such as increased yields, scale-up or increased purity may require the re-design or optimization of a given process. Heterogeneity in a biopharmaceutical product, at the beginning of its shelf life, arises from inherent variation within the production process, resulting in the presence of various forms of post-translational modifications or degradation products. Clearly, the foremost aim of designing or optimizing a production process is obtaining maximum purity of the product, i.e. minimization of its degradation forms. Nevertheless, especially for products on the market or used in clinical trials, product consistency, i.e. a consistent pattern of critical quality parameters, is equally important in order to ensure that any change in a manufacturing process does not adversely affect the safety or efficacy of a product (Bierau et al., 2007).
Process development accounts for a significant fraction of the cost (Harms et al., 2002) of bringing a drug to the market and there is a strong economic incentive for improved monitoring tools. In theory, early process development stages have the goal of understanding and optimizing the process by measuring as many parameters as possible. Later on in production, only critical parameters may be measured to enable proper control of the process and to ensure high quality and yield; however, in practice, the inadequacy of suitable sensors and tools for online monitoring has not allowed this ideal to be widely implemented (Harms et al., 2002).
Thus, with the aim to speed up development time, there is a clear need for establishing rapid methods that shorten the turnaround time for analyzing in-process samples and simultaneously maximize the information content obtained (Bierau et al., 2007) Today significant opportunities exist for improving pharmaceutical development, process analysis and process control. Unfortunately, the pharmaceutical industry generally has been hesitant to introduce innovative systems into the manufacturing sector for a number of reasons. One reason is regulatory uncertainty, which may arise from the perception that the regulatory system is rigid and unfavourable to the introduction of innovative systems. On the other hand, pharmaceuticals continue to have a prominent role in health care, therefore pharmaceutical manufacturing will need to employ innovation, and scientific knowledge (Food and Drug Administration, 2004).
1.1 PAT (PROCESS ANALYTICAL TECHNOLOGY)
In August 2002, the Food and Drug Administration (FDA) launched a new initiative entitled “Pharmaceutical CGMPs for the 21st Century: A risk based approach. With this initiative, manufacturers are encouraged to use the latest scientific advances in pharmaceutical manufacturing and technology.
Pharmaceutical manufacturing continues to evolve with increased emphasis on science and engineering principles. Effective use of the most current pharmaceutical science and engineering principles and knowledge can improve the efficiency of both manufacturing and regulatory processes. This FDA initiative is designed to do that by using an integrated system approach to regulate pharmaceutical quality. The approach is based on science principles for assessing and mitigating the risks related to poor product and process quality. The desired state of pharmaceutical manufacturing and regulation may be characterized as follows:
• Product quality and performance are ensured through the design of effective and efficient manufacturing processes
• Product and process specifications are based on the understanding of how process factors affect product performance
• Continuous real time quality assurance
Process Analytical Technology (PAT) is defined by the FDA as a “System for designing, analyzing and controlling manufacturing through timely measurements of critical quality and performance attributes of raw and in-process materials and processes, with the goal of ensuring final product quality” (Food and Drug Administration, 2004).
It is important to note that the term analytical in PAT includes chemical, physical, microbiological, mathematical and risk analysis conducted in an integrated manner.
The goal of implementing PAT is defined therein as enhancing the understanding and the control of a production process, with the following approach: quality cannot be tested into products; it should be built-in or should be by design. (Food and Drug Administration, 2004).
Quality is built into pharmaceutical products through a complete understanding of the intended therapeutic objectives and the pharmacological, toxicological, pharmacokinetic, chemical, physical and biopharmaceutic characteristic of a drug, and by design of manufacturing processes using principles of engineering, material science and quality assurance to ensure reproducible product quality and performance throughout a product’s shelf life.
Using this approach of building quality into products, PAT highlights the necessity for process understanding and opportunities for improving manufacturing efficiency through innovation. A process is well understood when: i) all critical sources of variability are identified and explained; ii) variability is managed by the process; iii) product quality attributes can be accurately and reliably predicted over the design space established for materials used, process parameters, manufacturing and other conditions.
A desired goal of the PAT framework is to design and develop well-understood processes that will consistently ensure a predefined quality at the end of the manufacturing processes. (Food and Drug Administration, 2004).
1.2 PAT TOOLS
There are many tools available that enable process understanding for scientific, pharmaceutical development. These tools, can provide effective and efficient means for acquiring information to facilitate process understanding and continuous improvement. In the PAT framework, these tools can be categorized according to the following:
• Multivariate tools for design, data acquisition and analysis • Process analyzers
• Process control tools
An appropriate combination of some, or all, of these tools may be applicable to an entire manufacturing process (Food and Drug Administration, 2004).
Marco Barba Introduction 1.2.1 Multivariate tools for data analysis
From a physical, chemical and biological perspective, pharmaceutical products and processes are complex multi-factorial systems. There are many development strategies that can be used to identify optimal processes, and the knowledge acquired in these development programs is the basis for process design. A knowledge base can be very useful when it arises from scientific understanding of the multi-factorial relationships, e.g. between process and quality attributes. This benefit can be achieved by using multivariate approaches in conjunction with knowledge management systems.
Methodological experiments based on multivariate statistical principles provide useful means for the identification and study of the effect and interaction of product and process variables. Traditional one-factor-at-time experiments cannot address these kinds of interactions. Multivariate statistical tools enable the identification and evaluation of product and processes variables that may be critical to product quality and performance (Food and Drug Administration, 2004).
1.2.2 Process analyzers
Process analysis has advanced significantly during the last several decades, due to an increasing appreciation for the value of collecting processing data. Available tools have evolved from those that predominantly take univariate process measurements, such as pH, temperature and pressure, to those that measure biological, chemical and physical attributes in a non-destructive way (Food and Drug Administration, 2004).
Indeed some process analyzers provide non-destructive measurements that contain information related to biological, physical and chemical attributes of the materials. These measurements can be:
• at-line: Measurements where the sample is removed isolated and analyzed in proximity to the process • on-line: Measurements where the sample is diverted from the manufacturing process
• in-line: Measurements where the sample is not removed from the process
Measurements collected from these process analyzers don’t need to be absolute values of the attributes of interest. The capability to measure relative differences in material before and during processing can provide useful information in process development and control. However, multivariate analyses are often necessary to get critical process knowledge for real time control and quality assurance (Food and Drug Administration, 2004).
1.2.3 Process control tools
It is important to emphasize that a strong link between product design and process development is essential to allow the effective control of all critical quality attributes. Process monitoring and control activities are intended to monitor the state of a process and manipulate it to maintain a desired state (Food and Drug Administration, 2004).
Design and optimization of manufacturing process within the PAT framework can include:
• Identification and measure of critical material and process attributes related to product quality
• Design a process measurements system to allow real time or near real time (on-, in or at-line) monitoring of all critical parameters
• Design process controls that provide adjustments to ensure control of all critical attributes
• Develop mathematical relationships between product quality attributes and measurements of critical process attributes
Thus, within the PAT framework, a process end point is not a fixed time, but rather it’s the achievement of the desired attribute. Obviously, this does not mean that process time is not considered (Food and Drug Administration, 2004).
1.3 PAT PRINCIPLES
1.3.1 Real time release
Real time release is the ability to evaluate and ensure the acceptable quality of in-process and/or final product based on process data. The PAT component of real time release includes a combination of assessed material attributes and process controls. Material attributes can be determined using process analytical methods. The combined process measurements and other test data collected during the manufacturing process can serve as the basis for real time release of the final product and to demonstrate that each batch conforms to established regulatory quality attributes.
1.3.2 Risk-based approach
Within an established quality system and for a particular process, one would expect an inverse relationship between the level of process understanding and the risk of producing a poor quality product. For a well-understood process, opportunities exist to develop less restrictive regulatory approaches to manage change (Food and Drug Administration, 2004).
1.4 SPECTROSCOPIC TECHNIQUES
Thanks to the PAT initiative, spectroscopic sensors systems have gained interest for bioprocess monitoring because they allow rapid and non-destructive monitoring of product quality attributes. Improvements in spectrometers, detectors and optics have led to interesting applications related to PAT (Harms et al., 2002; Adam et al., 1999; Vaidyanathan et al., 1999; Schugerl, 2001). More specifically several authors showed that spectroscopic techniques could be used to analyze glycosylation, aggregation or oxidation (Lu et al., 1995; Petty et al., 2005).
1.4.1 Circular Dichroism spectroscopy (CD)
Circular Dichroism (CD) is being increasingly recognised as a valuable technique for examining the structure of proteins in solution. It measures the optical activity of asymmetric molecules in solution by measuring their unequal absorption of left- and right- handed circularly polarised light.
Marco Barba Introduction Plane polarised light can be viewed as being made up of 2 circularly polarised components of equal magnitude, one rotating counter-clockwise (left handed, L) and the other clockwise (right handed, R) (fig. 1).
Figure 1. Origin of CD effect
(I) the L and R circularly polarized components have the same
amplitude and when combined generate plane polarized radiation,;
(II) the components are of different magnitude and the resultant
(dashed line) is elliptically polarized
Circular Dichroism is observed when molecules absorb left and right circularly polarized light to different extent (Pelton and McLean, 2000). If, after passage through the sample, the L and R components are not absorbed or are absorbed to an equal extent, the recombination of L and R would regenerate radiation polarised in the original plane. However, if L and R are absorbed to different extents, the resulting radiation would be said to possess elliptical polarisation (Fig. 1) (Kelly et al., 2005). A CD signal will be observed only when a chromophore is chiral (optically active). A chromophore is chiral when:
• It is intrinsically chiral because of its structure, e.g. a C atom with 4 different substituents, or the disulfide bond which is chiral due to the dihedral angles of S-C-C-S chain of atoms.
• It is covalently linked to a chiral centre in the molecule
• It is placed in a asymmetric environment because of the three-dimensional structure adopted by the molecule
In proteins, the chromophores of interest include the peptide bonds, aromatic amino acids side chains, and disulphide bonds. If a number of chromophores of the same type are in close proximity, they can behave as a single absorbing unit that will give rise to characteristic spectral features. CD is measured in two spectra regions, the far-UV and near-UV region (Kelly et al., 2005).
Far-UV spectra. The far-UV (ca. 180-250 nm), also called the amide region, is dominated by contributions of
the peptide bond. CD bands in the far-UV contain information about the configuration of the peptide bonds and therefore the secondary structure of the protein. It can be used to detect changes in secondary structure (New technologies catalogue, MerckSerono).
Alpha helix, beta-sheet and random coil structures each give rise to a characteristic shape and magnitude of the CD spectrum (fig. 2).
Figure 2. Far-UV spectra associated with various types of secondary structure
Solid line; α-helix; long dashed line, anti-parallel β-sheet; dotted line, type I β-turn; cross dashed line, extended 31-helix or poly (pro) II helix; short dashed line, irregular structure
The approximate fraction of each secondary structure can thus be determined by analyzing its far-UV CD spectrum as a sum of fractional multiples of such reference spectra for each structural type. (New technologies catalogue, MerckSerono).
Near-UV spectra. In the near-UV region (250-340 nm), also called aromatic region, CD bands arise from the
absorption of aromatic amino acids. In addition, disulphide bonds give rise to minor CD bands around 250 nm. CD bands in the near-UV region are observed when aromatic amino acids are immobilized in a folded protein and thus transferred to an asymmetric environment. Each of the amino acids tends to have a characteristic wavelength profile (fig. 3).
Figure 3. The near-UV CD spectrum
Wavelength ranges corresponding to signals from Phe, Tyr and Phe side-chains are indicated
Marco Barba Introduction Tryptophan (Trp) shows a peak close to 290 nm, with fine structure between 290 and 305 nm; Tyrosine (Tyr) a peak between 275 and 282 nm, with a shoulder at longer wavelengths often obscured by bands due to Trp; Phenylalanine (Phe) shows weaker but sharper bands with fine structure between 255 and 270 nm (Kelly et al., 2005). The actual shape and magnitude of a near-UV spectrum depends on the number of each type of aromatic amino acids present, their mobility and environment (H-bonding, polar groups and polarizability) (Kelly et al., 2005).
1.4.2 Fourier- transformed infrared spectroscopy (FT-IR)
Infrared (IR) spectroscopy is one of the most common spectroscopic techniques used by organic and inorganic chemists for the determination of secondary structure of proteins in solution. It is based on the wavelength and intensity of the absorption of infrared light by a sample. Infrared light is energetic enough to excite vibrational transitions of bonds in molecules. The energy of these molecular vibrations corresponds to the IR region of the electromagnetic spectrum (New technologies catalogue, MerckSerono).
Two experimental methods are available for measuring infrared spectra. In the dispersive method, infrared light is passed through the sample, and the absorption is measured. This method has been largely supplanted by Fourier transform method. Instead of viewing each component frequency sequentially, as in a dispersive IR spectrometer, all frequencies are examined simultaneously in Fourier transform infrared (FTIR) spectroscopy. Basically with Fourier transform infrared measurements, a beam of light is split in two, with half of the light going directly to the sample, and the other half of it is diverted to a moving mirror which then directs it to the sample. The difference in phase of the two waves creates a constructive and/or destructive interference and is a measure of the sample absorption. The waves are scanned over a specific wavelength region of the spectra, and multiple scans are averaged to create the final spectrum (Hammes, 2005). Among the fundamental vibrations (also known as normal modes of vibration), those that produce a net change in the dipole moment may result in an IR activity. The major types of molecular vibrations are stretching and bending (fig. 4).
Figure 4. Major vibrational modes for a non-linear group, CH2
The carbonyl group of amide bond in proteins is particularly useful for the determination of secondary structure (Hammes, 2005). The stretching normal mode, amide I mode, of the carbonyl has been shown to have a specific frequency associated with α-helices, β-sheets and other characteristic structures. According to the spectra-structure database of infrared frequencies (Hammes, 2005) the major absorbance peaks can be assigned to specific chemical structures (Hammes, 2005). The C=O stretch vibration of peptide bonds can be identified around 1650 cm-1. It corresponds to the amide I vibrational state. The N-H bending is located at 1550 cm-1. It
corresponds to the amide II vibrational state. The N-H bending and the C-N stretching absorb IR light around 1250 cm-1 (fig. 5).
Figure 5. Infrared spectra of proteins
The vibrational spectrum of the amide bond for a protein is complex because of the many amide bonds present in multiple environments (Hammes, 2005).The amide I band is the most intense absorption band in proteins. It is primarily governed by the stretching vibration of C=O (70-85%) and C-N groups (10-20%). Its frequency is found in the range between 1600 and 1700 cm-1. The exact band positions are determined by the backbone
conformation and hydrogen-bonding pattern (New technologies catalogue, MerckSerono).
For structure determination in proteins, analysis of amide I band is the method of choice, because it is the strongest band, and it almost exclusively arise from C=O stretching and therefore directly correlated to the backbone conformation (New technologies catalogue, MerckSerono).
1.4.3 Raman spectroscopy
IR and Raman spectroscopy are the main methods to measure the vibrational spectrum of proteins. When a molecular vibration is accompanied by a change of dipole moment, the mode is IR active, and when the vibration is accompanied by a change of polarizability, the mode is Raman active (Kitagawa et al., 2002). In addition to absorbing light, samples also scatter light. The amount of scattered light is at maximum at 90° from the direction of the incident light. Most of the scattered light is at the same frequency of the incident light. This is called Rayleigh scattering (Hammes, 2005). At the molecular level, the electric field of the light perturbs the electron distribution, but no transitions between energy levels occur so that the molecule immediately returns to its unperturbed state. This scattering is inversely proportional to the fourth power of the wavelength so that the scattering is much greater at shorter wavelengths. Rayleigh scattering is observed at all wavelengths and the intensity of the scattered light is related to the polarizability of the molecule.
A small fraction of the molecules return to a different vibrational energy level after scattering. The vibrational energy level can be either higher or lower than the initial state. As a result of this change in energy level, some of the scattered light will be at a lower or a higher frequency than the incident light. This is called Raman scattering (Hammes, 2005) (fig. 6). 0 0.0002 0.0004 0.0006 0.0008 0.001 0.0012 0.0014 900 1100 1300 1500 1700 cm-1 Ab s N H O Amide II N H O Amide I N H O Amide III
Marco Barba Introduction
Figure 6. Origin of Rayleigh and Raman effect
The Rayleigh line is very intense, but much less intense scattering can be detected at a lower frequency than the incident light, because the incident light was used to promote the molecule to a higher vibrational energy level. These are called Stokes line. An even smaller fraction of the scattered light occurs at a higher frequency than the incident light, because energy is added to the incident light by the movement of the molecule to a lower vibrational state. These are called anti-Stokes line (Hammes, 2005) (fig. 6).
Raman spectroscopy has two principal advantages over infrared spectroscopy. First, a permanent dipole is not required. Second, a Raman spectrum can be easily obtained in aqueous solution, because the Raman scattering of water is very weak (Kitagawa et al., 2002). The primary disadvantages are that because the intensity of the Raman lines is very weak, an intense light source and high concentrations of the molecule are required (Hammes, 2005). Another important characteristic of Raman spectroscopy is the possibility of resonance enhancement. When the excitation wavelength of Raman scattering approaches an absorption maximum of an electronic transition of a molecule, some of the molecular vibrations gain strong enhancement of Raman intensity. This is called resonance Raman spectroscopy (Kitagawa et al., 2002).
Raman and infrared spectroscopy should be regarded as complementary. Since infrared spectroscopy is dependent on the permanent dipole moment and Raman spectroscopy on the polarizability, usually a vibrational transition is observed either in the infrared or in Raman scattering, but not in both (Hammes, 2005).
The frequencies of the vibrational motions of the amide I, II and III modes reflect the structure of the main polypeptide mainchain. Typical frequencies for α-helix, β-sheet and non-regular structures are shown in table 1 (Nielsen)
Table 1. Characteristic amide bands in Raman spectra of proteins.
The side-chain vibrational modes of aromatic amino acids have been established by Harada and Takeuchi (Kitagawa et al., 2002). The Raman bands around 1360 and 1340 cm-1 are called the Trp doublet and their
relative intensity reflect the hydrophobic/hydrophilic environment of Trp residues, being larger for more hydrophobic environments (Kitagawa et al., 2002). The Raman bands around 860 and 833 cm-1 are called the
Secondary structure Amide I (cm-1) Amide III (cm-1) α-helix 1645-1658 1260-1305 β-sheet 1665-1680 1230-1245 β-turn 1663-1678 1258-1300 Randm coil 1660-1665 1242-1255
Tyr doublet, the relative intensity of which is sensitive to the microenvironment of Tyr residues (Kitagawa et al., 2002).
1.4.4 UV-Vis absorption spectroscopy
The most common type of spectroscopy involves light in the visible and ultraviolet (UV) region of the spectrum interacting with molecules. This interaction causes electrons to shift between their allowed energy levels (Hammes, 2005). The most important aspect of the quantum mechanical calculation is the determination of how much light is absorbed by the sample. This is embodied in the Lambert-Beer law, which gives the relationship between the light intensity entering the solution, I0, and the light intensity leaving the solution, I:
Log(I0/I) = A = εcl (1)
Here A is defined as the absorbance, ε is the molar absorptivity or extinction coefficient, c is the concentration of the absorbing sample and l is the thickness of the sample trhough which the light passes. The extinction coefficient is a different constant for each wavelength and it is characteristic of the molecule (Hammes, 2005). A very important property of the light absorbing solutions is that if multiple absorbing species are present, the total absorbance is simply the sum of the absorbance of the individual species (Hammes, 2005). UV spectroscopy can be used to confirm the identity and to assess the purity of recombinant proteins and their peptide fragments. The near-UV (250 to 350 nm) absorbance spectrum of a protein is almost entirely a function of its aromatic amino acids (tryptophan, tyrosine and phenylalanine). Because each protein has a unique amino acid sequence, the particular aromatic amino acids content of each protein results in a unique spectrum in the near-UV region (Coligan et al., 1995).
The spectra of the aromatic amino acids phenylalanine, tyrosine and tryptophan are shown in figure 7. It can be seen that electronic transitions in tyrosine and tryptophan are responsible for the absorption peak at around 280 nm. It can also be seen that all three amino acids absorb strongly at shorter wavelengths. Measurements of spectra of proteins without aromatic amino acids show strong absorbance at around 192 nm, due to the electronic transitions associated with peptide bonds (Hammes, 2005).
Figure 7. Spectral characteristics of chromophores in proteins
Marco Barba Introduction The spectra of aromatic amino acids and peptide bonds are strongly influenced by their local environments. Thus, the spectra of peptide bonds and aromatic residues buried inside are somewhat different from those on the exterior of the protein. This environmental sensitivity of protein spectra can be used to obtain information about protein structure (Hammes, 2005).
1.4.5 Fluorescence spectroscopy
Fluorescence is a very common phenomenon in biology. Fluorescence is the emission of light associated with electrons moving from an excited state to the ground state. It is a more useful tool for studying biological process than absorbance and can be considerably more sensitive than absorbance so that much lower concentrations can be detected (Hammes, 2005). This means, however, that small traces of fluorescent impurities in the solvent are readily detected and can lead to misinterpretation of the spectra (Coligan et al., 1995). In order to understand fluorescence, an energy diagram such as that shown in figure 8 is useful.
Figure 8. Schematic energy level diagram for absorbance and fluorescence
In this diagram are shown two electronic energy levels, each with their vibrational energy levels, due to the vibrations of atoms within the molecule. Electrons are in their ground electronic energy state at room temperature, and the molecule it is in its lowest vibrational level. They can be excited by light to the next electronic energy level, but can be in many different vibrational levels in the excited state. After this excitation, the molecule will return to the lowest vibrational level of the second electronic energy level very rapidly, through a radiationless transition (production of heat). Electrons in the second energy level can then decay to the electronic ground state. The light emission produced is is named fluorescence (Hammes, 2005).
The emitted light is always at a longer wavelength than the absorbed light, since the energy change associated with emission can never be greater than the energy change associated with absorption and the number of photons emitted can never exceed the number of photons absorbed (Hammes, 2005). The efficiency of fluorescence is characterized by the quantum yield, Q, that is the fraction of photons absorbed that are eventually emitted:
Q= n photons emitted / n photons absorbed (2)
The measurement of fluorescence is more complex than the measurement of absorption since the sample must be excited at a specific wavelength and the fluorescence observed at a different wavelength. The emission spectrum is obtained by keeping the excitation wavelength constant and observing the emission over a range of
wavelengths. The emission spectrum of figure 9 was determined by exciting tryptophan with light at the absorption maximum of 275 nm (Hammes, 2005).
Figure 9. Fluorescence spectrum of Trp
The solid curve is the fluorescence excitation spectrum and the dashed curve is the fluorescence emission spectrum. The fluorescence intensity is normalized to one in order to display the spectral shape of the excitation and emission curves.
.
1.5 CHEMOMETRICS ANALYSIS
For a number of good reasons, spectral measurement is often the method of choice in qualitative and quantitative analysis of chemical mixtures. It is relatively easy to generate a good deal of data in a short time by proper use of spectroscopy. Getting useful results from a set of spectral data is not always straightforward, however. Determining the amounts of the components of a mixture can often be problematic without a prior separation step because of the overlap of spectral responses. Identifying the components of a mixture can also be challenging because of the similarity of many spectral responses. Often, the solution to these problems has been to increase spectral resolution or, as in the case of the quantitative analysis, to enhance the spectral resolution by means of a prior separation step. Many of these spectroscopic fixes to the problem of extracting results from data work less well than one might expect, given the apparent "information" in a spectral scan. For this reason, spectroscopists have increasingly turned to chemometrics for help in dealing with spectral data.
Svante Wold and Bruce R. Kowalski introduced the term chemometrics in the early 1970s. Chemometrics is rapidly advancing in industry. In the year 2003, the regulative authorities in USA—the Food and Drug Administration—indirectly recommends chemometrics contained as a vital component in process analytical technology (PAT) in guidance for the pharmaceutical industry (Munck, 2007). There is no doubt that an investment in process monitoring by new multivariate instruments combined with training of staff in chemometric data analysis has an extremely short payback time in almost all kinds of industries (Munck, 2007). A reasonable definition of chemometrics remains as: “how do we get chemical relevant information out of measured chemical data, how do we represent and display this information, and how do we get such information into data” (Chau et al., 2004). There are two main reasons why chemometrics developed so rapidly at that time: (1) large piles of data not available before could be acquired from advanced chemical and (2) advancements in microelectronics technology within that period. The abilities of chemists in signal processing and data interpretation were enhanced with the increasing computer power (Chau et al., Wiley, 2004).
Masses of data are produced by measuring many variables on ensembles of chemical samples, or by frequently recording many signals from an industrial process in order to track its behaviour (Eriksson et al., 2006). The data explosion necessitates the use of appropriate tools for extracting meaningful information from the large amount
Marco Barba Introduction of raw data. It is no longer efficient to analyze data by simply looking at them or by plotting them in simple graphs. More sophisticated computer-based methods are needed (Eriksson et al., 2006).
Two multivariate projection methods are very useful: • Principal Component Analysis (PCA)
• Partial least squares projection to latent structures (PLS)
Multivariate data analysis (MVDA) provides a toolbox of versatile data analytical tools. There are three basic problem types to which these multivariate tools can be applied:
• Overview of data table
• Classification and/or discrimination among groups of observations • Regression modelling between two blocks of data (X and Y)
1.5.1 Principal component analysis (PCA)
In the early stage of a project, when little is known about a problem, a simple overview of the information in a data table is often required. Such overview can be obtained with principal component analysis (PCA) (Eriksson et al., 2006). PCA is a way of identifying patterns in data, and expressing the data in such a way as to highlight their similarities and differences. Since patterns in data can be hard to find in data of high dimension, where the luxury of graphical representation is not available, PCA is a powerful tool for analyzing data (Smith, 2002). PCA produces a summary showing how the observations are related and if there are any deviating observations or groups of observation in the data. In addition, PCA also provides an understanding of the relationships among the variables: which variables contribute similar information to the PCA model and which provide unique information about the observations. PCA describes the correlation structure in the X block of data (Eriksson et al., 2006). Often an initial PCA of a data set reveals grouping among the observations. This may indicate the need for further PCA modelling of each subgroup (“class”) in order to understand the features of the different groups. Subsequently, it is possible to use the separate class models for classification. By “classification” it is meant the use of the established class models for classifying new observations (Eriksson et al., 2006).
Principal component analysis forms the basis for multivariate data analysis. As shown in figure 10, the starting point for PCA is a matrix of data with N rows (observations) and X columns (variables), here denoted by data matrix X. The observations can be analytical samples, chemical compounds, process time points of a process, batches from a batch process and so on (Eriksson et al., 2006). In order to characterize the properties of the observations, one measures variables. These variables may be of spectral origin (e.g. NIR, IR, CD, UV, NMR), chromatographic origin (e.g. HPLC, UPLC, GC) or they may be measurements from sensors in a process (e.g. pH, temperature, flows).
Figure 10. Notation used in PCA
The most important use of PCA is indeed to represent a multivariate data table as a low-dimensional plane, usually consisting of 2 to 5 dimensions. Statistically, PCA find lines and planes in the K-dimensional space that best approximate the data in the least square sense. A line or a plane that is the least squares approximation of a set of a data points makes the variance of the co-ordinates on the line or plane as large as possible (fig. 11)(Eriksson et al., 2006).
Figure 11. A geometric interpretation of PCA
Prior to PCA, data are often pre-treated, in order to transform data into a form suitable for the analysis. Variables often have substantially different numerical ranges. A variable with a large range has a large variance and a variable with small range has a small variance. Since PCA is a maximum variance projection method, a variable with a large variance is more likely to be expressed in the modelling than a low-variance variable (Eriksson et al., 2006). In order to give to all variables equal weight, the data have to be standardized. Such standardization is also known as “scaling” or “weighting”.
X1
X2
X3
Variance of the scores (co-oridinates of the line is maximized)
Residual variance minimized by least squares analysis
X1 X2 X3 X1 X2 X3 X1 X2 X3
Variance of the scores (co-oridinates of the line is maximized)
Residual variance minimized by least squares analysis