Università degli Studi di Torino
Doctoral School of Sciences and Innovative Technologies PhD Program in Chemical and Material Sciences XXIX Cycle
In situ and operando characterization of
zeolite-based catalysts by means of Raman spectroscopy
Matteo Signorile
Supervisor:
Dr. Francesca Carla Bonino
Università degli Studi di Torino
Doctoral School of Sciences and Innovative Technologies PhD Program in Chemical and Material Sciences XXIX cycle
In situ and operando characterization of zeolite-based catalysts by means of Raman spectroscopy
Candidate: Matteo Signorile
Supervisor: Dr. Francesca Carla Bonino Jury Members: Dr. Davide Ferri
Paul Scherrer Institute
Catalysis for Energy group
Dr. Andrea Piovano Institut Laue-Langevin Prof. Bartolomeo Civalleri University of Torino
Department of Chemistry
Head of the Doctoral School: Prof. Guido Boffetta PhD Program Coordinator: Prof. Mario Chiesa
Ai miei nonni, che mi hanno introdotto al meraviglioso mondo della scienza e della tecnica A Coco
Acknowledgments
Many people have been involved in the development of this thesis work, everyone deserving my best acknowledgments. In particular, I would like to express my unconditional gratitude to Francesca and Alessandro, who helped me to grow up as researcher day by day along my whole PhD project. A sincere thanks also to Silvia, for her precious support and suggestions.
Concerning the MTH topic, my best acknowledgments are due to Enrico Cepparrone (BSc thesis student), Nicolas Loock (MSc thesis student) and Daniel Rojo Gama (PhD student from University of Oslo), for their help with a relevant fraction of the experimental work. I also would like to mention the nice collaboration established with the Catalysis research group of University of Oslo (prof. K.P. Lillerud, prof. U. Olsbye and prof. S. Svelle) and Topsøe A/S (dr. P. Beato), within the framework of the ZeoMorph project.
With regard to the TS-1 topic, I acknowledge my colleague V. Crocellà for sharing the research project involving Evonik Industries AG and our industrial partners dr. F. Schmidt and dr. H. Morell.
Finally, I would mention the collaboration with the Theoretical Chemistry Group of Università di Torino for the helpful discussion and technical support, as well as the NOTUR consortium for granting the HPC research project NN9381K.
Table of Contents
Preface ... 2
Chapter 1. Introduction ... 3
1.1 The samples: zeolites ... 3
1.2 The approach: Raman spectroscopy ... 7
1.3 The challenge: Raman of zeolites ... 17
Chapter 2. The development of a new setup: toward in situ and operando Raman of zeolites ... 31
2.1 Raman and sample movement: state of art ... 31
2.2 Development of a new Raman setup ... 36
Chapter 3. Conversion of methanol over acid zeolites: deactivation paths of the Methanol To Hydrocarbons reaction ... 46
3.1 Experimental ... 48
3.2 PAHs as coke references for the MTH reaction ... 50
3.3 Study on the catalyst activation procedure: the case of ZSM-5 ... 56
3.4 Preliminary study of the MTH reaction: from ex situ toward operando .. 65
Chapter 4. Titanium Silicalite-1: experimental approach ... 86
4.1 Experimental ... 88
4.2 Qualification of the Ti sites ... 90
4.3 Quantification of the Ti sites ... 101
4.4 Catalytic performances: comparison with spectroscopic results ... 107
Chapter 5. Titanium Silicalite-1: computational approach ... 118
5.1 Development of a Ti-Chabazite model: a good candidate for TS-1 representation ... 119
5.2 Validation of the Ti-CHA model: adsorption of simple molecules ... 125
5.3 Modeling the TS-1 spectrocopic features through the Ti-CHA model: vibrational and electronic properties ... 134
Conclusions ... 154
Appendix A ... 156
Appendix B ... 162
Appendix C ... 168
Preface
The main goal of this doctoral project has been the application of Raman spectroscopy to the characterization of zeolites, with particular regard to their behavior in controlled atmosphere and/or under reaction conditions. Even if apparently this may be considered a trivial task (as for many other spectroscopic techniques), the Raman approach to zeolites is rather complex because of the several drawbacks affecting it (e.g. fluorescence and laser induced sample damaging).
A key point of this thesis has been to exploit/develop a set of tools able to overcome such limitations: several implementations have been reported in the literature with the same aim, however each one demonstrated some incompatibilities with the purposes of the present work. For such reason, a totally new experimental setup was designed, developed and tested.
Following the good preliminary results achieved, the novel device was then applied to the study of two relevant processes in the zeolite/catalysis field: the Methanol To Hydrocarbon (MTH, based on acid zeolites) and the Hydrogen Peroxide to Propylene Oxide (HPPO, catalyzed by Titanium Silicalite-1, TS-1). The former represented an optimal benchmark for the new setup, since the reaction involves labile organic reactants and products, thus threatened by the photon induced damaging. The latter, instead, thanks to the peculiar features of the TS-1, can be regarded as a more fundamental research work, also involving a multiple technique approach and quantum mechanical simulation (the latter representing a significant fraction of this thesis work).
Chapter 1
Introduction
1.1 The samples: zeolites
Zeolites are a rich class of materials, both from natural and synthetic origin. According to the International Union of Pure and Applied Chemistry (IUPAC), «Zeolites and zeolite-like materials comprise a broad range of porous crystalline solids. The structures of zeolite-type materials are based essentially on tetrahedral networks which encompass channels and cavities».1 The
number of known zeolite structures (i.e. frameworks) is continuously growing up: being 176 framework types reported in 2007,2 other 55 new structures
have been validated since nowadays, i.e. reaching 231 different ones.3
Considering all the possible compositional variations (the tetrahedra commonly host Si or Al, but other “heteroatoms” such as B, P, Ge, Ga, As and transition metals can be included as well), it is simple to understand that the label “zeolite” describes thousands of different materials, each one with its specific properties. Another source of variability is represented by the extraframework counterions, which are eventually hosted in the porous system in order to balance the electrical charge of the framework. Furthermore, zeolites effectively behave as adsorbent materials, being able to host a large amount of atoms/molecules (in the most common case water) in the empty spaces of channels and cavities: these species can be usually eliminated under proper conditions (e.g. through a thermal treatment). Exactly observing the development of steam upon the rapid heating of a Stilbite mineral, the Swedish mineralogist Axel Fredrik Cronstedt coined in the 18th century the
λιθος (lithos, "stone").4 The depletion of counterions is instead impossible, because of their role in keeping the material charge nil.
Coming back to the composition, the tetrahedral units are in the simplest case represented by orthosilicate anions (SiO44-) connected through
the corners (i.e. giving rise to a tectosilicate): the resulting structure, terminated on external surfaces by silanol groups, does not require an extraframework charge balance since it is neutral by itself. The existence of natural all-silica zeolites has not been reported, being all of synthetic origin.5–8
Conversely the substitution of the SiO44- by AlO45- is very likely also in natural
samples, such as zeolites are often (and sometimes improperly) classified as aluminosilicates.1 Due to the excess of negative charge of the framework
accomplishing such substitution, the presence of extraframework cations is now compulsory in order to keep the overall charge neutrality. These are extremely important in determining the zeolite chemical behavior, since they represent the active sites of the material: as an example, since counterions can be easily substituted by other ones, zeolites are widely exploited as ion exchange materials.9–11 Another application with great relevance nowadays,
involving zeolties with alkali and alkali-earth counterions, is the CO2 capture
and separation from other gases: carbon dioxide can interact with the cations as well as the framework oxygen atoms, thereby providing a set of preferential adsorption sites.12–15 It is also possible to perform transition metal ions
exchanges, thus inducing redox properties to the material: giving some examples, Cu- and Fe-zeolites are applied as catalysts for the Selective Catalytic Reduction (SCR) of NOx in post-combustion exhausts,16–18 whereas
Ni-zeolites are active toward the olefins oligomerization reaction.19,20 Probably
the type of counterion which found the largest industrial application is the proton: the H+ shows a strong Brønsted acidity, comparable to mineral acids
one,21 with the enormous advantage to handle a solid rather than a liquid.
selectivity: only the molecules able to diffuse through the channel system can reach the active sites (and thus react) and only the products (as well as the reaction transition states) which are allowed by the framework steric constrains can be formed.22,23 The marked acid character and the intrinsic
selectivity of zeolites brought them to dominate the catalysis market in petroleum refining and petrolchemistry.24,25 Another possible way to balance
the charge, other than counterions, is available: if phosphates PO43- are
replacing the SiO44-, each one is able to counterbalance a AlO45- (i.e. without
the needing of an extraframework cation). This synthetic opportunity brought to produce materials with various Si:Al:P compositions, giving rise to the so called SAPO and ALPO zeotypes families.26,27
The substitutions of Si by heterovalent atoms are not the only allowed by the zeolites chemistry. An example is the isovalent substitution of silicon by germanium, possible in a wide range of compositions and sometime giving rise to new structures, unreported for siliceous-only zeolites.28–32 Probably, the
most relevant case of isovalent substitution (also regarding the industrial application) is represented by the insertion of Ti: being obtained for the first time in 1983 by the researcher from ENIChem SPA on Silicalite-1 (i.e. obtaining the famous TS-1),33 it has been successfully to many other
framework topologies.34–37 TS-1 represented for academia an exceptional
laboratory, where several characterization techniques could be exploited and developed: a brief description of these successes will be given in Chapter 4. However the interest toward TS-1 was not relegated to the fundamental research only, as a number of industrial processes exploiting it as catalysts were rapidly developed few years after its discovery.38,39 The main application
field of TS-1 is represented by partial oxidation reaction: its catalytic role is to activate the oxidizing medium (i.e. hydrogen peroxide in aqueous solution) by forming Ti-peroxo species,40–42 thus making it capable to oxidize the desired
most relevant ones are the epoxidation of olefins (and in particular of propene to propylene oxide)43 and the ammoxidation of cyclohexanone to
cyclohexanone oxime (a precursor for nylon 6 production).44 With respect to
the previous industrial processes the TS-1 based ones represented a big step forward, being safer and showing higher selectivities toward the desired products.39
Even if not exhaustively, the previous paragraphs aimed to introduce the world of zeolites, underlining its variety and complexity, as well as the importance of these materials in several industrial processes (but also in the everyday life). Since the spreading of structures, properties, types of active sites and applications typical of zeolites, their complete characterization requires a multitechnique approach. Each specific measurement can in fact put in evidence a different facet of their complex nature: giving few examples, diffraction techniques allow to obtain the structure of these materials, volumetry is helpful in the porosity characterization, microscopies in the assessment of morphology, etc.45 A peculiar class of techniques is represented
by spectroscopies: the variety of the information accessible is in fact really wide, ranging from structural to electronic properties, passing through active sites features and reactivity.46–49 Among them, a rather peculiar case is
represented by Raman spectroscopy: beside its potentialities and advantages toward zeolites characterization, its application has been limited by several drawbacks. A detailed picture of the Raman characterization of zeolites will be given in the following. However, before entering this specific topic, in the next section the fundamentals of Raman spectroscopy (useful for the clear understanding of the related issues) are introduced.
1.2 The approach: Raman spectroscopy
Raman spectroscopy is a vibrational technique originating from the inelastic scattering of electromagnetic radiation. Its name derives from the one of discoverer, Sir Chandrasekhara Venkata Raman, that reported together with is coworker Krishnan as «[…] in every case in which light is scattered by the molecules in dust-free liquids or gases, the diffuse radiation of the ordinary kind, having the same wave-length as the incident beam, is accompanied by a modified scattered radiation of degraded frequency».50 Even if Raman was the
first scientist to experimentally observe the phenomenon, the inelastic diffusion of light was theoretically predicted by Smekal five years before.51 Few
months after Raman’s report, an independent experimental confirmation came from Landsberg and Mandelstam, who verified the same effect on solid samples.52 Following its discovery, Sir Raman was awarded in 1930 with the
Nobel Prize for Physics «for his work on the scattering of light and for the discovery of the effect named after him».
As briefly introduced, the inelastic scattering of an electromagnetic radiation is the physical phenomenon determining the occurrence of the Raman effect: the general definition of scattering states that a scattering process occurs when a wave (or a particle) is randomly deflected by its original trajectory consequently to the interaction with another wave/particle (defined as scatterer or scattering center). Such definition is very broad and, still, the intimate mechanism of the phenomenon has not been clarified. In the following, the key steps of the theory of Raman scattering will be delineated, being these adapted from parent literature.53,54 Three types of scattering
phenomena are observed in a Raman experiment: when a photon of energy ℏ!! (being !! its angular frequency and ℏ the reduced Plank constant) interacts with a given system sitting in an energy level !!, the photon is annihilated and the system is promoted to a virtual excited state. The system readily decays from this virtual state to a final state !! and a new photon of
energy ℏ!! is created. The energy of this photons determines the type of scattering occurring: i) if ℏ!! = ℏ!! (thus !! = !!) the photon belongs an elastic scattering; ii) if ℏ!! < ℏ!! (thus !! > !!) the scattering is inelastic and it causes the production of a lower frequency photon; iii) if ℏ!! > ℏ!! (thus !! < !!) the scattering is still inelastic but the photon is now re-emitted with higher frequency. The difference in energy !! − !! observed between the two energy level can be rewritten as reported in Equation 1.1 by exploiting the Plank’s law.
!!− !! = ℏ!! (1.1)
Taking into account the conservation of energy for the overall scattering process (Equation 1.2)
!!− !! = ℏ!!− ℏ!! (1.2)
and combining Equation 1.2 with Equation 1.1, Equations 1.3, 1.4 and 1.5 are thus obtained. ℏ!!− ℏ!! = ℏ!! (1.3) !!− !! = 0 !! = 0 ∪ !!− !! < 0 !!− !! = −!! ∪ !!!!− !− !!!= !> 0! (1.4) !! = !! !! = 0 ∪ !! < !! !! = !!− !! ∪ !! > !! !! = !!+ !! (1.5)
Equation 1.5 describes (from left to right) the Rayleigh, Stokes and anti-Stokes scattering processes. This result can be schematized as in Figure 1.1.
Figure 1.1 Schematic representations of the three possible scattering phenomena occurring in
a Raman experiment.
From Equation 1.5, the analytical information provided by Raman spectroscopy can be understood: !! is the frequency of the excitation photon, which is known from the experimental setup adopted; !! is the observable, the outcoming light which is measured after the interaction with the material; and !!, which can be derived from the previous when inelastic scattering occurs, represents (as defined in Equation 1.1) the difference among two energy levels, i.e. a material property. To fully get the meaning of !! it is
determinant to consider its order of magnitude: since this typically falls in the mid/far infrared range of frequencies, it can be ascribed to a vibrational (or rotational) mode of the material.
Another really important point is the intensity of the Raman signal, which has not been yet described. In the simplest case, when the excitation wavelength !! is really different from the ones of the electronic transitions of the material, a classical approach is sufficient to properly describe the origin of Raman intensity. The key point is the establishment of a induced dipole moment ! when the electric field ! of an electromagnetic wave with frequency
!! interacts with the system because of the polarization of the latter. The polarization extent is determined by the polarizability tensor ! of the material. It is important to recall that an oscillating dipole can act as a photon emitter and the intensity of the emitted radiation will be proportional to the square modulus of the dipole moment and to the fourth power of its oscillation frequency, i.e. ! ∝ !! ! !. The dipole moment can be obtained from the
product of the polarizability tensor and the electric field (Equation 1.6).
! = ! ∙ ! (1.6)
If the scatterer is isotropic, the polarizability tensor is reduced to a scalar !: in the following this simplified approach will be followed. The polarizability is expected to vary when the molecular structure changes upon vibration: thereby, considering a specific vibrational mode ! of frequency !!, ! can be expanded through a Taylor series with respect to the normal coordinate !! of the vibrational mode (Equation 1.7).
! = !!+ !"
!!! !!! + ⋯ = !!+ !!! + ⋯ (1.7) In the tensorial treatment, each tensor component is expressed in this way separately. Since the series is rapidly converging, it can be conveniently truncated to the first order. Then explicitly describing the time dependence of !! (Equation 1.8) and ! (Equation 1.9)
!! = !!!cos(!!!) (1.8)
and thus substituting in Equation 1.6, Equation 1.10 is obtained. ! = !!+ !!!!cos !!! ∙ !!cos !!!
= !!!!cos !!! + !!!!!!cos !!! cos !!! (1.10) Finally applying the prosthaphaeresis trigonometric relations, Equation 1.10 can be rewritten as:
! = !!!!cos !!! + !!!!!! cos !!− !! !
+ cos !!+ !! ! (1.11)
Equation 1.11 gives the description of three distinct sources of radiation: the first term !!!!cos !!! describes the emission of a light with the same frequency !! of the incident one, i.e. the Rayleigh scattering; the second term !!!!!!cos !!− !! ! represents the production of an electromagnetic wave with lower frequency !!− !! compared to the incident one, i.e. the Stokes scattering; the third term !!!!!!cos !!+ !! ! finally explains the anti-Stokes scattering, being the outcoming frequency !!+ !! larger than the incoming. Equation 1.11 further depicts the fundamental condition allowing Raman scattering to occur: the variation of the polarizability due to the vibrational mode of interest should be non-zero, thus ! ≠ 0.
Being appropriate for the description of “standard” Raman scattering, Equation 1.11 is not able instead to explain other effects, including the very important resonant Raman one. Resonant Raman is phenomenologically observed when the measurements are performed with an excitation wavelength falling close to one of an electronic transition of the material: as a consequence, some of the Raman signals of the sample show a notably increased intensity (sometime of orders of magnitude), whereas other vibrations are basically unaffected. In order to give an appropriate description
of this effect a quantum mechanical approach is required: since its full mathematical treatment is really complex and out of the scope of this thesis, just the key concepts will be reported and discussed. The basic for this theory is the Kramers-Heisenberg equation of 1925, originally developed to describe the cross section for the scattering of a photon by an atomic electron:55 the
same was re-derived some years later by Dirac with a fully quantum mechanical approach.56 The Kramer-Heisenberg-Dirac results were
subsequently modified by Behringer, employing the Franck-Condon principle,57
and finally by Albrecht, who further introduced the Herzberg-Teller treatment for vibronic transitions in the former theory.58 The Herzberg-Teller effect
describes the dependence of an electronic Hamiltonian ! on the normal coordinate ! of a given vibration.59 The dependence is expressed as a series
expansion of ! with respect to ! around the equilibrium position !!: the vibrational perturbation to ! allows thus the mixing of electronic states. Applying the Herzberg-Teller expansion in the derivation of polarizabilities, the Albrecht theory is derived. The latter gives a satisfactory description of the resonant Raman effect: the key concept is to keep in mind that an electronic transition is always coupled with a change in the vibrational state of the absorber. This means that an electronic transition form a ground state !! to an excited state !! is actually a vibronic transition from a ground vibronic state ! = !! !!,! to an excited vibronic state ! = !! !! . Then the Raman process further requires a decay from the ! vibronic state to the final ! = !! !!,! vibronic state owning to the electronic ground state. If !!,! = !!,! Rayleigh scattering occurs, whereas Raman scattering is observed for !!,! ≠ !!,! . The elements of the polarizability tensor !!" are defined in the Albrecht theory by a sum of terms (Equation 1.12).
The ! addend in Equation 1.12 represents the zero order term of the Herzberg-Teller series, while the ! term contains the first order dependence by !. Explicitly, the ! term is:
! =1 ℏ !! !! !! !! !! !! !!,! !! !! !!,! !!!!!,!!!!,! − !!+ !Γ!!!! !! (1.13)
Equation 1.13 is rather complex but its physical meaning can be easily understood by considering its components separately. The term external to the summation sign, !! !! !! !! !! !! , is the product of the ! and ! Cartesian components (i.e. being ! and ! = !, !, ! ) of the dipole moments for the !! → !! and !! → !! electronic transitions. Inside the summation, the numerator !!,! !! !! !!,! is the product of the Franck-Condon factors associated to the vibronic transitions ! → ! and ! → ! ; the denominator !!!!!,!!!!,! − !!+ !Γ!!!! contains the frequency of the vibronic transition !!!!!,!!!!,!, the frequency of the incident light !! and a damping factor !Γ!!!!, related to the width of the state ! (thus responsible of the Raman signal bandwidth). In order to achieve the resonance enhancement of the Raman signal from the ! term two conditions must be satisfied: i) the dipole moments for the electronic transitions must be non-zero; ii) the Franck-Condon factors must be non-zero for at least a !! . The former condition is satisfied if the electronic transition are dipole permitted; further the contribution to the term increases together with the magnitude of the dipole, thus resonance Raman is favored if the excitation falls in the contour of a intense adsorption band (e.g. due to charge transfer or ! − !∗ transitions). In
order to satisfy the latter condition, the vibrational wavefunctions !!,! and !!,! must be non-orthogonal to !! in order to obtain non-zero overlap integrals. Non-orthogonal wavefunctions are obtained in two ways: the shape
of the potential energy surface for !! and !! is different between the two electronic states (thus leading to different vibrational frequencies for the same mode) or the potential energy minimum for the !! is displaced of a certain ∆! with respect to !! one along the normal coordinate ! of the considered vibrational mode. The latter case can occur only for totally symmetric modes (i.e. just modifying bond lengths and angles which won’t bring to a change in the symmetry), then leading to a potential energy minimum displacement along the normal coordinate. The last consideration also infers that commonly the totally symmetric modes are the enhanced ones. The enhancement of the non-totally symmetric modes is possible as well and can become relevant for some specific systems (e.g. polycyclic aromatic hydrocarbons):60 this part of
the Raman information is contained in the ! term of Equation 1.12 (reported in Equation 1.14). ! = ! ℏ! !! !! !! !! !! !! !!"! !!!!!!! !!,!!!!! !!!!,! !!!!!,!!!!,!!!!!!!!!!! !! !!! + ! ℏ! !! !! !! !! !! !! !!"! !!!!!!! !!,! !! !!!!!!,! !!!!!,!!!!,!!!!!!!!!!! !! !!! (1.14)
The Herzberg-Teller vibronic coupling mechanism makes accessible a new excited state ! through the normal coordinate !!, which is involved in determining the polarizability tensor. As for the ! term, the electronic transitions involving the states !! , !! and !! must be dipole allowed to have a non-zero !. A new term ℎ!"! takes into account the vibronic coupling of
the !! and !! states through the normal coordinate !!, given by: ℎ!"! = !
It is important to underline that Equation 1.15 can be non-zero independently from the symmetry of the vibration of normal coordinate !!, thus allowing the resonant enhancement of non-totally symmetric modes as well. Concerning the vibrational integrals !!,! !! !! !! !!,! and !!,! !! !! !! !!,! these differ from zero if !!,!= !!± 1 and !! = !!,!± 1 respectively (in the harmonic approximation). It is important to underline that Herzberg-Teller coupling can occur both during the photon absorption process as well as during is re-emission: this fact justifies the splitting of the ! term in two additive contributions.
A summary of the theoretical description of resonant Raman is graphically given in Figure 1.2. In the schematic representation is shown as, in the case of the ! term, the electronic transitions can occur only vertically, thus requiring a displacement of the potential minima for the states !! and !! to allow a transition between non-orthogonal vibrational states.
Figure 1.2 Schematic representation of the vibronic transitions originating resonant Raman.
Instead, when Herzberg-Teller vibronic coupling occurs, non-orthogonal vibrational state can be involved in the transitions just by non-vertical transitions: as a consequence, also non-totally symmetric vibrational modes can be resonantly enhanced.
As final remark to this section, the intensity of the Raman scattering is considered in an absolute way: it is in fact important to realize the extent of the probability that a photon is scattered according to this mechanism rather than being involved in other type of phenomena. The most convenient way to express this quantity is a cross section, i.e. as the number of photons (usually expressed as integrated area of the full Raman spectrum) belonging inelastic scattering per scattering center, per unit solid angle. In general Raman scattering is a very low probability event: in off-resonance conditions, in fact, the measured cross sections for some representative compounds/materials fall in the 10-28 - 10-30 cm2sr-1molecule-1 range.61,62 Raman cross sections can
improve significantly by exploiting resonance conditions, thus increasing the cross section up to 5-7 orders of magnitude.63–65 However, these value are still
really small when compared with the cross section for other phenomena possibly competing with Raman: that is the unlucky case of fluorescence, which cross section values span in the 10-23 - 10-25 cm2sr-1molecule-1 range.
This means that the collection of the Raman signal is often affected by contributions from other phenomena (and particularly by fluorescence): in some specific cases the Raman spectra can be completely buried by a fluorescence profile, thus making the technique inapplicable. Such a problem is of particular relevance for zeolites: the strategies adopted toward its solution will be commented in detail in the following section.
1.3 The challenge: Raman of zeolites
In the field of zeolites, Raman is a useful and straightforward method to study the vibrational properties of the zeolitic framework: the easier way to understand this ability is to compare the Raman spectrum of a zeolite with its corresponding infrared spectrum (Figure 1.3).
Figure 1.3 Comparison of the a) FTIR (transmission mode) and b) Raman (λ = 244 nm)
spectra of a H-ZSM-5 zeolite (Sud Chemie, Si/Al = 45).
The differences in term of relative intensities are remarkable: without entering in detail with the assignment of all the spectral features (see Chapter 3 for a deeper comment), both the spectra can be divided in a high (ν > 2000 cm-1)
and a low (ν < 2000 cm-1) frequency regions. The former is interested for
zeolites by the presence of the typical stretching vibrations of OH groups (both terminal/defective silanols and Brønsted sites): in the case of FTIR spectroscopy these signals (collected in transmission mode) are intense and well defined, whereas with Raman only weak (sometime nil) features can be collected. The latter, instead, is characteristic for framework vibrational modes: concerning FTIR all the features (with the exception of the overtones
around 1600-2000 cm-1) are too intense, resulting in an out-of-scale signal
where most of the information is lost; conversely Raman shows an optimal signal intensity in this region, being all the main spectral features easily recognized. Furthermore Raman (thanks to its instrumental building) is able to reach lower frequency values, whereas special setups are required to do the same by FTIR. Thus Raman is useful in zeolites characterization since it is capable to properly give the vibrational picture of the so-called framework modes, where FTIR instead typically fails. However, as for every technique, also Raman spectroscopy shows some limitations: the first, important drawback is that the Raman effect is characterized by a very small cross section (see the previous section), thus a high brilliance of the excitation source is required in order to obtain spectra with a good S/N ratio in a reasonable time framework. Because of this reason, the sources for Raman spectrometers are typically lasers, since these are able to produce a high photon flux, coherent light beam. To further increase the number of the inelastic scattering events, the excitation laser is usually converged on the sample through lenses and even by microscopes: concentrating the photons flux on a smaller scattering volumes the intensity of the signal can be further increased. These precautions are really useful in increasing the collected Raman intensity at equal collection times, or to shorten the time lapse required to collect a spectrum of same quality. However some drawbacks are introduced as well: since the incoming radiation is really intense, the overheating induced by the high photon flux can damage some type of materials. This is true especially for organic species, which can belong a burning-like process thus converting them in carbonaceous residuals. When the excitation source owns particularly high photons energy (e.g. as in the case of UV lasers), further photochemical damage could be observed, coming to similar outcomes. The most feasible way to avoid (or at least to limit) such damages is to reduce the incident laser power: in this way more reliable data
are collected, paying the price of a lower signal-to-noise ratio i.e. longer acquisition time. Even if this procedure is the best compromise, it becomes seriously limiting for the applicability of Raman spectroscopy anytime time-resolved experiments would be performed. A possible way to exploit higher excitation powers but avoiding the sample damaging is to spread the measurement hot-spot on the larger fraction of sample possible: in other words, if the sample is continuously moved under the laser beam, each point on its surface is enlightened by the high photons flux for a brief time, possibly too short to cause a photoinduced damage. Several technical solutions have been developed along the last 40 years to exploit this concept:66–70 the
milestones of this process will be discussed in Chapter 2, together with an in-depth discussion on the device specifically developed during this doctorate.
If the laser power vs photoinduced damage issue can be addressed adopting appropriate technical solutions, fluorescence often represents an unavoidable side effect, which could make the collection of the Raman signal impossible. As commented in the previous section of this chapter, the usual cross sections for fluorescence emission are at least comparable with those of resonant Raman, whereas they can overcame off-resonance Raman ones by orders of magnitude. Practically this means that if fluorescence occurs the Raman signal is “buried” by the emission profile, even if strong resonance can be achieved. Concerning zeolites, the problem is even worse since: i) the Raman cross-section for silicates is intrinsically low; ii) the microporous structure favors adsorption processes, including ones of organic molecules expected to be the main source of fluorescence. The ways to limit the fluorescence to a reasonable extent are mainly two: the simpler approach is to drastically eliminate the sources of emission, thus by opportunely treat the sample in order to remove them. In the case of adsorbed organic species, the easier procedure is to “burn them out” through an oxidative treatment: the simplest approach is the calcination at high temperature in an oxygen rich gas
mixture (e.g. air). Such treatments show variable efficiency depending on the calcination conditions (e.g. tempterature, static atmosphere vs flow, air vs pure O2, etc.) as well as toward different materials. This means that a general
treatment scheme (i.e. effective for every zeolite) is not feasible and the right conditions for each material have to be determined by dedicated experiments. However calcination is often not sufficient to completely deplete the sources of fluorescence and also traces of these residuals can produce sufficient emission to totally lose the Raman signal. An example comparing the outcomes of different calcinations is given in Figure 1.4.
Figure 1.4 Raman spectra (λ = 442 nm) of a Na-Y zeolite obtained upon different activation
treatments: not activated (black line), calcined in pure O2 flow at 450°C (red line) and calcined in vacuum at 450°C (blue line).
Already in the case of the bare sample measured in air, even if the typical framework modes of Y zeolite are recognized at ~ 500 cm-1 and ~ 300 cm -1,71,72 a significant fluorescence profile is observed. The choice of the activation
strategy is then determining: the classical vacuum activation as frequently performed for FTIR experiments leads to a failing result, since it only causes the uncontrolled increase of fluorescence now totally overwhelming the Raman signal. The only way to obtain an improvement of the Raman spectrum is to move toward flow calcination in pure O2 stream: in such case it is possible to
high. In fact, the treatment time required to achieve this result is extremely long, since a slow temperature ramp has to be followed to guarantee a correct dehydration of the sample (thus avoiding undesired dealumination, e.g. see Chapter 3). Furthermore the calcination at high temperature should be as long as possible in order to obtain the best results: in the reported spectrum, the sample was kept at 450 °C for 6 h, with an overall activation time of more than 10 h. An alternative to harsh and time consuming activation procedures is offered by the physics of luminescence: fluorescence is observed when a photon is absorbed by a chromophore and thus re-emitted with a lower energy, being the spectral region of interest the visible one for most of the emissive moieties. Thus, if excitation wavelengths sufficiently far from visible are exploited in the Raman measurement, the emission occurs in a different spectral region with respect to the one where Raman scattering is occurring. In practice, such condition can be achieved using ultra-violet or infrared lasers.73 An alternative way to avoid fluorescence can be represented by the
collection of the anti-Stokes branch of the Raman spectrum, i.e. falling above the excitation energy thus far from the emission spectral region (even if this is not certain, as photon upconversion phenomena could occur). This peculiar modality was not exploited in this thesis since the available instrumentation does not allow it. The former possibility is thus more interesting, in particular UV-Raman because: i) the intrinsically higher intensity associated to high frequency excitations (! ∝ !!); ii) the possibility to exploit the resonance for
the numerous moieties owning absorption bands in the UV region; and iii) the lower extent of black-body emission in the UV region, thus allowing to easier perform experiments at high temperature. The UV-Raman technique was indeed one of the most successful in zeolites characterization, as demonstrated by the high quality of the related literature.40,69,73–81 Despite
these advantages, the photoinduced damage becomes a severe drawback in UV-Raman, being in most of the cases photochemical processes involved: the
exploitation of sample movement becomes of outmost importance for this specific approach.
In the next chapters of this thesis the application of UV-Raman to two case studies will be shown: i) the activation and reactivity toward methanol of H-ZSM-5; and ii) the characterization of TS-1 samples with different Ti speciations. The former topic strictly followed the development of the setup as described in Chapter 2, representing an optimal testing and optimization opportunity for the same. The latter study instead was carried on with more fundamental purposes: exploiting the new possibilities opened by the setup, a fine characterization of TS-1 was performed, complemented by a multi-technique approach. A parallel quantum mechanical modeling has been established in order to increase the understanding on the basic physics of the previous experimental evidences.
References
(1) Meier, W. M. Zeolites and Zeolite-like Materials. Pure Appl. Chem. 1986, 58 (10), 1323—1328.
(2) Baerlocher, C.; McCusker, L. B.; Olson, D. H. Atlas of Zeolite Framework Types, 6th ed.; Elsevier, 2007.
(3) From the International Zeolites Association Structure Commission website: http://www.iza-structure.org/.
(4) Cronstedt, A. F. Om En Obekant Bårg Art, Som Kallas Zeolites. K. Sven. vetensk.akad. handl. 1756, 120–123.
(5) Flanigen, E. M.; Bennett, J. M.; Grose, R. W.; Cohen, J. P.; Patton, R. L.; Kirchner, R. M.; Smith, J. V. Silicalite, a New Hydrophobic Crystalline Silica Molecular Sieve. Nature 1978, 271 (5645), 512–516.
(6) Bibby, D. M.; Milestone, N. B.; Aldridge, L. P. Silicalite-2, a Silica Analogue of the Aluminosilicate Zeolite ZSM-11. Nature 1979, 280 (5724), 664–665.
(7) Camblor, M. A.; Corma, A.; Valencia, S. Spontaneous Nucleation and Growth of Pure Silica Zeolite-Beta Free of Connectivity Defects. Chem. Commun. 1996, No. 20, 2365-2366.
(8) Díaz-Cabañas, M.-J.; Barrett, P. A. Synthesis and Structure of Pure SiO2
Chabazite: the SiO2 Polymorph with the Lowest Framework Density.
Chem. Commun. 1998, No. 17, 1881–1882.
(9) Boyd, G. E.; Adamson, W.; Myers, L. S. The Exchange Adsorption of Ions from Aqueous Solutions by Organic Zeolites; Kinetics. J. Am. Chem. Soc. 1947, 69 (11), 2836–2848.
(10) Erdem, E.; Karapinar, N.; Donat, R. The Removal of Heavy Metal Cations by Natural Zeolites. J. Colloid Interface Sci. 2004, 280 (2), 309–314.
(11) Wang, S.; Peng, Y. Natural Zeolites as Effective Adsorbents in Water and Wastewater Treatment. Chem. Eng. J. 2010, 156 (1), 11–24.
(12) Walton, K. S.; Abney, M. B.; Douglas LeVan, M. CO2 Adsorption in Y and
X Zeolites Modified by Alkali Metal Cation Exchange. Microporous Mesoporous Mater. 2006, 91 (1), 78–84.
(13) Montanari, T.; Busca, G. On the Mechanism of Adsorption and Separation of CO2 on LTA Zeolites: An IR Investigation. Vib. Spectrosc.
2008, 46 (1), 45–51.
(14) Yang, S.-T.; Kim, J.; Ahn, W.-S. CO2 Adsorption over Ion-Exchanged
Zeolite Beta with Alkali and Alkaline Earth Metal Ions. Microporous Mesoporous Mater. 2010, 135 (1–3), 90–94.
(15) Palomino, M.; Corma, A.; Rey, F.; Valencia, S. New Insights on CO2
-Methane Separation Using LTA Zeolites with Different Si/Al Ratios and a First Comparison with MOFs. Langmuir 2010, 26 (3), 1910–1917.
(16) Brandenberger, S.; Kröcher, O.; Tissler, A.; Althoff, R.; Kroecher, O.; Tissler, A.; Althoff, R. The State of the Art in Selective Catalytic Reduction of NOx by Ammonia Using Metal Exchanged Zeolite Catalysts.
Catal. Rev. 2008, 50 (4), 492–531.
(17) Kwak, J. H.; Tonkyn, R. G.; Kim, D. H.; Szanyi, J.; Peden, C. H. F. Excellent Activity and Selectivity of Cu-SSZ-13 in the Selective Catalytic Reduction of NOx with NH3. J. Catal. 2010, 275 (2), 187–190.
(18) Fickel, D. W.; D’Addio, E.; Lauterbach, J. A.; Lobo, R. F. The Ammonia Selective Catalytic Reduction Activity of Copper-Exchanged Small-Pore Zeolites. Appl. Catal. B Environ. 2011, 102 (3–4), 441–448.
(19) Lallemand, M.; Finiels, A.; Fajula, F.; Hulea, V. Catalytic Oligomerization of Ethylene over Ni-Containing Dealuminated Y Zeolites. Appl. Catal. A Gen. 2006, 301 (2), 196–201.
(20) Mlinar, A. N.; Baur, G. B.; Bong, G. G.; Getsoian, A.; Bell, A. T. Propene Oligomerization over Ni-Exchanged Na-X Zeolites. J. Catal. 2012, 296, 156–164.
(21) Haw, J. F.; Nicholas, J. B.; Xu, T.; Beck, L. W.; Ferguson, D. B. Physical Organic Chemistry of Solid Acids: Lessons From in Situ NMR and Theoretical Chemistry. Acc. Chem. Res. 1996, 29 (6), 259–267.
(22) Marcilly, C. Where and How Shape Selectivity of Molecular Sieves Operates in Refining and Petrochemistry Catalytic Processes. Top. Catal. 2000, 13 (4), 357–366.
(23) Smit, B.; Maesen, T. L. M. Towards a Molecular Understanding of Shape Selectivity. Nature 2008, 451 (7179), 671–678.
(24) Degnan, Jr., T. F. Applications of Zeolites in Petroleum Refing. Top. Catal. 2000, 13 (4), 349–356.
(25) Corma, A.; Martínez, A. Zeolites in Refining and Petrochemistry. In Studies in Surface Science and Catalysis; 2005; Vol. 157, pp 337–366. (26) Lok, B. M.; Messina, C. A.; Patton, R. L.; Gajek, R. T.; Cannan, T. R.;
Flanigen, E. M. Silicoaluminiphosphate Molecular Sieves: Another New Class of Microporus Crysalline Inorganic Solids. J. Am. Chem. Soc. 1984, 106 (8), 6092–6093.
(27) Wilson, S. T.; Lok, B. M.; Messina, C. A.; Cannan, T. R.; Flanigen, E. M. Aluminophosphate Molecular Sieves: A New Class of Microporous Crystalline Inorganic Solids. J. Am. Chem. Soc. 1982, 104 (4), 1146– 1147.
(28) Gabelica, Z.; Guth, J. L. Germanium-Rich MFI Zeolites : The First Example of An Extended Framework Substitution of Silicon By Another Tetravalent Element. In Studies in Surface Science and Catalysis; 1989; Vol. 49, pp 421–430.
(29) Bu, X.; Feng, P.; Gier, T. E.; Zhao, D.; Stucky, G. D. Hydrothermal Synthesis and Structural Characterization of Zeolite-like Structures Based on Gallium and Aluminum Germanates. J. Am. Chem. Soc. 1998, 120 (51), 13389–13397.
(30) Su, J.; Wang, Y.; Wang, Z.; Lin, J. PKU-9: An Aluminogermanate with a New Three-Dimensional Zeolite Framework Constructed from CGS Layers and Spiro -5 Units. J. Am. Chem. Soc. 2009, 131 (17), 6080– 6081.
(31) Hua, W.; Chen, H.; Yu, Z.-B.; Zou, X.; Lin, J.; Sun, J. A Germanosilicate Structure with 11×11×12-Ring Channels Solved by Electron Crystallography. Angew. Chemie Int. Ed. 2014, 53 (23), 5868–5871. (32) Jiang, J.; Yun, Y.; Zou, X.; Jorda, J. L.; Corma, A. ITQ-54: A
Multi-Dimensional Extra-Large Pore Zeolite with 20×14×12-Ring Channels. Chem. Sci. 2015, 6 (1), 480–485.
(33) Notari, B.; Perego, G.; Taramasso, M. Preparation of Porous Crystalline Synthetic Material Comprised of Silicon and Titanium Oxides. US4410501 A, 1983.
(34) Bellussi, G.; Carati, A.; Clerici, M. G.; Esposito, A.; Millini, R.; Buonomo, F. Procede Pour La Preparation de Materiaux Synthetiques Cristallins Poreux Constitues d’Oxydes de Silicium et de Titane. BE1001038 (A7), 1989.
(35) Camblor, M. A.; Corma, A.; Pérez-Pariente, J. Synthesis of Titanoaluminosilicates Isomorphous to Zeolite Beta, Active as Oxidation Catalysts. Zeolites 1993, 13 (2), 82–87.
(36) Eilertsen, E. A.; Giordanino, F.; Lamberti, C.; Bordiga, S.; Damin, A.; Bonino, F.; Olsbye, U.; Lillerud, K. P. Ti-STT: A New Zeotype Shape Selective Oxidation Catalyst. Chem. Commun. 2011, 47 (43), 11867– 11869.
(37) Eilertsen, E. A.; Bordiga, S.; Lamberti, C.; Damin, A.; Bonino, F.; Arstad, B.; Svelle, S.; Olsbye, U.; Lillerud, K. P. Synthesis of Titanium Chabazite: A New Shape Selective Oxidation Catalyst with Small Pore Openings and Application in the Production of Methyl Formate from Methanol. ChemCatChem 2011, 3 (12), 1869–1871.
(38) Notari, B. Microporous Crystalline Titanium Silicates. In Advances in Catalysis; Eley, D. D., Haag, W. O., Gates, B., Eds.; Elsevier Academic Press Inc: San Diego, 1996; Vol. 41, pp 253–334.
(39) Romano, U.; Ricci, M. Industrial Applications. In Liquid Phase Oxidation via Heterogeneous Catalysis; Clerici, M. G., Kholdeeva, O. A., Eds.; John Wiley & Sons, Inc.: Hoboken, New Jersey, 2013; pp 451–506.
(40) Bordiga, S.; Damin, A.; Bonino, F.; Ricchiardi, G.; Lamberti, C.; Zecchina, A. The Structure of the Peroxo Species in the TS-1 Catalyst as Investigated by Resonant Raman Spectroscopy. Angew. Chemie-International Ed. 2002, 41 (24), 4734–4737.
(41) Prestipino, C.; Bonino, F.; Usseglio, S.; Damin, A.; Tasso, A.; Clerici, M. G.; Bordiga, S.; D’Acapito, F.; Zecchina, A.; Lamberti, C. Equilibria between Peroxo and Hydroperoxo Species in the Titanosilicates: An in Situ High-Resolution XANES Investigation. ChemPhysChem 2004, 5 (11), 1799–1804.
(42) Bordiga, S.; Bonino, F.; Damin, A.; Lamberti, C. Reactivity of Ti(iv) Species Hosted in TS-1 towards H2O2–H2O Solutions Investigated by Ab
Initio Cluster and Periodic Approaches Combined with Experimental XANES and EXAFS Data: A Review and New Highlights. Phys. Chem. Chem. Phys. 2007, 9 (35), 4854–4878.
(43) Neri, C.; Anfossi, B.; Esposito, A.; Buonomo, F. Process for the Epoxidation of Olefinic Compounds. US4833260 (A), 1984.
(44) Roffia, P.; Padovan, M.; Moretti, E.; De Alberti, G. Catalytic Process for Preparing Cyclohexanone-Oxime. US 4745221 (A), 1988.
(45) Chester, A. W.; Derouane, E. G. Zeolite Chemistry and Catalysis; Springer Netherlands: Dordrecht, 2009.
(46) Lercher, J. A.; Gründling, C.; Eder-Mirth, G. Infrared Studies of the Surface Acidity of Oxides and Zeolites Using Adsorbed Probe Molecules. Catal. Today 1996, 27 (3–4), 353–376.
(47) Zecchina, A.; Spoto, G.; Bordiga, S. Probing the Acid Sites in Confined Spaces of Microporous Materials by Vibrational Spectroscopy. Phys. Chem. Chem. Phys. 2005, 7 (8), 1627.
(48) van Bokhoven, J. A.; Lamberti, C. Structure of Aluminum, Iron, and Other Heteroatoms in Zeolites by X-Ray Absorption Spectroscopy. Coord. Chem. Rev. 2014, 277, 275–290.
(49) Bordiga, S.; Lamberti, C.; Bonino, F.; Travert, A.; Thibault-Starzyk, F. Probing Zeolites by Vibrational Spectroscopies. Chem. Soc. Rev. 2015, 44 (20), 7262–7341.
(50) Raman, C. V.; Krishnan, K. S. A New Type of Secondary Radiation. Nature 1928, 121, 501–502.
(51) Smekal, A. Zur Quantentheorie Der Dispersion. Naturwissenschaften 1923, 11 (43), 873–875.
(52) Landsberg, G.; Mandelstam, L. Eine Neue Erscheinung Bei Der Lichtzerstreuung in Krystallen. Naturwissenschaften 1928, 16 (28), 557–558.
2002.
(54) Browne, W. R.; McGarvey, J. J. The Raman Effect and Its Application to Electronic Spectroscopies in Metal-Centered Species: Techniques and Investigations in Ground and Excited States. Coord. Chem. Rev. 2007, 251 (3), 454–473.
(55) Kramers, H. A.; Heisenberg, W. Über Die Streuung von Strahlung Durch Atome. Zeitschrift für Phys. 1925, 31 (1), 681–708.
(56) Dirac, P. A. M. The Quantum Theory of Dispersion. Proc. R. Soc. A Math. Phys. Eng. Sci. 1927, 114 (769), 710–728.
(57) Behringer, J. Zur Theorie Des Resonanz-Raman-Effektes. Zev. F. Elektrochemie Ber. der Bunsen Ges. für Phys. 1958, 62 (8), 906–914. (58) Albrecht, A. C. On the Theory of Raman Intensities. J. Chem. Phys.
1961, 34 (5), 1476-1484.
(59) Herzberg, G.; Teller, E. Schwingungsstruktur Der Elektronenübergange Bei Mehratomigen Moleklen. Zeitschrift für Phys. Chemie B 1933, 21, 410.
(60) Avila Ferrer, F. J.; Barone, V.; Cappelli, C.; Santoro, F. Duschinsky, Herzberg–Teller, and Multiple Electronic Resonance Interferential Effects in Resonance Raman Spectra and Excitation Profiles. The Case of Pyrene. J. Chem. Theory Comput. 2013, 9 (8), 3597–3611.
(61) McCreery, R. L. Photometric Standards for Raman Spectroscopy. In Handbook of Vibrational Spectroscopy; Griffiths, P. R., Ed.; John Wiley & Sons, Ltd: Chichester, UK, 2006; pp 920–932.
(62) Aggarwal, R. L.; Farrar, L. W.; Saikin, S. K.; Aspuru-Guzik, A.; Stopa, M.; Polla, D. L. Measurement of the Absolute Raman Cross Section of the Optical Phonon in Silicon. Solid State Commun. 2011, 151 (7), 553– 556.
(63) Shim, S.; Stuart, C. M.; Mathies, R. A. Resonance Raman Cross-Sections and Vibronic Analysis of Rhodamine 6G from Broadband Stimulated
Raman Spectroscopy. ChemPhysChem 2008, 9 (5), 697–699.
(64) Le Ru, E. C.; Schroeter, L. C.; Etchegoin, P. G. Direct Measurement of Resonance Raman Spectra and Cross Sections by a Polarization Difference Technique. Anal. Chem. 2012, 84 (11), 5074–5079.
(65) Silva, W. R.; Keller, E. L.; Frontiera, R. R. Determination of Resonance Raman Cross-Sections for Use in Biological SERS Sensing with Femtosecond Stimulated Raman Spectroscopy. Anal. Chem. 2014, 86 (15), 7782–7787.
(66) Kiefer, W.; Bernstein, H. J. Rotating Raman Sample Technique for Colored Crystal Powders; Resonance Raman Effect in Solid KMnO4. Appl.
Spectrosc. 1971, 25 (6), 609–613.
(67) Cheng, C. P.; Ludowise, J. D.; Schrader, G. L. Controlled-Atmosphere Rotating Cell for in Situ Studies of Catalysts Using Laser Raman Spectroscopy. Appl. Spectrosc. 1980, 34 (2), 146–150.
(68) Müller, A.; Weber, T. In Situ Raman Investigation of Hydrodesulphurization Catalysts. Appl. Catal. 1991, 77 (2), 243–250. (69) Chua, Y.; Stair, P. C. A Novel Fluidized Bed Technique for Measuring UV
Raman Spectra of Catalysts and Adsorbates. J. Catal. 2000, 196 (1), 66–72.
(70) Beato, P.; Schachtl, E.; Barbera, K.; Bonino, F.; Bordiga, S. Operando Raman Spectroscopy Applying Novel Fluidized Bed Micro-Reactor Technology. Catal. Today 2013, 205, 128–133.
(71) Dutta, P. K.; Twu, J. Influence of Framework Silicon/aluminum Ratio on the Raman Spectra of Faujasitic Zeolites. J. Phys. Chem. 1991, 95 (6), 2498–2501.
(72) Bremard, C.; Le Maire, M. Low-Frequency Raman Spectra of Dehydrated Faujasitic Zeolites. J. Phys. Chem. 1993, 97 (38), 9695–9702.
(73) Fan, F.; Feng, Z.; Li, C. UV Raman Spectroscopic Studies on Active Sites and Synthesis Mechanisms of Transition Metal-Containing Microporous
and Mesoporous Materials. Acc. Chem. Res. 2010, 43 (3), 378–387. (74) Bordiga, S.; Damin, A.; Bonino, F.; Ricchiardi, G.; Zecchina, A.;
Tagliapietra, R.; Lamberti, C. Resonance Raman Effects in TS-1: The Structure of Ti(IV) Species and Reactivity towards H2O, NH3 and H2O2:
An in Situ Study. Phys. Chem. Chem. Phys. 2003, 5 (20), 4390–4393. (75) Chua, Y. T.; Stair, P. C. An Ultraviolet Raman Spectroscopic Study of
Coke Formation in Methanol to Hydrocarbons Conversion over Zeolite H-MFI. J. Catal. 2003, 213 (1), 39–46.
(76) Li, C.; Stair, P. C. Ultraviolet Raman Spectroscopy Characterization of Coke Formation in Zeolites. Catal. Today 1997, 33 (1–3), 353–360. (77) Li, C. Identifying the Isolated Transition Metal Ions/oxides in Molecular
Sieves and on Oxide Supports by UV Resonance Raman Spectroscopy. J. Catal. 2003, 216 (1–2), 203–212.
(78) Li, C.; Xiong, G.; Liu, J.; Ying, P.; Xin, Q.; Feng, Z. Identifying Framework Titanium in TS-1 Zeolite by UV Resonance Raman Spectroscopy. J. Phys. Chem. B 2001, 105 (15), 2993–2997.
(79) Stair, P. C. The Application of UV Raman Spectroscopy for the Characterization of Catalysts and Catalytic Reactions. Advances in Catalysis. 2007, pp 75–98.
(80) Bonino, F.; Damin, A.; Piovano, A.; Lamberti, C.; Bordiga, S.; Zecchina, A. Direct Evidence of Highly Dispersed Iron in Fe-Silicalite: A Raman Spectroscopic Study. ChemCatChem 2011, 3 (1), 139–142.
(81) Guo, Q.; Feng, Z.; Li, G.; Fan, F.; Li, C. Finding The “missing Components” during the Synthesis of TS-1 Zeolite by UV Resonance Raman Spectroscopy. J. Phys. Chem. C 2013, 117 (6), 2844–2848.
Chapter 2
The development of a new setup: toward in situ
and operando Raman of zeolites
As already discussed in Chapter 1, the Raman approach to zeolites characterization is often a complex task. Recalling the main reasons, the sample damaging induced by the intense excitation lasers and the strong fluorescence from these samples are the most critical drawbacks. The latter can be solved by choosing excitation wavelengths far from the typical emission region (i.e. UV or IR),1 whereas the former can be avoided by continuously
changing the spot on the sample exposed to the laser beam. In order to exploit such solution the sample must be kept moving during the whole measurement. Of course it is necessary to avoid as much as possible the reduction of the spectral quality caused by the movement, thus the design of a dedicated setup requires a careful consideration of all the possible sources of interference to the Raman signal. A number of examples of setups are available in the literature, everyone with its strengths and weaknesses: before to introduce the solution specifically developed for this thesis work, an in depth review of the previous milestone in this field will be given. Emphasis will be in particular on setups devoted to solids and solid-gas interaction studies, i.e. closely related to the kind of experimental approach exploited along this thesis.
2.1 Raman and sample movement: state of art
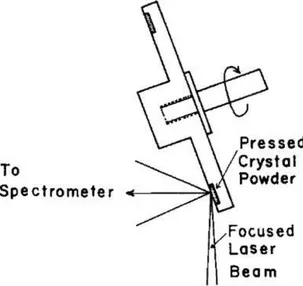
The first example of a Raman measurement performed with a moving sample reported in the literature is probably represented by the rotating sample holder developed by Kiefer and Bernstein in 1971.2 The concept of the
a circular groove of the sample holder (forming a ring-shaped, self-supported pellet) and the analysis is performed sampling the material while it is rotated.
Figure 2.1 Scheme of the rotating sample holder by Kiefer and Bernstein. Reproduced from
Ref. 2.
This solution allowed its inventors to measure a highly absorbing material such as potassium permanganate without destroying it, thus demonstrating the positive effect of the sample rotation.
Cheng and coworkers exploited again the same concept 9 years later, according to the construction outlined in Figure 2.2.3
Figure 2.2 Scheme of the controlled atmosphere cell with rotating sample by Cheng and
The proposed cell introduces several evolutions with respect to the previous one: now the rotating sample holder is enveloped in a sealed chamber, allowing to expose the sample to a desired pressure/flow of a gas or to vacuum. Further temperature control is made possible by an external furnace and/or by flowing gases at a given temperature. The rotation is transmitted to the sample holder by an external motor and the coupling of the two parts is probably the most complex feature of the cell (and also its Achilles’ heel): because of the complicated driving system, the cell «presents technical problems in minimizing the mechanical distortions […] and in the sealing of the cell» as commented by Müller and Weber.4 The latter proposed an
alternative solution, as depicted in Figure 2.3.
Figure 2.3 Scheme of the controlled atmosphere cell with scanning excitation laser by Müller
The novelty of such device is to avoid any mechanical part in the controlled atmosphere region of the cell, ascribing to the complex system of transmission of motion the weakness of the previous setup. Thus, instead of moving the sample itself, it is scanned by a movable laser beam: the incoming light is reflected by a rotating prismatic mirror (n. 4 in Figure 2.3), changing time by time the position of the measurement spot on the material. The scattered light is then recollected by a concave mirror and directed to the collection optics. Even if the present solution simplifies the problem of the cell sealing, it introduces new sources of aberration: it is possible to infer that the optimal collection of the Raman signal requires a high quality alignment of the optical elements, so each experiment is necessarily preceded by a time consuming optimization of the Raman instrumentation.
Reaching the 2000’s the development of new Raman setups was progressively oriented to the study of reactions while occurring, i.e. carrying out the measurements in the so called operando conditions.5 Anticipating the
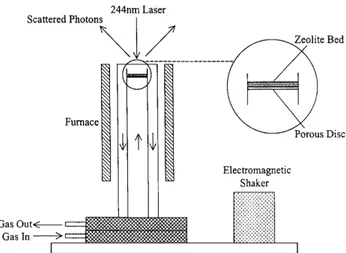
definition by Bañares, Chua and Stair developed in 2000 a new type of cell, more precisely definable as a reactor:6 The sketch of the reactor-cell is
reported in Figure 2.4.
Even if the reactions were not followed by online products analysis, the reactor was constructed in order to allow the spectroscopic study in realistic reaction conditions: in particular the authors focused on the formation of coke upon conversion of methanol to olefines on zeolites, thus the use of a UV-Raman setup was compulsory to avoid the strong emission of the coke species.7 Since the risk of laser-induced damage is highly probable in these
conditions, the sample was moved during the measurement by exploiting bed fluidization: the continuous exchange of the catalyst particles under the beam avoids their decomposition due to the laser. The fluidization is achieved in this device by a combination of fast gas flow through the catalytic bed and electromagnetic shaking of the whole reactor. The results achieved with this setup were really satisfactory, since also strong UV absorber like Polycyclic Aromatic Hydrocarbons (PAHs) can be effectively measured avoiding any type of damage.7 This point is really important in the study of coke formation of
zeolites, since the sample preservation makes sure that the carbonaceous species observed originate from the reaction and not from spurious, laser induced sample damaging.
The more recent example of Raman setup with movable sample is due to Beato and coworkers, realized by modifying a commercial Linkam CCR1000 reactor-cell as shown in Figure 2.5a.8 This device again exploits the catalytic
bed fluidization, but it was realized with a fully fluid-dynamic concept as Figure 2.5b illustrates: the powder is fluidized by backflow pulses with regular frequency, produced by a dedicated device. The versatility of this tool has been demonstrated by application involving several heterogeneous catalysts.8,9
Despite its excellent capability to preserve the sample from laser-degradation, fluidization is also a possible source of drawbacks: i) unavoidably the sample is partially lost during the experiment, limiting the time framework available to perform it; ii) the continuous friction among the particles leads to their progressive morphological modification, so that occasionally the fluidization
conditions (strongly connected to the particles shape and size) are no longer achievable iii) in presence of condensable vapors, the wetting of the catalyst can prevent the fluidization to occur; and iv) since a gas flow is required to fluidize the powder, the reactor-cell is not suitable for working in batch (i.e. static conditions) or in vacuum.
Figure 2.5 a) Scheme of the modified Linkam CCR1000 fluidized bed reactor-cell by Beato and
coworkers; b) detail of the fluidization mechanism. Reproduced from Ref. 8.
2.2 Development of a new Raman setup
Analyzing the outcomes from the literature analysis presented in the previous section, it is clear that the development of a Raman setup allowing the sample motion is not a straightforward path. As for every technological implementation, the starting point is to clearly define the requirements for the final object: concerning the goals of this thesis, the cell must allow to perform Raman measurement in controlled atmosphere (vacuum, static and/or flowing gas), to perform thermal treatments and to exploit the maximum laser power thus reducing the measuring time (but avoiding at the same time any sample damage induced by the excitation source). Being the two former requirements easily satisfied by a simple quartz cell coupled with an oven and a gas/vacuum manifold, the latter represent the real technological challenge. According to
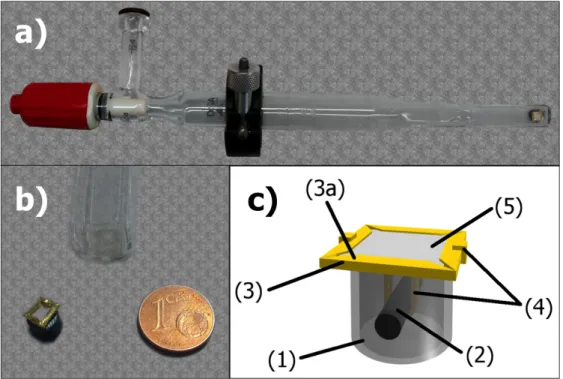
the literature, three possible implementations have been attempted to solve this problem: i) the mechanical rotation of the sample in pellet form; ii) the displacement of the measurement spot over the sample; and iii) the exploitation of fluidized bed conditions over powder samples. Because of the blocked construction of the available Raman instrumentation, the second possibility has been immediately neglected. Comparing the remaining two, the mechanical implementation is preferable because technically easier and suitable for every kind of controlled atmosphere, whereas the fluidized bed solution can work only in flow conditions in combination with special devices producing the fluidization. However the sealing drawback becomes limiting for the former, since the driving elements for the sample holder require a connection with the external environment, thus a possible leaking point. The solution to this problem was found by implementing a contactless transmission of the mechanical force: as in a common magnetic stirrer, a rotary movement of the sample holder induced by a rotating magnetic field. The sample holder is the core of the setup, as it contains a permanent magnet which is forced to align to the applied field, thus producing the sample movement. In this way all the mechanical components are placed outside the controlled atmosphere region, which can be now completely separated from the external environment.
At the present implementation the sample holder is realized by a stainless steel hollow cylinder of 6 mm diameter and ~5 mm height. The magnetic element is an AlNiCo-5 cylindrical bar, mounted along the stainless steel cylinder through two holes drilled in its walls: the choice of this magnetic alloy is due to its high Curie temperature (above 800 °C, allowing to perform high temperature activation treatment without losing the magnetization) and to its reasonable magnetic coercivity (about 50 kA m-1). By comparison, a
neodymium based magnet can reach 15-20 times higher coercivity values, but it will never be suitable for high temperature applications because of the lower