DOTTORATO DI RICERCA IN
Scienze ambientali: tutela e gestione
delle risorse naturali
Ciclo XXVIII
Settore Concorsuale di afferenza: 04/A4 Settore Scientifico disciplinare: GEO/12
TITOLO TESI
Predictability studies
for Regions Of Freshwater Influence
Presentata da: Giorgia Verri
Coordinatore Dottorato
Relatore
Prof. Enrico Dinelli
Prof. Nadia Pinardi
Centre for Maritime Research and Experimentation CMRE,
La Spezia, Italia
Precedentemente: Istituto Nazional di Geofisica e
Vulcanologia, Bologna Italia
• Dr. Antonio Navarra
Centro Euro-Mediterraneo sui Cambiamenti Climatici, Italia
Istituto Nazional di Geofisica e Vulcanologia, Bologna Italia
• Dr. Joseph Tribbia
National Center for Atmospheric Research NCAR, Boulder
Colorado
I thank her and my Division Director, Dr. Giovanni Coppini, for giving me the chance to spend a visiting period at the National Center for Atmospheric Research, NCAR where I met intense researchers and friends. I feel extremely lucky to have had this opportunity. I’m thankful to my Division Director also for his advices and the time he devoted to my concerns.
I would like to acknowledge my co-tutors Dr. Paolo Oddo, Dr. Antonio Navarra and Dr. Joseph Tribbia, their huge expertise helped me a lot.
I finally would like to thank all my colleagues of OPA Division at CMCC, with whom I share days full of work but also full of smiles.
Last but not least, I want to thank my family, my mother Laura, my father Fulvio, my brother Luigi and my boyfriend Carlo. I am sure that a simple thank you will never be enough to express my gratitude.
1.1 River role in the world ocean circulation and the Mediterranean Sea 10
1.2 Structure of the Regions Of Freshwater Influence . . . 12
1.3 Numerical modeling the coastal water cycle . . . 14
1.4 Objectives and structure of the thesis . . . 16
2 River e↵ects on the overturning circulation and dynamics of the Central Mediterranean Sea 21 2.1 Introduction . . . 22
2.2 Experimental design . . . 25
2.2.1 Model configuration and twin-experiment set-up . . . 25
2.2.2 River runo↵ parameterization and datasets . . . 26
2.2.3 Model validation with observations . . . 31
2.3 Is the Adriatic Sea an estuarine or anti-estuarine basin? . . . 32
2.4 How is the intensity of Central Mediterranean MOC a↵ected by runo↵? . . . 35
2.5 How do rivers influence the formation of dense water in the Adri-atic Sea? . . . 37
2.6 How do rivers influence the volume of Adriatic dense water that spreads into the Northern Ionian Sea? . . . 39
2.7 Summary, conclusions and future developments . . . 39
3 The local water cycle of river catchments. Modeling the me-teorological and hydrological processes 55 3.1 Introduction . . . 56
3.2 The study area . . . 58
3.3 The experimental set-up of the meteo-hydrological modeling system 59 3.3.1 Advanced Research WRF meteorological model . . . 61
3.3.2 NOAH-MP land surface model . . . 62
3.4 Analysis of the modeling results . . . 68
3.4.1 Mesoscale meteorological features . . . 68
3.4.2 The Precipitation field . . . 70
3.4.3 The river streamflow . . . 72
3.4.4 WRF-Hydro simulated river runo↵ versus NOAH-MP pa-rameterized surface runo↵ . . . 75
3.5 Conclusions . . . 76
4 The physical regime of ROF IS 91 4.1 Introduction . . . 92
4.2 Estuarine dynamics: the theory . . . 93
4.2.1 The development of new approach: the Knudsen’s relation upgraded with the tidal e↵ect . . . 94
4.2.2 The UCONN-NCAR estuary box model . . . 96
4.3 Application: the estuarine dynamics of the Ofanto river . . . 99
4.4 The coupling with the ocean: the coastal dynamics o↵ the Ofanto estuary . . . 101
4.5 Summary and concluding remarks . . . 104
5 Conclusions and future perspectives 116
Appendix A
The numerical model configuration 119
Appendix B
The computation of Spall’s coefficients 125
are mean annual discharge (km /yr); the arrows are proportional to these numbers (from Milliman and Farnsworth, 2013) . . . 19 1.2 Schematic of a surface advected plume (from Yankovsky et Chapman,
1997) . . . 19 1.3 Schematic of a bottom advected plume (from Yankovsky et Chapman,
1997) . . . 19 1.4 Schematic of the components of estuary vertical profile of velocity . . 20 2.1 The conveyor belts of the Mediterranean Sea. The red and yellow
dashed streamlines in the zonal direction stand for the zonal over-turning circulation in the surface-intermediate layers that is forced by the Gibraltar stream flow and Levantine Intermediate Water (LIW) formation processes. The red spirals indicate the preferential sites for strong heat losses during wintertime and dense water formation processes. Two anti-cyclonic meridional overturning circulation pat-terns can be distinguished (white spirals): the Western Mediterranean MOC originating in the Gulf of Lion, and the Central Mediterranean MOC originating in the Adriatic Sea (reproduced from Pinardi et al., 2006) . . . 42 2.2 Model domain and details on areas of interest. The red lines define
the three Adriatic sub-regions and the Ionian Sea. Black isolines show the bathymetry. Blue stars and arrows indicate the model river mouths 43 2.3 Top Panel: Daily Time Series of total river discharge during the entire
simulation period, 1999-01-01 to 2012-12-31. Bottom Panel: Focus on Po river discharge based on observations . . . 44 2.4 The trajectory of two Argo profiling floats over 2010-2012. Numbers
indicate the ascending profiles: 193 into the Adriatic Sea and 92 into the Ionian Sea . . . 45 2.5 Temperature and Salinity RMSE and BIAS for the available Argo
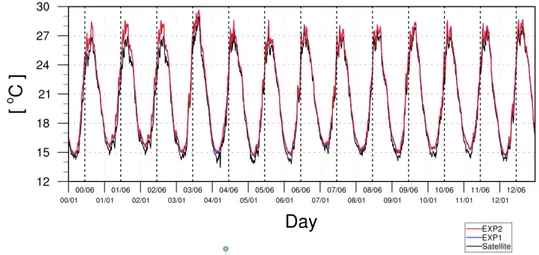
2.6 Monthly time series of satellite (black line) and modelled (red line for EXP2 and blue line for EXP1) Sea Surface Temperature. EXP 1 RM SE = 0.78 C, EXP 2 RM SE = 0.81 C . . . 47 2.7 Seasonal time series of the surface freshwater budget respectively for
the entire computational domain (top), and the Adriatic Sea only (bottom). The red lines are for the freshwater budget (E P ) in EXP2, while the blue ones are for (E P R/A) in EXP1 . . . 48 2.8 Top panel: Annual time series of buoyancy flux, R R QbdA/A, for
EXP1 and EXP2 and the relative di↵erence. Bottom Panel: Annual time series of normalised averaged wind work, ⇢10 R R ⌧·usdA
V , for EXP1
and EXP2. Results are only relevant to the Adriatic Sea . . . 49 2.9 Multi-annual Meridional Transport Stream Function for the Central
Mediterranean Sea . . . 49 2.10 Summer 2002 (Top Panel) and Summer 2009 (Bottom Panel)
Merid-ional Transport Stream Function for the Central Mediterranean Sea . 50 2.11 Daily averaged time series of water volumes with ✓ > 29.2kgm 3 in
the SAd sub-region. The blue line stands for EXP1, the red line for EXP2 . . . 50 2.12 ⇥ S diagram in winter 2009 for EXP1 (blue dots) and EXP2 (red
dots) in three zonal sections related to NAd sub-region at 44.38N (top panel), MAd at 42.6 N (middle panel) and SAd at 41.61 N (bottom panel), respectively. The Western Adriatic Coastal Current, WACC, the Eastern Southern Adriatic Current, ESAC, the Western bottom current and the Modified Levantine Intermediate Water, MLIW, are marked in the bottom panel according to the known range of temper-atures and salinities . . . 51 2.13 Seasonal potential density anomaly on a 200m layer above seabed and
di↵erence between EXP1 and EXP2 with zoom on the Ionian Sea . . 52 3.1 The study area. Left panel: WRF coarse domain (EEA-SRTM
topog-raphy dataset). Right panel: WRF inner and WRF-Hydro domain (EEA-Eudem topography dataset) . . . 78
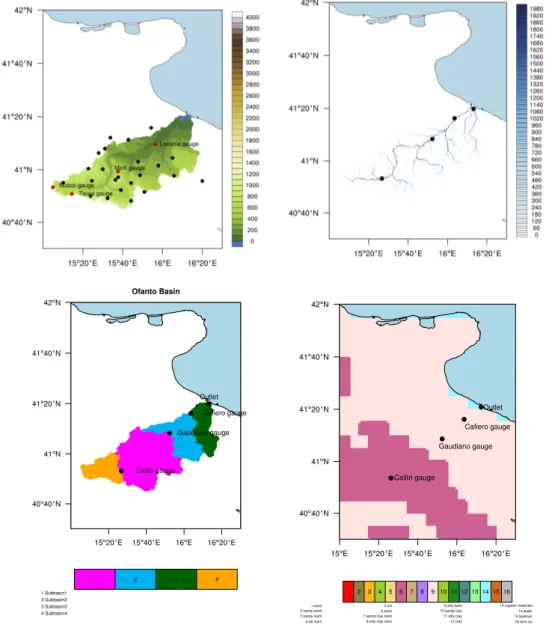
3.2 The Ofanto river Catchment. Top left panel: Topography height (units of m) and location of 27 rain-gauge stations in the catchment. Top right panel: Flow Accumulation grid defined by the number of grid cells which drain into an individual cell along the river net-work grid. Bottom left panel: The whole basin and the 4 sub-basins (coloured zones) defined as the areas upstream of the selected mon-itoring points (black dots). Bottom right panel: USGS Soil Type Categories in the region of the Ofanto basin. . . 79 3.3 The meteo-hydrological modeling chain . . . 80 3.4 The concatenation procedure of the simulations . . . 80 3.5 Mesoscale maps during the weather storm on 1 March 2011 (Event 1).
Top panel: WRF (domain1) Geopotential height (in m/10, colours) at 500hPa. Bottom panel: WRF (domain1) 2m Temperature (in Cdeg, colours) and 10m wind (in m/s, black arrows). . . 81 3.6 Mesoscale maps during the weather storm on 1 December 2013 (Event
2). Top panel: WRF (domain1) Geopotential height (in m/10, colours) at 500hPa. Bottom panel: WRF (domain1) 2m Temperature (in Cdeg, colours) and 10m wind (in m/s, black arrows) . . . 82 3.7 Validation of the hourly modeled precipitation through the entire
sim-ulation period in the Ofanto basin. Top Panels: observed and mod-elled time series at the stations with the best (left) and the worse (right) WRF performance for Experiment 1. Bottom Panels: ob-served and modelled time series at the stations with the best (left) and the worse (right) WRF performance for Experiment 2 . . . 83 3.8 Upper panels: Comparison of 24h cumulated precipitation on 2011/02/18
as recorded by 27 gauge-stations (left panel), modelled by WRF with start time 14h before the rain peak (middle panel) and modelled by WRF with start time 38h before the rain peak (right panel). Lower panels: Comparison of 24h cumulated precipitation on 2013/12/01 as recorded by 25 gauge-stations (left panel), modelled by WRF with start time 12h before the rain peak (middle panel) and modelled by WRF with start time 36h before the rain peak (right panel) . . . 84
3.9 Maps of 24h cumulated precipitations (in mm/day, colours) during the peak event on March, 1st 2011. Left panel: model findings (left),
Middle panel: 27 observed spots used for applying the Barnes method, Right panel: model findings corrected with Barnes scheme . . . 85 3.10 Maps of 24h cumulated precipitations (in mm/day, colours) during
the peak event on December, 1st 2013. Left panel: model findings
(left), Middle panel: 23 observed spots used for applying the Barnes method, Right panel: model findings corrected with Barnes scheme . 85 3.11 Validation of Ofanto discharge for Experiment 1 at Cafiero Station.
Top panel: modelled precipitation, aquifer switched on, calibration of NOAH and WRF-Hydro coefficients (discharge RMSE =0.75m , CORR=0.66). Bottom panel: assimilated precipitation, aquifer switched on, calibration of NOAH and WRF-Hydro coefficients (discharge RMSE = 0.65m, CORR=0.74) . . . 86 3.12 Validation of Ofanto discharge for Experiment 2 at Cafiero Station.
Top panel: modelled precipitation, aquifer switched on, calibration of NOAH and WRF-Hydro coefficients (discharge RMSE= 0.82m, CORR=0.81). Bottom panel: assimilated precipitation, aquifer switched
on, calibration of NOAH and WRF-Hydro coefficients (discharge RMSE=0.74m, CORR=0.88) . . . 87 3.13 Validation of Ofanto discharge for Experiment 1 at Cafiero Station
working with assimilated precipitation, calibration of NOAH and WRF-Hydro coefficients but aquifer switched o↵ (discharge RMSE= 0.69m, CORR=0.77) . . . 88 3.14 Comparison of Ofanto discharge for Experiment 1 at Cafiero
Sta-tion as provided by the best WRF-Hydro set-up (discharge RMSE= 0.65 m, CORR=0.74) and by NOAH-MP (discharge RMSE= 1.68 m, CORR=0.61) . . . 88 4.1 The estuary box. Shaded areas are the open boundaries . . . 107 4.2 Schematic of Knudsen’s model, boundaries and water masses involved.
4.3 Schematic of Knudsen’s model with tidal e↵ect added, boundaries and water masses involved. Black variables are the input forcings, red variables are the unknowns . . . 107 4.4 Schematic of UCONN-NCAR model with tidal e↵ect added,
bound-aries and water masses involved. Black variables are the input forcings, red variables are the unknowns . . . 108 4.5 Features of the tested approaches for representing the estuarine
dy-namics . . . 108 4.6 Discharge (upper panel) and salinity (lower panel) at the Ofanto river
outlet as simulated by the di↵erent methods . . . 109 4.7 Coastal dynamics o↵ the Ofanto estuary. Daily averaged sea surface
salinity on 2011/02/19 . . . 110 4.8 Coastal dynamics o↵ the Ofanto estuary. Zonal transect of daily
av-eraged salinity on 2011/02/19 . . . 111 4.9 Coastal dynamics o↵ the Ofanto estuary. Daily surface currents (units
of cm/s) on 2011/02/19 . . . 112 4.10 Coastal dynamics o↵ the Ofanto estuary. Daily averaged sea surface
salinity on 2011/03/03 . . . 113 4.11 Coastal dynamics o↵ the Ofanto estuary. Zonal transect of daily
av-eraged salinity on 2011/03/03 . . . 114 4.12 Coastal dynamics o↵ the Ofanto estuary. Daily surface currents (units
of cm/s) on 2011/03/03 . . . 115 B.1 Schematic of the idealized marginal sea model. (From Spall, 2012) . . 129
charge values. Some of the datasets consist of observations taken at hydrometric stations and some are estimated values. To note that Po di Levante and Po di Volano are point sources di↵erent from the 9 branches of the Po delta. Po river runo↵ values are not included in this Table since daily averaged observations are assumed at each branch of the delta . . . 54 2.2 Summary of the key parameters of the Twin Experiment. The
model-diagnosed quantities are the thermal forcing parameter µ/✏, the fresh-water forcing parameter /✏, the temperature anomaly of the convec-tive water mass 4T and the salinity anomaly of the convective water mass 4S . . . . 54 3.1 Details on the Experiments . . . 89 3.2 Terrestrial datasets and parameterization settings adopted over WRF
Domain 1 (6 km grid spacing) and Domain 2 (2 km grid spacing) . . 89 3.3 Statistical indices for validation of modeled precipitation by
compar-ison with rain-gauge stations in the Ofanto basin during the entire simulation period . . . 89 3.4 Tuned coefficients of WRF-Hydro/NOAH-MP for both Experiments . 90 3.5 Tuned coefficients of WRF-Hydro-aquifer model for each Ofanto river
1
Introduction
1.1
River role in the world ocean circulation
and the Mediterranean Sea
Rivers represent the primary link between the land and the ocean in the water cycle. Figure 4.2 shows the riverine freshwater discharge to the global coastal ocean following Milliman and Farnsworth, 2013: the mean annual discharge to the global ocean is estimate to be 36000 km3/yr. Rivers discharging into the
Black Sea and the Mediterranean Sea are estimated to be about 930 km3/yr and
are drawn Fig.4.2 as part of the European drainage into the North Atlantic (green area) which accounts for almost 2100 km3/yr. The e↵ects of the freshwater
dis-charge are generally confined to the coastal zone of the open ocean, but if the basins receiving the freshwater release are semi-enclosed (i.e. the Mediterranean Sea, the Adriatic sub-basin and the Black Sea) the rivers may strongly a↵ect the basin wide circulation and dynamics.
The literature counts several estimates of the total freshwater discharge into the Mediterranean Sea which have been performed by means of national and inter-national repositories as the Global River Discharge database RivDIS (Vrsmarty et al., 1998), the Global Runo↵ Data Center (GRDC) hydrological database and the Mediterranean Hydrological Cycle Observing System, Medhycos, data server (Medhycos, 2001) or by means of modelling studies (Ludwig et al., 2009). Most estimates vary around 400-450 km3/yr for the Mediterranean Sea and
350-400 km3/yr for the Black Sea. Major di↵erences among the several databases are
due to a strong damming occurred within the last 60 years (Skliris et al., 2007; Vervatis et al., 2013) in the Eastern and Western Mediterranean sub-basins in-volving their major freshwater sources (i.e. the construction of the Aswan Dam along the Nile, the damming of the Ebro river and the Russian rivers draining into the Black Sea).
Rivers flowing into the Adriatic Sea currently provide almost 1/3 of the total runo↵ of the Mediterranean basin with an annual rate estimate varying from 133 10
km3/yr (Vrsmarty et al., 1998) to 164 km3/yr (UNEP, 1978). In details the
“river runo↵” represents about 80% of the annual freshwater rate into the Adri-atic Sea. About 19% of the total runo↵ rate is not conveyed by rivers but enters the sea as “land runo↵” particularly along the dalmatian coast and an additional 1% is caused by “submarine springs” mostly near the eastern coast (Struglia et al., 2004). The river runo↵ in the Adriatic basin is mainly due to the Po river, carrying alone about 28% of the basin annual value, 19% comes from the other rivers along the northern coast (mainly Adige and Isonzo), 45% comes from the eastern coast (Buna/Bojana, Vjose and Neretva among the others), and the re-maining 8% from the western coast (Raicich, 1996).
As know from the literature, the whole Mediterranean Sea is a “concentration basin” (Pinardi et al., 2006; Cessi and Pinardi, 2014) with negative annual heat flux meaning the net heat flux is upward oriented (-7 W m 2 following Pettenuzzo
et al., 2010), and positive annual freshwater flux (defined as evaporation minus precipitation and runo↵) meaning that evaporation prevails on precipitation and runo↵ (0.64 m/yr following Pettenuzzo et al., 2010). The Adriatic Sea is instead a “dilution basin” (Pinardi et al., 2006) with a well marked negative annual heat flux (-33.2 W m 2 following Pettenuzzo et al., 2010), but also a negative annual
freshwater flux (-1.14 m/yr following Artegiani et al., 1997 a-b). The sign of the freshwater flux of the Adriatic basin is due to river runo↵ since evaporation and precipitation tend to balance each other on annual basis.
This work focuses on the Central Mediterranean Sea, which is composed of the Adriatic Sea in its northernmost extension and the Ionian Sea in its southern part, communicating each other at the Otranto Strait. We point out the Central Mediterranean Sea is one of the few Mediterranean areas where river runo↵ is im-portant for the coastal as well as the open sea overturning circulation. As far as we know, there are few evidences in the literature of river e↵ects on on the basin wide overturning circulation. Only Rahmstorf (1995) speculates an increasing freshwater inflow in the Northern Atlantic is potentially able to reduce or even shut down the local overturning circulation. Previously Skliris et al., 2007 and Somot et al., 2006 pointed out river role on the dense water formation processes of the Mediterranean basin. Spall (2012) demonstrates that, in marginal sea
areas as the Adriatic Sea, an increase in surface freshwater gain (due to both pre-cipitation and runo↵) can lead to a shutdown of water sinking and dense water formation, and the marginal sea Meridional Overturning Circulation may switch from anti-estuarine to estuarine mode.
River role on the Central Mediterranean Meridional Overturning Circulation, ex-pecially on its downwelling branch in the Adriatic Sea, is here presented for the first time.
1.2
Structure of the Regions Of Freshwater
Influence
Several theoretical as well as modeling studies (Simpson et al, 1993; Kourafalou et al, 1996; Kourafalou, 1999; Schiller and Kourafalou, 2010) pointed out the freshwater discharge radically a↵ects the shelf areas adjacent to the estuaries, the so called Regions of Freshwater Influence (ROFIs).
A ROFI system experiences a physical regime that is radically di↵erent from the other parts of the shelf sea, where the wind stress, the surface heating-cooling and the tidal currents represent the predominant mechanisms of the buoyancy budget. Simpson (1993) and Garvine(1999) among the others have shown that the input of freshwater in a coastal area generates baroclinic dynamics. This means that river discharge creates its own local circulation: the freshwater inflow spreads o↵shore of the river mouth and promotes the water column stratifica-tion and the local overturning circulastratifica-tion (Chapman and Beardsley 1989).The resulting dynamical structure in the coastal region is the so called ‘buoyant river plume’ which consists of an o↵shore bulge turning anticyclonically plus a coastal alongshore current due to the geostrophic adjustment.
The o↵shore expansion of the buoyant river inflow into the continental shelf has been widely investigated in the literature: Yankovsky and Chapman (1997) cate-gorized river plumes as ‘surface advected plumes’ and ‘bottom advected plumes’ based on the properties of the estuarine outflowing water: the outlet width, the 12
outlet depth, the velocity and density of the river discharge. The surface advected plume (Figure 4.3) develops when inflowing water remains on the top layer of the shelf area with the ambient dense water below. It spreads mainly radially and re-sults in an o↵shore cyclostrophic bulge which is attached to the estuary and turns anticyclonically; a surface along-shore current due to the geostrophic adjustment is also present but very narrow. On the other hand, the bottom advected plume (Figure 4.4) is tipically established when the buoyant inflow occupies the entire water column into a depth greater than the outlet depth and its o↵shore trans-port is controlled by the advection in the frictional bottom boundary layer. The related coastal current remains in contact with the bottom while moving o↵shore, with the density front extending from the surface to the bottom. Generally high density di↵erence between the plume and the ambient flow favors the surface ad-vected plume while a bottom adad-vected plume is established if the buoyant inflow shows a high volume transport.
More recent developments (Garvine and Whitney, 2006; Mac Cready 2009; Mac Cready and Geyer, 2010 among the others) focused on understanding which role the salt ocean water entering the estuary plays in the resulting river plume (Fig-ure 1.4). Thus the estuary dynamics started to be investigated jointly with the coastal ocean dynamics and the characteristics of “sharply stratified”, “partially stratified” and “well mixed” estuaries have been pointed out as well as their e↵ects on the resulting river plume. A sharply stratified estuary is generally established when the “flow ratio”, defined as the tidal velocity over the river streamflow ve-locity, is less than 0.1 with a sharp vertical salinity gradient. A partially stratified estuary shows a flow ration between 0.1 and 10 meaning that the tidal flow is comparable with the river flow and a relatively vigorous mixing in the vertical smooths the salinity gradient. A well mixed estuary shows a flow ratio major than 10 and the tidal pumping is so vigorous that the salinity is homogeneous in the vertical and varies in the horizontal (Fischer et al., 1979).
The shape and dynamics of a river plume are also a↵ected by external forcings, mainly wind stress and tides. The predominant role of tides or wind stress on river plume depends on the strength of both wind stress (i.e. wind intensity and direction with respect to surface currents) and tides (i.e. spring or neap tides,
ebb or flood tides) as well as on the relative distance of the plume with respect to the outlet (Chen and MacDonald, 2006). The plume dynamics has been proved to be strongly tidal in the so called “near-field plume” (Jirka et al, 1981), that is immediately out of the river outlet and corresponds to the excursion length of ebb tides. The tidal e↵ect changes during a whole tidal cycle depending on flood or ebb tides: during flood currents the tidal pumping is onshore directed and favors the ocean water entrainment into the estuary and thus the mixing of the water column; during the ebb currents the tidal pumping is o↵shore directed and tends to bring river freshwater seaward, thus increasing the stratification of the water column in the shelf area (Guarnieri et al, 2014). Winds a↵ect the river plume as well: the downwelling winds favour the homogenization of water col-umn and tend to turn the plume into an along-shore current while the upwelling winds promote the water stratification and the o↵shore drift (Chao, S. Y., 1987). The role of wind stress prevails on tides as the buoyant river inflow moves far from the outlet. This area is named “far field plume”, and here the wind mixing removes the increased stratification due to the freshwater discharge and leads to the irreversible turning of river water into shelf water (Mac Cready 2009).
1.3
Numerical modeling the coastal water
cycle
Modeling the spatial and temporal distribution of the water cycle is a challenge because water cycle processes span a wide range of spatial and temporal scales and because many human activities influence the water cycle.
Integrated meteo-hydrological modelling system are essential to improve the rep-resentation of the whole water cycle both on local and large scales pointing to the reconstruction of historical events as well as the short term forecasts of extreme events and the assess of future scenarios.
Most meteorological and climatological models still represent the surface and sub-surface processes of the water cycle in a oversimplified way, by using a “column-only” land surface sub-model and without accounting for the lateral routing of 14
surface and subsurface water flow.
Hydrological modelling got limited success in the past due to the lack of obser-vational datasets and surface and subsurface input data (Nickovic et at., 2010). However during the last decades, the availability of hydrological observations has improved; moreover higher-resolution data on topography, river routing, soil types and land use have become available.
Hydrology modelling covers a huge variety of approaches: from easier methods (i.e. conceptual and parametric models) to more complex wave systems (i.e. kinematic, di↵usive or dynamic wave models).
As far as we know the HYdrology surface runo↵ PROgnostic Model,HYPROM (Nickovic et al., 2010), is currently the only hydrological modeling system with fully prognostic equations for overland water flow but it doesn’t represent the sub-surface physical processes as the groundwater drainage, the saturated subsub-surface water flow and the aquifer water storage. In this study we use the WRF-Hydro system (Gochis et al., 2013) which is based on the di↵usive wave approximation for representing both the overland water flow and the river streamflow. Moreover it solves the subsurface soil physics and is 2-way coupled with NOAH-MP (Niu et al., 2011) land surface model.
The quality of meteo-hydrological modelling is a demanding issue. Precipita-tion forecasting is still one of the most critical task for meteorological mesoscale models since the precipitation field is the end result of many multi-scales pro-cesses interacting each other and is sensitive to topography, soil types and land use conditions. Moreover the grid spacing of mesoscale models is in the range of ”gray-zone” (Moeng et al., 2007; Shin et al., 2013) resolutions for convection, where the power spectrum of the turbulence reaches its peak and thus the con-vective motions and the precipitation are only partially resolved.
The quality of meteorological modelling is critical for ensuring the quality of hydrological modelling as the uncertainties associated with the meteorological simulations propagate into the hydrological models (Pappenberger et al., 2005). Finally the hydrological models rely on many parameterised processes with tun-able coefficients requiring a calibration procedure.
Several advances have been achieved in the coupling between hydrology and
mosphere models or between ocean and atmosphere models, while the link of hydrological and ocean models is still poorly investigated and the ocean models treat the river discharge in a simplified way for both short term predictions and long term scenarios (e.g. climatological discharge and zero or constant salinity at river mouths).
Moreover literature shows several modelling studies dealing with ROFI’s regime and river water turning into shelf water, while only few studies have started to explore the salt ocean water entrainment into the estuarine areas and how this conditions and perhaps drive the net freshwater release at river outlets.
The ocean models neglect the energy and water balance occurring into the es-tuary and the exchange-flow triggered by the ocean water entrainment, which conditions the net freshwater release. Moreover the freshwater release at river outlets is usually parameterises by means of climatological discharge and zero or constant salinity. We pointed out rivers a↵ect the coastal as well as the basin wide circulation and dynamics, thus the performance of regional ocean models is expected to be strongly dependent on a comprehensive and e↵ective representa-tion of the estuary dynamics and the net freshwater release.
On the whole the reliable representation of the streamflow along the river net-work as well as the water exchange at the estuaries are challenging tasks of the numerical modelling and are both assessed in the presented study.
1.4
Objectives and structure of the thesis
The aim of this study is to understand and to assess the e↵ects of river freshwa-ter inflow on the circulation and dynamics of our region of infreshwa-terest, the Central Mediterranean Sea, both on shelf and basin scales, over short-term as well as long-term range.
As far as we know this study provides the first investigation on river role on the Central Mediterranean overturning circulation.
On the same time we point to improve the hindcast/forecast capability of our regional hydrodynamics model both on shelf and basin scales through a consis-tent representation of river inflow into the Central Mediterranean Sea taking not 16
account all the physical processes involved in the local water cycle of specific catchments. An integrated modelling system including the atmosphere, the hy-drology and the estuary dynamics has been set up upstream the regional ocean model at the Ofanto river outlet. The Estuary Box Model developed by the University of Connecticut (UCONN) jointly with the National Centre for the Atmospheric Research (NCAR) Climate Global Division and the University of Washington (UW) has been implemented for the selected case study, the Ofanto river, downstream of the meteo-hydrological chain and upstream of the regional ocean model. The model performance has been evaluated by comparison with a highly simplified approach based on Knudsen’s relation (Knudsen, 1900). Finally we built up an intermediate modelling approach.
The thesis is organised as follows.
Chapter 2 describes a set of twin experiments, which either does or does not ac-count for the river inflow respectively. Rivers are treated as surface point sources of climatological discharge and salinity. The spanned period is from the beginning of 1999 to the end of 2012 and a high resolution marine hydrodynamics model based on Nucleus for European Modeling of the Ocean code, NEMO (Madec et al, 2008), has been set. These experiments aim to point out river role on the estuarine/anti-estuarine character of the Adriatic Sea circulation, the Adriatic Dense Water Formation processes and the Central Mediterranean anti-estuarine meridional overturning circulation developing between the Adriatic basin and the open Ionian Sea. The set-up of the integrated modeling system including the atmosphere, the soil processes and the hydrology/hydraulics is described in Chapter 3. The implemented chain consists of the mesoscale meteorological model WRF-ARW (Skamarock et al., 2008), the land surface model NOAH-MP (Niu et al., 2011) and the hydrological model WRF-HYDRO (Gochis et al., 2013). The strategy we adopted consists of a dynamical downscaling approach moving from the regional scales of the atmospheric modeling to the catchment scales for the hydrology/hydraulics purposes. We chose the Ofanto river catchment and its estuary as a relocatable case study. The Ofanto is a semi-perennial river with a mean annual value at its outlet of about 15 m3s 1, but may significantly
in-crease its runo↵ when heavy rain events occur and eventually floods. Chapter 4
is divided into two parts. First part o↵ers a theoretical discussion on the mod-elling of the estuarine dynamics. Two approaches are tested and compared: the Knudsen’s relation and a steady-state and tidal-cycle averaged 2-layer box model developed by UCONN and NCAR (Garvine and Whitney, 2006). Moreover a new approach is developed and here presented. The second part of Chapter 4 focuses on the coupling of the the estuary dynamics representation with the re-gional ocean model. The added value of representing the water exchange into the estuaries is discussed as well as the capability of the regional ocean model to simulate the resulting buoyant river plume.
An overall summary of the performed work and the conclusions are o↵ered in Chapter 5. The papers written during the PhD project and the talks held at the workshops I joined are listed in an additional section.
Figure 1.1: Fluvial discharge of freshwater to the global coastal ocean. Num-bers are mean annual discharge (km3/yr); the arrows are proportional to these
numbers (from Milliman and Farnsworth, 2013)
Figure 1.2: Schematic of a surface advected plume (from Yankovsky et Chapman, 1997)
Figure 1.3: Schematic of a bottom advected plume (from Yankovsky et Chapman, 1997)
Figure 1.4: Schematic of the components of estuary vertical profile of velocity
2
River e↵ects on the overturning circulation
and dynamics of the Central Mediterranean Sea
Preamble
This chapter is a co-authored paper with N.Pinardi, P. Oddo, S.A. Ciliberti and G.Coppini, entitled “Influence of river runo↵ in the Central Mediterranean Sea basins” and submitted to the Ocean Dynamics.
The role of riverine freshwater inflow in the Central Mediterranean Sea is studied using a high-resolution ocean model with a complete distribution of rivers in the Adriatic and Ionian catchment areas. The impact of river runo↵ on the Adriatic and Ionian Sea basins is assessed by two twin experiments, with and without river inflow, from 1999 to 2012. This study underlines, for the first time, how river dis-charge a↵ects the intensity of the Central Mediterranean Meridional Overturning Circulation (MOC), especially its northern downwelling branch in the Southern Adriatic. It is found that the Central Mediterranean Sea is characterized by a persistent anti-cyclonic, anti-estuarine MOC with secondary estuarine cells that strengthen in years of large river runo↵ due to an enhanced stratification close to the surface and a more stagnant circulation at the bottom. It is found that the Adriatic Sea is dominated by an anti-estuarine dynamics, also when large and anomalous river runo↵ occurs and the resulting buoyancy budget is posi-tive or null. However rivers act on favoring lower kinetic energy circulation of the Adriatic basin and thus weaken the intensity of the antiestuarine MOC. We found rivers strongly reduce the Adriatic dense water formation, not only in the northern sub-region where the major discharge is concentrated, but also in its southern area by modifying the local water stratification. On the whole the Cen-tral Mediterranean MOC is deonstrated to be controlled by wind forcing at least as much as by buoyancy which includes river runo↵.
2.1
Introduction
River discharge is one of the components of the water budget in the Mediterranean basin, together with evaporation, precipitation and the net inflow of freshwater from the Atlantic ocean through the Strait of Gibraltar and from the Black Sea through the Dardanelles Strait. Annual water losses due to evaporation exceed water gains from precipitation and river runo↵ resulting in a positive sur-face freshwater budget, defined as evaporation minus precipitation and runo↵ (i.e.0.64m/yr following Pettenuzzo et al., 2010). Moreover, the net heat bud-get of the basin is negative (Bethoux, 1979; Pettenuzzo et al., 2010), thus the Mediterranean Sea is a “concentration basin”.
The general characteristics of the Mediterranean thermohaline circulation are schematized in Figure 2.1. This circulation is characterized by inter-annual as well as multi-decadal time scales and it is driven by three major conveyor belts: the Zonal Overturning Circulation (ZOC) in the Southern Mediterranean pro-pelled by the Gibraltar stream flow and Levantine Intermediate Water (LIW) formation processes, the Western Mediterranean Meridional Overturning Circu-lation (MOC) originating in the Gulf of Lion, the Central Mediterranean MOC originating in the Adriatic Sea (Figure 2.1). These overturning cells are triggered by buoyancy losses and water mass sinking which occur in the open ocean ar-eas of the Northern Mediterranean Sea and the Levantine sub-basin. Both deep and intermediate waters form in the regions o↵shore the Gulf of Lions, in the Southern Adriatic and in the Northern Levantine Basin, forced by intense winter heat losses and influenced by the presence of large scale permanent cyclonic gyres driven by wind stress curl (Pinardi et al., 2006). The Aegean Sea is marked as another dense water site in Figure 2.1 (red spiral), but Roether et al. (1996) demonstrated it played a relevant role only during the Eastern Mediterranean Transient, EMT, occurred at the end of the eighties and first half of the nineties. Moreover Manca et al. (2003) have found that the Aegean Sea has stopped the production of deep waters after the occurrence of the EMT and that the Adriatic Sea has started to be again the unique site of production of the deep waters for the Eastern Mediterranean sub-basin.
The Central Mediterranean Sea area, composed of the Adriatic Sea in its northern part and the Ionian Sea in its southern extension, is one of the few Mediterranean Sea areas where river runo↵ is important for the coastal as well as the open sea circulation, not only in the Adriatic Sea, where most of discharge is located (i.e. about 1/3 of the whole Mediterranean river discharge following Ludwig et al., 2009), but also in the Ionian Sea because the Adriatic Sea dense waters are one of the major drivers of the Ionian abyssal circulation (Curchitser et al., 2001, Manca et al., 2002). Moreover the Southern Adriatic opean-sea convection rep-resents the downwelling branch which drives the overturning circulation pattern in the Central Mediterranean sub-basin.
As far as we know this is the first study on river influence on the Central Mediter-ranean MOC, similarly to Rahmstorf’s speculation (Rahmstorf, 1995) on fresh-water role on the Northern Atlantic overturning circulation.
Previously Skliris et al., 2007 investigated the impact of reduced discharge of Ebro and Nile rivers on the dense water formation in the Eastern and Western Mediterranean sub-basins and Somot et al., 2006 pointed out river role on the dense water formation processes of the Mediterranean basin in a transient cli-mate change simulation with lower river runo↵. On the other hand the role of freshwater inputs (due to both rivers and precipitations) on the dynamics of a marginal sea, as the Adriatic basin, has been widely investigated in the litera-ture. Spall (2012) demonstrates that, in marginal sea areas, an increase in surface freshwater gain can lead to a shutdown of dense water formation and sinking, and the marginal sea Meridional Overturning Circulation (MOC) switches from anti-estuarine to anti-estuarine mode. Recently, Cessi et al. (2014) established that the estuarine/anti-estuarine character of a semi-enclosed sea with a two-layer flow at the strait is determined by both wind and buoyancy forcings. The wind forcing is normally a source of mechanical energy for the circulation, while the buoyancy forcing could be either an energy source or a sink depending on the sign of the net buoyancy flux at the surface. For estuarine basins, such as the Baltic and Black Sea, the positive buoyancy flux (dominated by precipitation and runo↵ exceeding evaporation), is a net energy sink for the circulation, thus producing a less vigorous meridional circulation than in the anti-estuarine basins.
The Adriatic Sea is a “dilution basin” with a negative annual freshwater bud-get of about 1myr 1 (Artegiani et al., 1997), mainly due to river runo↵ and a
negative annual heat budget. The buoyancy flux, which is a combination of the net heat and freshwater fluxes, could eventually be positive, thus determining a net sink in energy and possibly a net estuarine character of the circulation. Pinardi et al. (2006) show that, due to river runo↵, the Adriatic Sea could be characterized by zero net buoyancy flux, thus producing a basin where the cir-culation is mainly powered by the wind stress. However, the energetics proposed by Cessi et al. (2014) cannot be applied satisfactorily to the Adriatic Sea, since the flow at Otranto is not just a two-layer flow. Thus, a comprehensive analy-sis of surface buoyancy and meridional transport is needed to fully establish the estuarine/anti-estuarine character of the Adriatic Sea circulation.
In order to evaluate the Central Mediterranean MOC we need to characterize the Adriatic Sea circulation and its forcings since the MOC downwelling branch starts there. Having a large freshwater budget, which makes the Adriatic basin a dilution basin as explained above, it is key to study the influence of runo↵ on the Adriatic Sea overturning circulation and its possible e↵ects on the MOC. Two main questions are addressed by the present paper: is the Adriatic Sea an estuarine or anti-estuarine basin in a realistic runo↵ regime? How is the Cen-tral Mediterranean MOC a↵ected by rivers? Related issues regarding how rivers a↵ect the formation processes of Adriatic dense waters and their spread toward the Ionian Sea are also addressed.
In order to answer these questions, a high resolution general circulation model was set up, forced by realistic fluxes of water, heat and momentum. The impact of freshwater inflow on the circulation is assessed by studying a twin experiment based on a mechanistic approach: the full dynamics case is close to reality (EXP1) so that taking out just the rivers (EXP2) we can estimate their theoretical e↵ect on the circulation.
The paper is organized as follows. Section 2 outlines the experimental design, and details the parameterization of the rivers as surface boundary conditions and the validation of the model performance. Sections 3 to 6 describe the experiments highlighting the role of the river runo↵ forcing. A summary and conclusions are
presented in the last section.
2.2
Experimental design
2.2.1
Model configuration and twin-experiment set-up
The numerical model used is the Nucleus for European Modelling of the Ocean (NEMO) in its latest version (Madec, 2008). It is a three-dimensional finite di↵er-ence numerical model adopting the Boussinesq and hydrostatic approximations. The area covered by the model grid is the Central Mediterranean Sea from 12.2 E to 21.0 E and 30.2 N to 45.8 N with a horizontal resolution of about 2.2 km (2.5 km in the meridional direction and 1.7 to 2.2 km in the zonal direction).
Figure 2.2 shows the bathymetry of the domain, river mouth grid points and the three sub-regions into which the Adriatic Sea is conventionally subdivided on the basis of its bottom morphology: the Northern (NAd), the Middle (MAd) and the Southern Adriatic (SAd). The connection with the Ionian Sea occurs at the Otranto Strait where the sill is 800m deep, located at approximately 40 N . Two twin experiments were performed, with and without river discharge, span-ning the period from 1 Jan 1999 to 31 Dec 2012. The time series of the kinetic energy integrated over the basin volume show the model spin up period consists of the first few months of 1999, thus the whole 1999 is assumed to represent the model spin-up and results for this year are not shown.
We later refer to the two simulations, with and without river discharge respec-tively, as Experiment 1 (EXP1) and Experiment 2 (EXP2).
It’s worth stressing that the conceptual paradigm of the paper is to explain the role of river inflow but not to fully reproduce reality. To do this, we adopt a mechanistic approach: the full dynamics case (EXP1) is close to reality so that if we take out just the rivers (EXP2) we can estimate their theoretical e↵ect on the circulation.
To note that this study o↵ers the first implementation of NEMO code over the Central Mediterranean Sea area, with even a complete representation of almost
all the rivers flowing into the Central Mediterranean Sea. In this work the re-gional model is forced by a 1/16 resolution dynamical downscaling of the daily analysis of the operational Mediterranean forecasting System, MFS (Tonani et al., 2008; Pinardi and Coppini, 2010) which is based on the same NEMO engine and covers the entire Mediterranean basin.
We found out a tuning procedure is required in order to optimize the horizontal eddy viscosity and di↵usion coefficients of our model, starting from the constant values customized for MFS configuration and considering that both models use a biharmonic operator for the horizontal mixing terms but horizontal resolutions are in the ratio 1:3.
A further di↵erence with the mother model MFS is that TKE turbulence closure scheme is used (Mellor and Blumberg, 2004) for computing the vertical eddy viscosity and di↵usivity coefficients instead of using a local Richardson number dependent formulation (Pacanowski and Philander, 1981).
All the details on the numerical model configuration are given in Appendix A.
2.2.2
River runo↵ parameterization and datasets
River runo↵ into the Mediterranean Sea is mainly concentrated in the Central Mediterranean sub-basin, whit rivers flowing into the Adriatic Sea providing al-most 1/3 of the total (Struglia et al., 2004; Ludwig et al., 2009). Furthermore a strong damming occurred within the last 50 years in the Eastern and Western sub-basins involving their major freshwater sources. After the construction of the Aswan Dam in 1964, the runo↵ of the Nile, the river with the largest water load and drainage basin in the Mediterranean until the early sixties, was drastically reduced (by more than 90%, from 2700 m3s 1 to 150 m3s 1), a↵ecting the salt
budget of the basin. The runo↵ of the Ebro River, one of the major rivers drain-ing into the Western Mediterranean Basin, was also abruptly reduced (by more than 60%, from 1500 m3s 1 to 400 m3s 1 ) due to damming in the early sixties.
Finally the control of the Russian rivers draining into the Black Sea started in the fifties with the runo↵ decrease reaching about 60 km3/yr at the mid-nineties
Thus currently the only major runo↵ sources located out of the Central Mediterra-nena Sea are the Rhone and the Ebro rivers flowing into the Western sub-basin. The freshwater discharge into the Central Mediterranean Sea is almost totally concentrated along the Adriatic coastlines: the Po river is the main freshwater source of the Central Mediterranean Sea and accounts for almost 30% of the Adriatic annual discharge (Cushman-Roisin et al., 2002). Besides the Po, other significant freshwater inputs are the Buna/Bojana, Vjose and Neretva along the Eastern Adriatic coast, and the Adige and Isonzo along the northern Italian coast. Moreover the Mediterranea Sea counts on a great number of very small rivers (Milliman, 2001), owing to strong topographic relief favouring the forma-tion of small watersheds.
This study provides the first numerical representation of all the rivers draining into the Central Mediterranena Sea, there are 67 Adriatic and Ionian rivers in total, 52 flowing into the Adriatic Sea and 15 into the Ionian Sea. Model rivers are parameterized as “surface sources” of runo↵ and salinity at the estuary grid points while no temperature information is prescribed. Our assumption of no temperature di↵erences between river inflow and shelf sea is generally valid as river plumes are controlled by the salinity gradient.
To note that all the other major rivers flowing into the Western and Eastern sub-basins (i.e. the Ebro, Nile and Rhone rivers) are parameterizes as monthly climatologies of runo↵ and salinity in the mother model MFS; the net inflow at Dardanelles Strait is also parameterized as a river with monthly climatological runo↵ and salinity values taken from Kourafalou and Barbopoulos (2003). Moreover sensitivity tests carried out with MFS mother model in the shelf areas close to river outlets suggest to set salinity values equal to 15 psu for all rivers, except 17psu for the Po river due to the extensive tidal mixing occurring in the Po delta. We maintain the same choice in our model configuration. Discharge values consist of monthly climatologies for all the parameterized rivers, except daily observations for the Po river.
Monthly climatologies are applied in the middle of each month after a prelim-inar correction following the Killworth’s procedure (1996), which produces new monthly “pseudo-values” and preserves the original monthly values when linear
daily interpolation is applied.
The Po river data, which are not climatologies but daily averages based on ARPA EMR 30 minute observations at the Pontelagoscuro station, are unequally divided into nine grid points representing the nine branches of the delta (Po di Goro, Po di Gnocca, Po di Tolle, Po di Bastimento, Po di Scirocco, Po di Bonifazi, Po di Dritta, Po di Tramontana, Po di Maistra) according to percentages in Provini et al. (1992). It is worthy to highlight that the observational dataset of the Po river is the only one available over the simulation period, but working at least with the daily observations of the Po river enabled us to capture most of the interannual variability of the riverine freshwater release in the Central Mediterranean Sea, being mainly due to the Po river. Moreover, as mentioned before, we point to explain the theoretical role of a realistic river inflow but not to fully reproduce reality, thus any weaknesses of our numerical set up and data choice don?t im-pact our speculation that focuses on the di↵erences we found out by means of a mechanistic approach.
We parameterize river outlets as surface sources of runo↵ and salinity and we use a “natural boundary condition” (Huang, 1993), plus ad-hoc salt values prescribed at river mouths. Most of previous modeling studies represented river discharge in the Mediterranean Sea by means of the “virtual salt flux boundary condition” as Somot et al, 2006 while Kourafalou, 1996, Skliris et al., 2007 and Vervatis et al., 2013 adopted the so called “natural boundary condition”. The virtual salt flux formulation or “mixed boundary condition” (Bryan, 1986) prescribes freshwater flux as additional salt flux added to the salt flux boundary condition allowing the concentration-dilution e↵ect to be represented. This is the approach gener-ally assumed in the ocean general circulation models with rigid lid hypothesis, eventually jointly with a restored sea surface salinity.
The natural boundary condition (Huang, 1993) prescribes freshwater flux as a volume surplus of zero-salinity water, modeled as a correction to the model’s top sigma layer vertical velocity at the grid points covering the source locations. Thus a real freshwater flux is specified as the vertical velocity boundary condition for the continuity equation while the salt flux through the surface is set equal to zero. Kourafalou, 1996 was the first to extend the natural boundary condition
to the riverine freshwater flux. Moreover Beron-Vera et al. (1999) introduces a complementary non-zero salt flux at river outlets through ad-hoc salt values in the salt flux boundary condition. Indeed in this model we use the natural boundary condition for vertical velocity and a complementary non-zero salt flux. The surface boundary condition for vertical velocity reads:
w|z=⌘
@⌘
@t + (u, v)|z=⌘ · 5H ⌘ = (E P R
A) (2.1)
where w is the vertical velocity, ⌘ is the sea surface height, E is the evaporation rate (ms 1) computed from the latent heat flux (see eq.(A.14) in Appendix A)
and thus function of the ECMWF atmospheric data with 6h frequency, P is the precipitation rate (ms 1) coming from CMAP (CPC, Climate Prediction Center,
Merged Analysis of Precipitation) monthly climatologies, R indicates the river runo↵ (m3s 1) we provide at the grid points representing the outlets and A stands
for the river mouth cell areas. Further details and the complete description of the numerical set up are provided in Appendix A.
The complementary salt flux boundary condition is also: Kt
@S
@z |z=⌘= Sz=⌘(E P R
A) (2.2)
where Ktis the vertical mixing coefficient for tracers and Sz=⌘is the ocean model
surface salinity except prescribed ad-hoc salt values at river mouths.
To note the inter-annual variability of the surface water (and consequently salin-ity) flux through the surface boundary conditions written above is driven only by variation in the evaporation flux and in Po river regimes. This is a lack of our configuration since the interannual variability of the freshwater gains of the Mediterranean basin is only due to the Po river regime and doesn’t account for the precipitation variations and the other rivers regime. However there are no consequences on our theoretical purpose that is to assess how rivers a↵ect the basin dynamics just including or not their parameterization in the model set up. Daily time series of total discharge in the model domain during the simulation period (1 Jan 1999 to 31 Dec 2012), are shown in the top panel of Figure 2.3, while the Po’s daily discharge is displayed in the bottom panel. According to our discharge data, the annual average runo↵ rate in the Central Mediterranean
Sea is equal to 4.72· 103m3s 1, 29.7% coming from the river Po. Moreover 94.6%
due to the Adriatic rivers, and 5.4% to the Ionian rivers. Maximum values of the total daily discharge were observed in autumn 2000, autumn 2002, and autumn 2008-winter 2009. Annual mean peaks took place in 2000 (5.28· 103m3s 1), 2002
(5.19· 103m3s 1), 2009 (5.37· 103m3s 1), and 2010 (5.26· 103m3s 1).
Table 2.1 lists the adopted climatological datasets for river runo↵, the time range for computing the monthly climatologies and the annual mean discharges as use-ful reference values.
Most of the datasets consist of observations taken at the hydrometric stations nearest to river mouths, and few of them are estimated values. Time series for the various rivers cover di↵erent periods. However, the time series of the major rivers, accounting for the most of the Central Mediterranean discharge, overlap for at least 20 yr.
All river mouths are “point sources” except for 2: Marecchia to Tronto rivers (Tronto excluded) in the Marche region and Vibrata to Fortore rivers (Fortore excluded) in the Abruzzo and Molise regions which are “di↵used sources” and thus, were split among several grid points. These di↵used sources and the rivers in Puglia are the only rivers of the model based on Raicich’s (1996) climatologies (see Figure 2.2).
The estimated discharge into the plain between the Po and the Marecchia was di-vided between eight sources: Po di Volano, Reno, Lamone, Fiumi Uniti, Bevano, Savio, Rubicone, and Uso. The Bacchiglione and Agno-Gu rivers flow into the Brenta river before reaching the sea, thus their runo↵ was not considered. The plain between the Brenta and the Piave corresponds to the hydrographic basin ending in the “Venice Lagoon”, thus the monthly flow was divided among the three main lagoon outlets: Porto di Chioggia, Porto di Malamocco, and Porto di Lido. In the plain between the Piave and the Tagliamento, the outflow was divided among 4 main rivers: Livenza, Sile, Canale Nicessolo and Canale dei Lovi. The plain between the Tagliamento and the Isonzo (Malacic and Petelin, 2009) is characterised by the rivers draining into the “Marano Lagoon”. The estimated outflow of the plain rivers was divided among the main lagoon outlets: Porto di Lignano, Zellina, Porto Buso, Canale di Morgo, La Fusa, and Bocca
di Primero. (Simoncelli et al, 2011). M. Pasaric et al., (2004) analyzed a time series of monthly mean river discharges along the Croatian coast and calculated the mean annual cycle of eleven rivers: Mirna, Rasa, Rjecina, Dubracina, Zr-manja, Krka, Jadro, Zrnovnica, Cetina, Neretva, and Ombla. According to the Albanian Hydrometeorological Institute, the main Albanian rivers discharging into the Adriatic Sea are: Buna-Bojana (into which the Drin river discharges as a consequence of landslides during the 19th century and the construction of hy-dropower plants along the river path), Mati, Ishmi, Erzeni, Shkumbini, Semani and Vjosa. Two other Albanian rivers, the Bistrica and Pavla, discharge into the Ionian Sea. Two Greek rivers discharging into the Ionian Sea, the Thyamis and Arachtos, were extracted from Global Runo↵ Data Centre, GRDC, datasets. Finally eleven Italian rivers discharging into the Ionian Sea were provided by several institutions (i.e. ARPAs, CNR IRPI, GRDC, and the Autorit di Bacino Basilicata).
2.2.3
Model validation with observations
The performance of the model was evaluated by comparing simulated fields with available in situ and satellite observations. We propose a comparison with tem-perature and salinity profiles collected by means of two Argo profiling floats for the last three years of the simulation. Figure 2.4 shows the trajectories of the Argo floats in the Adriatic and Northern Ionian Sea, respectively. Figure 2.5 shows vertical mean profiles of RMSE and BIAS for temperature and salinity. On the whole, the EXP1 model output is in good agreement with the observed data, comparable RMSE and BIAS values were found for another, recent model of the Adriatic Sea (Guarnieri et al., 2013). In EXP2 without rivers, water masses in the Adriatic Sea appear saltier and warmer with respect to the observed dataset. Comparing observations with EXP2, RMSE and BIAS values were double those in EXP1, thus showing the impact of river runo↵ on the correct reproduction of the basin water mass characteristics. Analysed and modelled sea surface tem-peratures are shown in Figure 2.6. Analysed SST are obtained by Optimal In-terpolation of SST measurements from daily AVHRR Pathfinder dataset. The
agreement between the modeled and observed datasets is high. The full dynamics Experiment, EXP1, fits Satellite SST better that EXP2: EXP1 RM SE = 0.78 C and EXP2 RM SE = 0.81 C.
2.3
Is the Adriatic Sea an estuarine or
anti-estuarine basin?
Traditionally, estuarine and anti-estuarine circulation has been classified on the basis of the net water flux at the surface only (Sverdrup, 1947; Pickard and Emery, 1990). Estuarine and anti-estuarine circulation is also linked to the cyclonic and anti-cyclonic overturning circulation which connects the marginal sea to the open ocean. Spall (2011, 2012) analysed a marginal sea overturning circulation pre-dicting that the freshwater input could stop the anti-estuarine circulation and the anti-cyclonic MOC. Rahmstorf (1995) speculates that increasing freshwater inflow in the Northern Atlantic may potentially reduce or even shut down the overturning circulation. Cessi et al. (2014) show that both buoyancy forcing and wind stress work are connected to the strength of the circulation and thus, also to the MOC developing between the marginal sea and the open ocean.
Following Spall (2012) we assessed the non-dimensional thermal forcing parame-ter, µ/✏, and freshwater forcing parameparame-ter, /✏. The former describes the relative balance between heat budget in the interior basin and the lateral eddy fluxes that advect warm water into the basin and the latter describes the relative balance between freshwater budget in the interior basin and the lateral eddy fluxes ad-vecting salty water. The lateral eddy fluxes detach from the cyclonic boundary current which comes from the open ocean and encircles the marginal sea. Small values of these parameters with eventually negative values of the freshwater pa-rameter, indicate the lateral eddy fluxes prevail on the surface cooling of the interior basin due to the atmospheric forcing and may trigger the shutdown of deep convection.
We computed the two parameters over the whole simulation period and discovered that the thermal parameter is essentially the same in both experiments, 5· 10 5
in EXP2 and 4.9· 10 5 in EXP1, while the freshwater parameter is 7· 10 4 in
EXP2 and 2· 10 2 in EXP1 (see Appendix B for details on the computation of
Spall’s coefficients). This means that the Adriatic Sea runo↵ has the potential to shut down the deep convection.
Spall (2012) also shows that the ratio4S/4T , where 4T and 4S are the model-diagnosed temperature and salinity non-dimensional anomalies between the inte-rior basin and the boundary current, can be written as a function of the thermal and freshwater forcing parameters (see Appendix B for details on the compu-tation of these values). A ratio 4S/4T less than 1 means that the general circulation is in “thermal mode”, which means the heat and freshwater balance in the interior basin oppose the lateral eddy fluxes and thus the deep convection is sustained by surface cyclonic boundary current and anti-cyclonic MOC. A ratio 4S/4T > 1 indicates the “haline mode” of the marginal sea circulation with heat and freshwater balance of the interior basin favoring a cold and freshwater interior opposing the lateral eddy fluxes. This implies the shut down of deep convection and inversion of the MOC. The collapse of deep convection is demon-strated to be possible also in the thermal mode case if 4S/4T > 0.5.
We obtain4T = 0.35 and 4S = 0.10 in EXP1, while 4T = 0.28 and 4S = 0.03 in EXP2. These values give a ratio4S/4T = 0.28 and 0.12 in EXP1 and EXP2, respectively. Thus the Adriatic Sea is characterized by an anti-estuarine circula-tion with thermally driven deep water formacircula-tion processes despite a large runo↵ budget. Even if we focus only on the year 2002, which was characterized by one of the largest river runo↵s (Fig.2.3), 4S/4T = 0.42 in EXP1 and 0.29 in EXP2, meaning that the Adriatic deep water formation and the anti-estuarine circula-tion characterize both experiments with and without river runo↵, but in EXP1 we found 4S/4T closer to 0.5. Thus a strong river runo↵ has the potential to shutdown deep convection and reverse the overturning circulation of the marginal sea.
In order to further assess river influences on the MOC, an analysis of both buoy-ancy and wind stress forcing was performed. The surface buoybuoy-ancy flux per unit
area, (m2s 3), is expressed according to Cessi et al. (2014) as follows: Qb = g↵T ⇢0wCw Q ↵SS0g(E P R A) (2.3)
where ↵T,S are the coefficients of thermal and haline expansion respectively,
⇢0w is the reference sea surface water density, Q is the net heat flux, Cw is the
heat capacity of sea water, S0 is the surface salinity. Finally, (E P R/A) is the
freshwater flux with evaporation rate, E, and precipitation rate, P, in ms 1, river
discharge, R in m3s 1, and A representing the grid area of river mouths (m2).
Furthermore the following values were assumed: ↵T = 2.3· 10 4 C 1, ↵S =
7.5· 10 4psu 1, C
W = 3990Jkg 1 C 1, S0 = 38.7psu and ⇢0w = 1029kgm 3.
The net heat flux, Q, components are computed according to bulk formulae de-scribed in Appendix A.
First, we analyse the impact of R in the water flux contained in eq.2.3. Figure 2.7 shows the seasonal time series of the surface freshwater budget, (E-P-R/A), both for the whole computational domain (the Central Mediterranean Sea) and for the Adriatic Sea alone. We followed Artegiani et al. (1997) definition of a season: winter is from January to April, spring is May and June, summer from July to October, autumn corresponds to November and December. The whole Central Mediterranean Sea has a positive freshwater budget, 0.60 myr 1, while it
is negative over the Adriatic Sea, -0.69 myr 1. Indeed our results highlight that
the Central Mediterranean Sea is a concentration basin, while the Adriatic Sea is a dilution basin with river discharge playing a crucial role in the freshwater budget.
An annual time series of Adriatic surface buoyancy flux and wind work is shown in Figure 2.8. The realistic buoyancy flux (EXP1) is generally negative, imply-ing a net anti-estuarine forcimply-ing of the circulation, however in certain years, the values can be several times smaller in absolute value than other years, and even change sign. This is the case for 2000, 2002 and 2008 where the buoyancy flux reached small or positive values. The small or positive buoyancy budget could weaken the anti-estuarine MOC in certain years, as we will see later. To note that 2001 to 2003 are the years characterized by the most relevant river role with respect to the other forcing mechanisms of the circulation (see green pointed line
in Fig.2.8), this is consistent with the lowest surface heat losses (not shown) and the minimum dense water volumes we found in these years (see Fig.2.11), in good agreement with findings of previous studies (Oddo and Guarnieri, 2011; Gunduz et al., 2013, Pinardi et al., 2015).
The wind work (m3s 3) is defined as ⌧w·us
⇢0 , where us is the sea surface velocity,
⇢0 is the reference sea surface water density and ⌧w is the wind stress defined
in Appendix A. In order to compare the wind work with the buoyancy flux, the wind work has been normalized by the basin volume.
Figure 2.8 shows that the wind work is always positive (10 8 m2s 3), implying a
net source of mechanical energy for the Adriatic Sea and it is one order of magni-tude larger than the buoyancy flux (10 9 m2s 3) in the realistic experiment with
rivers. Thus considering the two major forcings of the circulation, the Adriatic Sea results again to be an anti-estuarine basin characterized by a large wind work energy source.
The buoyancy flux of the Adriatic Sea represent an energy sink if positive, and thus tends to counterbalance the energy source due to wind work giving rise to a low kinetic energy basin circulation. This is consistent with the weaker anti-estuarine MOC and the more stagnant circulation below the Otranto sill depth (both in SAd Pit and Ionian abyss) we found out in EXP1, especially in 2002, as detailed in the next section.
2.4
How is the intensity of Central
Mediterranean MOC a↵ected by runo↵ ?
In order to better quantify the river influence on the Central Mediterranean MOC, an inter-annual analysis of the meridional transport stream function was carried out. The literature contains ample evidence that the ocean MOC is primar-ily driven by wind and tidal stirring (Munk et al., 1998; Paparella et al., 2002; Marshall et al., 2012). In addition, the relationship between the dense water formation, driven by the buoyancy flux, and the strength of the overturning cir-culation has been highlighted in several theoretical, as well as realistic modelling
studies (Rahmstorf, 1995; Rahmstorf, 1996; Pisacane et al., 2006). Similarly, here we focus on the downwelling branch of the Central Mediterranean MOC, which develops inside the Southern Adriatic sub-basin due to the local open-ocean convection and dense water formation sustained by winter heat losses and a permanent cyclonic gyres driven by wind stress curl.
The meridional transport stream-function, , is defined as (Pedlosky, 1987): (y, z) = Z x1 x0 Z z H v(x, y, z)dxdz (2.4)
with H < z < 0 as the depth, x0 and x1 the more eastern and more western sea
points, v is the time-averaged meridional velocity. The velocity field is tangent to the isopleths of , and positive values indicate anti-estuarine cells turning anti-cyclonically, while negative values indicate estuarine cells turning cycloni-cally.
Figure 2.9 shows the transport stream-function for EXP1 and EXP2, averaged over the whole simulation period. A large anti-estuarine cell down to a 700-800 m depth is detected in both experiments in the Northern Ionian Sea and SAd sub-region, but with di↵erent intensities. Interestingly enough many estuarine cells exists in the domain: one at the surface in the NAd, one in the deep layers of the Southern Adriatic Pit around 41-42 N , SAP, another in the Middle Adri-atic Pit around 43 N , MAP, and the last in the Northern Ionian abyss.
Fig.2.9 demonstrates that, even with a realistic representation of the river runo↵, the anti-estuarine character of the Central Mediterranean MOC is maintained. Indeed, in EXP1, the secondary estuarine cells of the NAd, MAd, SAd sub-regions and Northern Ionian basin are larger than in EXP2, however the anti-estuarine MOC cell still dominates.
The estuarine component of the MOC may become more evident on a seasonal basis, particularly during summer. Figure 2.10 focuses on summer 2002 and summer 2009 because these years had the largest river discharge (Fig. 2.3). In summer 2009 (Fig. 2.10 bottom panels), a well-defined surface estuarine cell characterizes the whole meridional extension of the basin with no di↵erences be-tween EXP1 and EXP2, which means that the wind forcing becomes a dominant contribution to the estuarine secondary cells. During this season the wind work is
maximum (Fig. 2.8 bottom panel) but the buoyancy flux is still negative (Fig.2.8 top panel) thus maintaining an anti-estuarine MOC in the Adriatic Sea. In sum-mer 2002 (Fig. 2.10 top panels), the river influence is more significant probably due to the weaker wind forcing and the positive buoyancy forcing. In EXP1 the anti-estuarine character of the MOC is weak and restricted to 200-400 m depths, while the secondary estuarine cells are stronger. However even in this case the dominant overturning circulation is still anti-estuarine, in agreement with the Spall‘s (2012) freshwater and thermal forcing parameters predictions.
We conclude that the Central Mediterranean anti-estuarine MOC is a stable con-figuration of the local meridional overtuning circulation driven by winds and by highly variable buoyancy forcings. River runo↵ can a↵ect MOC strength, thus enhancing the amplitude of the secondary estuarine cells and reducing the in-tensity of the large anti-estuarine cell but the anti-estuarine MOC remains the largest overturning, anti-estuarine structure of the Central Mediterranean Sea.
2.5
How do rivers influence the formation of
dense water in the Adriatic Sea?
The aim here is to establish how rivers impact the dense water formation pro-cesses in the Southern Adriatic Sea and thus impact the MOC.
Figure 2.11 shows the dense water volume formed in the SAd computed as the water volume with larger potential density anomaly than the threshold value, 29.2 kgm 3. EXP1 results are in agreement with previous model findings (Oddo
and Guarnieri, 2011; Gunduz et al., 2013, Pinardi et al., 2015). The greatest dense water volume was formed in 2006 and 2012, while minimum dense water volumes were found in 2001 to 2003 owing to a relative high buoyancy flux (with the concomitant e↵ect of strong river runo↵ and weak heat losses) and low wind work.. The dense water rate ranges from 0.03 Sv in 2001 to 1.53 Sv in 2006 and the mean annual SAd dense water rate is 0.3 Sv, a value corresponding to several previous studies (Artegiani et al., 1989 and 1997; Lascaratos, 1993;