Alma Mater Studiorum
Università degli Studi di Bologna
Dottorato di Ricerca in
Sanità Pubblica e Medicina del Lavoro XX ciclo
Settore Scientifico Disciplinare: CHIM/01
MASS SPECTROMETRY-BASED PROTEIN PROFILING
STRATEGIES FOR BIOMARKER DISCOVERY IN LIVER
AND INFLAMMATORY BOWEL DISEASES
Tesi di Dottorato di:
Relatore:
PAOLO NANNI Chiar.mo Prof. ALDO RODA
Coordinatore:
Chiar.mo Prof. MARIA PIA FANTINI
CONTENTS
Abbreviations 4
Introduction 6
Chapter 1: 7
1.1 The complexity of biological samples 7
1.2 Protein profiling strategies 8
1.2.1 Gel-based protein profiling 9
1.2.2 Gel-free protein profiling 9
1.3 Mass spectrometry soft ionization techniques and analysers 10
1.3.1 Soft ionization techniques 11
1.3.1.1 MALDI 11
1.3.1.2 ESI 12
1.3.2 Mass analysers 13
1.3.2.1 Quadrupole 14
1.3.2.2 Time-of-Flight 14
1.3.2.3 Tandem and hybrid analysers 15
1.4 Mass spectrometry analysis of complex protein/peptides mixtures 17 1.5 Chemometric and bioinformatic tools for proteomic data analysis 18
1.5.1 Parvus 18
1.5.2 MsInspect 19
1.5.3 Proteios 19
1.6 Liver and inflammatory bowel diseases: ethiopathogenesis and existing
biomarkers 20
1.6.1 Inflammatory bowel diseases (IBDs) 20
1.6.2 Liver diseases 21
Chapter 2: serum protein profiling by solid-phase bulk extraction
MALDI-TOF MS and chemometric data analysis 23
2.1 Introduction 25
2.2 Experimental 26
2.2.3 Sample preparation 27
2.2.4 Mass spectrometry 28
2.2.5 Data pre-processing 29
2.2.6 Statistical analysis 30
2.3 Results and discussion 30
2.3.1 Inflammatory bowel diseases 34
2.3.1.1 Preliminary study 34
2.3.1.2 C18 solid-phase bulk extraction 36
2.3.2 Liver diseases 40
2.3.3 Protein profiles specificity 42
2.4 Conclusions 43
Chapter 3: Label-free liquid chromatography electrospray ionization- quadrupole/Time-of-Flight mass spectrometry differential analysis of
protein profiles 45
3.1 Introduction 45
3.2 Experimental 46
3.2.1 Material and reagents 46
3.2.2 Serum 46
3.2.2.1 Serum sample 46
3.2.2.2 Low molecular weight serum proteins enrichment 47
3.2.3 Cells 47
3.2.3.1 Cell line 47
3.2.3.2 Isolation of human intestinal epithelial cells 47 3.2.3.3 Protein extraction from subcellular fractions 48
3.2.3.4 Monodimensional gel electrophoresis 48
3.2.3.5 Western Blot analysis of IECs and HT29 cell lines 49
3.3.3 Liquid chromatography and mass spectrometry 49
3.3.3.1 LMW serum proteins 49
3.3.3.2 Cell proteins 50
3.3.3.3 MS data analysis and include list 50
3.3.3.4 Feature peptide identification 51
3.3 Results and discussion 52
3.3.1 Serum protein profiling in IBD by LC ESI-QTOF MS
3.3.2 Protein profiling in HT29 cell lines and intestinal epithelial cells 60
3.4 Conclusions 66
General conclusions 68
References 70
Abbreviations
1D/2D -PAGE Mono/bidimensional electrophoresis
CD Crohn’s disease
CID Collision induced dissociation
CIR Cirrhosis
DIGE Differential in gel electrophoresis
ESI Electrospray ionization
HPLC High-performance liquid chromatography
H Healthy
HCC Hepatocellular carcinoma
HV Hepatitis virus
HBV Hepatitis virus B
HCV Hepatitis virus C
IBD Inflammatory bowel disease
IC Inflammatory controls
ICAT Isotope coded affinity tags
IDA Imminodiacetic acid
IECs Intestinal epithelial cells
IMAC Metal-ion affinity chromatography
iTRAQ Isobaric tags for quantitative proteomica
LC Liquid Chromatography
LDA Linear discriminant analysis
LMW Low molecular weight
m/z Mass to charge ratio
MALDI Matrix assisted laser desorption/ionization
MS Mass spectrometry
MudPIT Multidimensional protein identification technology
MWCO Molecular weight cut-off
PCA Principal component analysis
PIQS Parent ion quantification scanning
Q Quadrupole
RP Reverse phase
SELDI Surface enhanced laser desorpion/ionization
TOF Time-of-Flight
Introduction
Proteomics studies represent an important tool for the characterization of the phenotype of a population of cells, a serum sample, a tissue sample and for the identification of specific biomarkers of a given disease. For this reason proteomics has emerged as one of the most important topics in all of bioscience and is a rapidly growing multidisciplinary field that combines separation techniques, mass spectrometry and bioinformatic approaches. Many factors are involved in this increasing interest, first of all the huge potential of clinical proteomic research for the discovery of diseases biomarkers, molecules whose concentrations in the biological fluids or tissues can help in the early diagnosis or therapy monitoring of pathologies, thanks to the possibility of the simultaneous analysis of all proteins expressed in cells, biological fluids or tissues in specific physiological conditions. Furthermore in the last years proteins became central in biological studies after the complete deciphering of human genoma. There was an important shift in the molecular biology dogma due the evidence of the non-direct correlation between genome sequence and protein function, well summarized in a recent editorial: “proteins, not genes, are the business end of biology” [1].
Protein analysis and identification is greatly improved in the last years but methodological problems still limited the identification of proteins and peptides in complex biological matrices. Several gel-free proteomics and labelling techniques have appeared as important alternative to conventional bidimensional gel electrophoresis and many technological advancements have recently occurred, most of them due to the introduction of new mass spectrometers, but to better characterize samples in term of protein expression and functional proteomics studies novel proteomics approaches still need to be developed.
In this thesis work the development of two mass spectrometry-based protein profiling strategies and their application to biomarker discovery in liver and inflammatory bowel diseases is described and discussed.
Chapter 1
1.1 The complexity of biological samples
Biological samples such as cells, saliva, urine and serum are very complex and contain a high number of proteins which concentration ranges of many order of magnitude. Furthermore the biological samples are dynamic because of the enzymatic activity, the post-translational modifications and protein-protein interactions.
An example of the complexity of the interactions among proteins and of the way they work together forming multi complexes to carry out specific functions is shown in figure 1.1. Figure 1.2 shows the distribution of serum proteins among highly-abundant proteins (HAP), moderately-highly-abundant proteins (MAP) and low highly-abundant proteins (LAP): few HAP represent the 96% of the total amount of serum proteins, while LAP, that are often the potential biomarkers of pathological states, are less than 1%.
For these reasons always more sophisticated analytical tools are needed for an in-depth analysis of biological samples proteome. In particular proteomics challenges for robust, automated, and sensitive high-throughput technologies able to resolve complex biological samples using the combination of different separation techniques.
Figure 1.2: Part A. Highly-abundant (HAP), moderately-abundant (MAP) and low-abundant
(LAP) proteins in human plasma. Relative abundance of HAP, MAP and LAP fractions is shown in percentage of the bulk mass of the proteins from each fraction to the bulk weight of the total plasma protein. Part B: list of HAP. Image from www.genway.com
1.2 Protein profiling strategies
The ability of protein biomarkers to give indications of physiological states or change make them an important diagnostic and predictive tool in many clinical settings. Since disease processes involve very complex interactions of large numbers of proteins, there is a considerable interest in the technologies and data analysis techniques specially designed to handle this level of complexity, making it possible to study the entire complement of proteins, the “proteome”, of a blood or tissue sample. The simultaneous analysis of many proteins in a single sample may reveal patterns in their presence, abundance and modifications that result in a “protein signature” associated with the presence or absence of disease at a stage when it is otherwise undetectable. Such a signature, involving dozens or even hundreds of markers, is more likely to provide accurate predictive or diagnostic information than
Highly-abundant
proteins Moderately-abundant proteins Low abundant proteins
HAP MAP LAP
4% 2%
A.
a single marker. The same techniques may also be used to analyse a complex disease process and identify key molecules that could be targets for drug development.
Two main strategies are used for protein profiling studies, gel-based and gel-free proteomics, which differ on the use of mono-bidimensional gel electrophoresis as separation technique.
1.2.1 Gel-based protein profiling
In the gel-based approach the proteins are separated by bidimensional gel electrophoresis (2DE), an established technique since the late 1970s [3], according to their isoelectric point (pI) in the first dimension and to the molecular mass weight in the second dimension. After the separation the proteins maps obtained from the different samples can be visualized and compared using appropriate bioinformatic tools, and the differently expressed proteins can be excised, in-gel digested and identified by mass spectrometry.
Bidimensional electrophoresis is a technique widely used because of its potentiality to separate thousands of proteins, but is time consuming and needs expert and qualified personal to be performed. However, thanks to many improvements in the technique such as Differential In Gel Electrophoresis (DIGE), the feasibility, the reproducibility and the sensitivity of the experiments have been drastically increased and allowed the use of this approach for very in-depth studies of protein expression in different biological states.
1.2.2 Gel-free protein profiling
The gel-free protein profiling approaches are based on the study by mass spectrometry of the fingerprint (or protein pattern) of proteins characteristic of a specific sample or biological state.
A typical mass spectrometry protein profiling approach can be performed by enrichment of proteins according to their physical/chemical features followed by MALDI-TOF analysis. The comparison among spectra, one of the critical points of this approach, allows the evaluation of the proteins differentially expressed which can be identified by MALDI-TOF-TOF analysis or by isolation of the proteins of interest followed by tryptic digestion and MS analysis. The surface-enhanced laser desorption/ionization (SELDI) TOF MS technology, an extension of MALDI MS, can
because of its sample target, which is derivatized with different planar chromatographic chemistries, the design of the analyser and the software tools used to interpret the data. On the sample target the proteins actively interact with the chromatographic array surface, and become sequestered according to their surface interaction potential as well as separated from salts and other sample contaminants by subsequent on-spot washing with appropriate buffer solutions.
Other gel-free protein profiling approaches are based on multidimensional separation of peptides from enzimatically digested proteins by bi/tri-dimensional liquid chromatography (LC) or by the combination of monodimensional gel and LC analysis, both of them followed by ESI-QTOF analysis. The experiment can be performed both in the MS/MS or MS operational mode. The former modality, the so-called “shot-gun” proteomics, was initiated with the introduction of the Multidimensional Protein Identification Technology (MudPIT) [4] and can yield to the identification of hundreds of proteins.
The latter modality allows the evaluation of the differentially expressed proteins among the proteins from different biological states and their identification by a following a MS/MS analysis. This comparative studies can be carried out using label-free approaches or isobaric-isotopic derivatizing strategies such as iTRAQ [5] or ICAT [6,7] that permit the simultaneous analysis of the different samples.
1.3 Mass spectrometry soft ionization techniques and
analysers
Mass spectrometry (MS) is an analytical technique that measures the molecular weight of molecules based upon the motion of a charged particle in an electric or magnetic field.
The analytes are ionized in the gas phase and separated according to their mass/charge ratio (m/z). Due to its ability to acquire high-content of information, mass spectrometry has emerged among the proteomics techniques as the method of choice for analysing the study of the composition, regulation and function of protein complexes in biological systems [8-10].
Mass spectrometers are used either to measure simply the molecular mass of a polypeptide or to determine additional structural features including the amino acid sequence or the site of attachment and type of posttranslational modifications [11]. A mass spectrometer can be split into three main parts: the ionization source where the gas phase ions are produced from sample molecules, the mass analyser where the ion separation occurs and the mass detector where the signal is recorded.
1.3.1 Soft ionization techniques
For a long time mass spectrometry was restricted to small and thermostable compounds because of the lack of effective techniques to softly ionize and transfer the ionized molecules from the condensed phase into the gas phase without excessive fragmentation. Only in the late 1980s the situation evolved with the development of two techniques for the formation of molecular ions of intact biomolecules: electrospray ionization (ESI) [12] and matrix assisted laser desorption/ionization (MALDI) [13]. The proteins became accessible to mass-spectrometric analysis.
1.3.1.1 MALDI
MALDI is a pulsed ionization technique which utilises the energy from a laser to desorb and ionize the analyte molecules that are co-crystallised on a target with an excess of small organic molecules which absorbs light at the wavelength of the laser (matrix)[13].
The crystals are bombarded with a UV-laser with a typical wavelength of 337nm and the matrix adsorbs most of the energy transferring only a little amount of it to the analytes which sublimates into the gas phase and ionizes by protonation (positively charged ions) or by deprotonation (negatively charged ions).
Many different matrices have been adopted for bio-mass spectrometry, but the most important are α-cyano, 4-hydroxy cinnamic acid (CHCA) for peptides and sinapinic acid (SA) for proteins.
MALDI produces mostly single charged ions that are generated into high-vacuum (5x10⁻⁶) and accelerated into the mass analyser, typically a Time-of-Flight (TOF).
Matrix-analyte crystals MALDI target-plate TOF analyser laser AH+ detector Desorbment Ionization Acceleration Separation Detector Matrix-analyte crystals MALDI target-plate TOF analyser laser AH+ detector Desorbment Ionization Acceleration Separation Detector
Figure 1.3: schematic of the MALDI process
1.3.1.2 ESI
Electrospray ionization is a technique that uses an electric field to yield a spray of fine droplets. A diluted solution of the sample is sprayed from a narrow capillary tube which carries a high potential (about 4–5 kV). If the needle carries a positive potential, the droplets will have an excess of positive charges, usually protons. Evaporation of the volatile solvent (i.e. H2O, CH3OH, or CH3CN) results in increased
Coulombic repulsion between the positive charges, which causes fragmentation of the droplet, generating smaller droplets. This process continues till nanometer sized droplets are produced.
The charges are statistically distributed over the analyte’s potential charge sites, enabling the formation of multiply charged ions. Each multiply charged ion can be termed “charge state”, and the distribution of charge states is characteristic of large macromolecules during ESI analysis [14].
This feature of ESI to produce predominantly multiply charged ions (opposed to singly charged ions produced by MALDI) yields a reduced mass for the analytes of interest. Figure 1.4 shows the comparison among MALDI and ESI spectra of Cytochrome C. From a MALDI spectra its possible to easily obtain information about the molecular weight of the proteins, while from ESI spectra a deconvolution need to be performed. Furthermore for complex biological samples a separation step prior to mass spectrometry analysis is necessary.
Since ESI ionizes the analytes out of a solution, it can be easily coupled to liquid chromatography and capillary electrophoresis, but for analysis of low abundant samples a low flow rate is needed (sub-micolitre). The use of a nanospray ionization
source with a flow rates in the order of nanolitres per minute increased drastically the sensitivity [15].
Figure 1.4: schematic of electrospray ionization.
Figure 1.5: example of Cytochrome C spectrum after MALDI (a) and ESI (b) ionization.
Differently charged ions are generated.
1.3.2 Mass analysers
The mass analyser is the region of the mass spectrometer where the ions are separated according to their mass to charge ratio (m/z), and can be considered as the central part of the technology. The main four different analysers that have been developed for proteomics applications are the Time-of-Flight (TOF), the ion-trap, the quadrupole and the Fourier Transform ion cyclotron (FT-MS). All of them differs for sensitivity, resolution and mass accuracy. In order to improve the analysis of complex proteins samples many different multistage combinations of these analysers have been developed, such as hybrid quadrupole - Time-of-Flight (QqTOF) and tandem Time-of-Flight (TOF-TOF) [16,17].
1.3.2.1 QUADRUPOLE
The quadrupole analyser consists of four parallel hyperbolic rods through which the gas phase ions have to achieve a stable trajectory [18]. A stable voltage and an oscillating voltage (radio frequency, rf) is applied to one pair of rods and an opposite polarity voltage and rf of different phase is applied to the opposite pair of rods. For every specific voltage the created electric field allows only to ions with a certain m/z value to cross the analyser and reach the detector. The quadrupole voltage can be set to allow a wide mass range to be observed or a single ions to be selected.
Few advantages can be observed in proteomics study if the analyser is constituted of a single quadrupole, but the coupling of three quadrupoles analysers in sequence or two quadrupoles followed by a TOF can yield to important structural information (see tandem and hybrid analysers section).
1.3.2.2 TIME-OF-FLIGHT (TOF)
TOF analyser separates the ions that have been produced in the ion source and accelerated by high voltage to a final velocity dependant on their mass. Since the accelerating voltage is constant, the mass measurement can be recorded by the Time-of-Flight of an ion into the TOF tube, that is proportional to the square root of its mass to charge ratio.
Time-of-Flight =
k
m
/
z
The linear TOF analyser, the simplest one, can claim high sensitivity and a very broad mass range. However also if the resolution increases with longer flight tubes it’s usually very poor and can hardly discriminate among isotopes. This kind of analyser is for this reason used only for high molecular weight proteins (more than 10kDa), while for peptides the reflectron TOF analyser is preferred.
A reflectron acts as an ion mirror reversing the trajectory of the ions back into the flight tube and for this reason increasing the length of the flight tube [19]. Moreover the reflectron focuses the ions that have a different kinetic energy due to their position in the source during the application of the accelerating voltage. The full width half maximum (FWHM) mass resolution obtained is usually more than 5000.
1.3.2.3 TANDEM AND HYBRID ANALYSERS
Different combinations of mass analysers have been developed. The most important for proteomic studies, schematized in figure 1.6, are the triple quadrupole (Q-q-Q), the quadrupole – ion trap (Q-Trap), the quadrupole – Time-of-Flight (Q-TOF) and the Time-of-Flight – Time-of-Flight (TOF-TOF) because they allow a wide range of research strategies with their capability in collecting useful information about protein identity and modifications.
Figure 1.6: Different mass analysers configurations. Image obtained by Aebersold and
Mann 2003 [17].
The introduction of these multiple analysers permits the use of two operation modes of a mass spectrometer: the MS mode where molecular weight are measured, and the MS/MS mode where the analyte of interest can be mass measured, selected and fragmented in the mass spectrometer by collision induced dissociation (CID) generating important structural information. MS/MS experiments using triple quadrupole (Q-q-Q), quadrupole – Time-of-Flight (Q-TOF) and Time-of-Flight – Time-of-Flight (TOF-TOF) analysers are widely performed in proteomics.
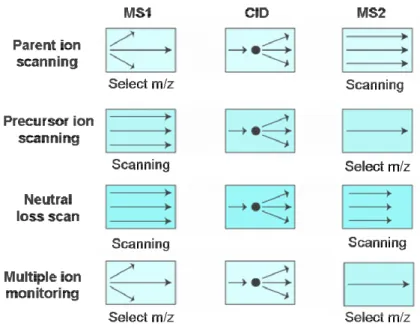
All of these analysers can be operated in four different ways to perform MS/MS experiments: product ion scanning, precursor ion scanning, neutral loss scanning and multiple ion monitoring (see figure 1.7).
Figure 1.7: schematic representation of the four operation modes to perform MS/MS
analysis
In the parent ion scanning the first analyser (MS1) selects a specific m/z (precursor ion) at a time and after CID in the collision cell the resulting fragments are analysed in the second analyser (MS2). This operation mode is particularly useful in proteomic for the identification of the aminoacidic sequence of specific peptides. The precursor ion scanning operation mode scans the ions in the MS1 and after CID the MS2 selects only specific fragments. The signal is recorded only when the desired m/z fragment reaches the detector. This method is useful for the detection of peptides with functionalised groups such as phosphate esters or carbohydrate modification, since they produce specific ions after fragmentation.
In the neutral loss scanning method both the analysers are synchronised to allow only specific mass differences, a neutral fragment lost from the peptides in the collision cell, to pass through MS1 and MS2. The detection of peptides with specific functional groups can be performed, such as phosphorylation at serine residues via the loss of phosphoric acid.
The last operation mode, the multiple ion monitoring (MRM), is used for the detection of specific fragments in MS1 and of specific peptides in the MS2. This method is particularly useful for the detection of known analytes with known fragmentation patterns present into a complex mixture.
1.4 Mass spectrometry analysis of complex
protein/peptides mixtures
Several strategies have been developed for mass-spectrometry based protein analysis that can all be summarized in three main steps: (I) isolation of protein from the biological sample, fractionation (optional), enzymatic digestion and further fractionation of the resulting peptides (very common); (II) qualitative and quantitative analysis of the peptide mixture by mass spectrometry; (III) bioinformatic analysis of the large data set generated by MS/MS analysis, aimed at the identification, and potentially quantification, of the proteins in the sample. The identification is performed by database searching according to specific guidelines [20,21].
Figure 1.8 shows the detailed workflow of the four main strategies used in MS-based proteomics. In part A the proteins are separated by 2D gel electrophoresis, digested, analysed by MS and the proteins identified by peptide mass fingerprint (PMF); part B shows the shotgun proteomics approach, where the protein identification and quantification are performed on randomly selected peptides which are subjected to product ion scanning. In part C a LC-MS analysis step followed by differential analysis of the peptide mixture is performed, with the aim to drive the choice of the peptides to identify and quantify in a second step of MS/MS analysis on the differently expressed ones. Finally, in part D of the figure the peptides chosen for the identification and quantification are selected according to hypothesis from previous experiments, and subjected to multiple ion monitoring (MRM) for a better precision.
Figure 1.8: mass spectrometry based proteomics workflows. Image adapted from Domon B and Aebersold R [11]
1.5 Chemometric and bioinformatic tools for proteomic
data analysis
The development of new analytical strategies, workflows and instruments allows to acquire for every experiment a huge amount of proteomic data that need new statistical and bioinformatic tools to be used and correlated properly. In particular in this thesis work the software PARVUS [22], for the multivariate analysis of MALDI mass spectra, msInspect [23] for the visualization of LC-MS data and the database server PROTEIOS [24] for the conversion of data and the differential analysis of LC- MS runs have been used.
1.5.1 Parvus
In protein profiling studies the comparison of data such as MALDI spectra, the classification of samples and the evaluation of the discriminating peptides/proteins need complex multivariate statistical techniques to be used. PARVUS is a package of programs for explorative data analysis, classification and regression analysis that, among the others, allows to perform the linear discriminant analysis (LDA), the principal components analysis (PCA) and the selection of variables with high disciminant power.
Figure 1.9: screenshot of the PARVUS software, that allows the use of many different
1.5.2 MsInspect
Successful application of differential proteomics by liquid chromatography mass spectrometry (LC-MS) requires extraction of peptide features, estimation of peptide abundances, relative quantification, alignment e normalization across multiple related runs, and identification of features.
MsInspect is an open-source software that applies new algorithm for each step of this process, looking for peptide signatures rather than isolated peaks in LC-MS data. It can be used both by command line for batch processing of very large data set or by graphical interface (figure 1.10), thus allowing a better comprehension of the LC-MS data visualization [23].
Figure 1.10: the msInspect window has four panes: the Image Pane displays an image of
the data from MS1 run, the Detail Pane displays a zoomed in view of the area in the Image Pane, the Chart Pane displays m/z spectra and elution profiles corresponding to the scan and m/z value, the optional Properties Pane displays properties of the open mzXML or Feature Set file or the peptide feature selected in the Detail Pane.
1.5.3 Proteios
Proteios is a comprehensive database server to manage and track all the massive amounts of data generated by proteomics experiment and analysis [24]. In particular it can manage the whole workflow from images, raw data and database search results. Furthermore it can be used for data format conversion and statistical analysis on alignment files produces by msInspect software, in order to evaluate the differently expressed peptides in various LC-MS runs.
Figure 1.11: screenshots of PROTEIOS database server interface
1.6 Liver and inflammatory bowel diseases:
ethiopathogenesis and existing biomarkers
Mass spectrometry-based protein profiling is a relative young field of analysis that observed a massive increase in the available technologies. Many efforts are made for the discovery of new biomarkers, but frequently the studies become only a proposal of new technology approaches, losing the biological meaning of what is found out. "Bio" must be put back into biomarkers [25].
For this reason in this thesis mass spectrometry based protein profiling strategies have been developed and applied to biomarker discovery in two important gastrointestinal diseases: liver and inflammatory bowel diseases.
1.6.1 Inflammatory bowel diseases (IBDs)
Ulcerative colitis (UC) and Crohn’s disease (CD) are clinico-pathologic constructs that collectively are termed inflammatory bowel diseases (IBDs). Given the non-specific nature of the symptoms that herald disease onset (diarrhea, often bloody, abdominal pain, malaise, fever, weight loss), the diagnosis is usually made by endoscopic, histologic or radiographic testing.
Serum antibody testing represents another diagnostic avenue for distinguishing IBD from non-IBD patients. While individual tests may suffer from low sensitivity or specificity, the combination of multiple antibodies into a summary panel holds promise. IgA antibodies to the outer membrane porin C of E. coli, (anti-OmpC); Antibodies to the bacterial flagellin Cbir1(Cbir1); and Perinuclear anti-neutrophilic cytoplasmic antibodies (pANCA) based on three measures:
autoantibody by ELISA; perinuclear pattern of ANCA by immunofluorescence; and DNAse sensitivity. The clinical relevance of such panel testing, however, is uncertain based on two important features.
The same lack of specificity seen in endoscopic, histologic, and radiographic testing impacts not just the distinction between IBD and non-IBD patients, but also distinguishing ulcerative colitis from Crohn’s colitis. The term “indeterminate colitis” refers to the inability to distinguish ulcerative colitis from Crohn's disease even after colectomy [26]. The clinical importance in these patients lies in the consequences of medical, and more importantly, surgical therapy.
Several studies have recently been published using proteomic approaches for serum profiling in IBD. Meuwis et al. analysed serum samples from IBD patients and controls with SELDI-TOF mass spectrometry [27]. They found that a proteomic approach had greater sensitivity and specificity than testing for pANCA and ASCA. The markers they found, however, seemed to correlate best with activity of disease. Proteomic strategies have also been applied to isolated intestinal epithelial cells from IBD mucosa [28].
1.6.2 Liver diseases
Liver diseases consist in at least two classes: one in which the hepatocytes are damaged (viral, alcholic, autoimmune…) and one in which the bile flow is interrupted (colestatic diseases).
The developed work is focused on the hepatocellular damage and in particular in the viral infection of the hepatocytes. Viral infections of the liver are very common diseases and can be caused by different virus such as hepathytis C virus (HCV), B (HBV), A (HAV).
HAV is more common under 25 years age and is usually an acute infection without any consequences if treated correctly, whereas HCV and HBV are more common after the first quarter of life. These infections can be acute or chronic if persist for more than 6 months.
Different antiviral treatments exists for those infections but the main issue is that if the infection of the liver persists the cells will be totally damaged, the architecture of the liver will be completely altered and the tissue will be replaced with fibrosis. Therefore the infection can cause cirrhosis (CIR) of the liver and the cirrhosis itself is a way to the development of the hepatocellular carcinoma (HCC).
The HCV virus may cause a chronic infection in 60-70% of the people who get infected, while the HBV virus may cause a chronic infection in 1%. Thus, the development of cirrhosis and consequently the hepatocellular carcinoma is more frequent in HCV patients.
Diagnosis for the infection is supported by the detection of viral markers in the blood, while the ultra-sounds are the gold standard for the detection of cirrhosis and the development of the carcinoma. The damage of the liver is also evident in a blood routine analysis (coagulation, cholesterol, bilirubin, platelets….). The prediction of the switch from chronic infection to cirrhosis, and must of all the development of the hepatocellular carcinoma, is often a challenge.
The characteristic tumoral marker for HCC is α-fetoprotein (AFP), but its concentration is very variable and for this reason both sensitivity and specificity are very low. For this reason new markers have been proposed, such as des-gamma-carboxy prothrombin (DCP). The combination of these two markers increases a lot both specificity and sensitivity, but new biomarkers are still needed. Many protein profiling studies for biomarker discovery, well reviewed by Chignard N. and Beretta L. [29], have been performed both on serum and cellular samples, allowing the identification of different signalling pathways in liver carcinogenesis and providing source of novel molecular targets for new therapies [30].
Chapter 2
Serum protein profiling by solid-phase bulk extraction
MALDI-TOF MS and chemometric data analysis
Serum is a complicated matrix containing more than 20000 proteins with a wide range of concentrations exceeding even 10 decades [31]. Furthermore the presence of high abundant proteins such as albumin, masks the low abundant proteins which usually are of diagnostic utility since they change their expression level and regulation in relation to a given disease.
Despite the powerful of the new soft impact mass spectrometry (MS) technologies such as matrix-assisted laser desorption/ionization – Time-of-Flight (MALDI-TOF/TOF) and electrospray ionization quadrupole Time-of-Flight (ESI-QTOF), the main problem in clinical proteomics is the difficulty to efficiently isolate the proteins of interest from the matrix to produce a “clean” sample suitable for MS analysis. Differences in the protein expression patterns between diseased and normal samples is generally carried out using two dimensional polyacrylamide gel electrophoresis (2D-PAGE). After gel staining the protein(s) of interest are removed, proteolytically or chemically digested and identified by MS analysis and proteomic databases search. The need for protein staining often limits the sensitivity of the overall approach. The development of two-dimensional nano-liquid chromatography (nano-LC) coupled with ESI-QTOF MS greatly improved the analysis of proteins at low concentration levels, but sample preparation and clean-up procedures are still necessary [32].
Methods for sample preparation [33], including size cut-off membrane-based methods like dialysis and ultracentrifugation, selective protein precipitation and solid phase extraction (SPE) have gained importance, but none of them yet fulfil criteria of applicability.
SPE is the most used approach for selective protein extraction both on-line with LC ESI-MS [34,35] and, in particular, off-line with MALDI MS [36,37]. Many different devices for the off-line coupling such as micropipet tips packed with SPE media [38], microtiter plates with integrated SPE [39] and modified MALDI target plates for the purification of the sample directly on-target like Integrated Selective Enrichment target (ISET) [40] are now available.
Recently other approaches based on technologies such as SELDI (surface-enhanced laser desorption/ionization) or MassPREP PROtarget (Waters, Milford, MA) have been developed [41-43].
As alternative approach we developed a simple and rapid top-down analytical proteomic method, based on the selective solid phase extractions of serum proteins in bulk using differently derivatized beads prior to the analysis by MALDI-TOF MS, followed by chemometric analysis for the recognition of a pattern of proteins more relevant for the discrimination between diseased/non-diseased samples and the classification of samples.
The developed method was applied to the study of MALDI-TOF MS serum protein expression profiles of two important types of diseases: liver and inflammatory bowel diseases (IBDs, Crohn’s disease and ulcerative colitis). Because of the not specific nature of the symptoms, the differential diagnosis in IBDs cannot be made with the common serological tests and requires endoscopic, histological or radiological examination; also if recently new tests have been introduced none of them alone can be of diagnostic utility [44,45]. Liver diseases are extremely common and there is still a strong demand for specific markers of switch from chronic infection to cirrhosis and hepatocellular carcinoma.
Linear discriminant analysis (LDA), a multivariate classification technique, was here used as classification method. LDA is a probabilistic parametric classification technique based on the estimates of the probability distributions which allows the classification of an object in the class with the higher assignment probability. Since an excessive number of variables prevents the use of LDA, the initial large amount of variables (m/z values), due to the high resolution of TOF analyser, was reduced by features selection. The selection of a pattern of 10-20 relevant m/z values not only allows the application of LDA, but also the direct correlation between the selected m/z and proteins involved in the discrimination between healthy subjects and among the IBD patients, opening the possibility of their identification as biomarkers.
2.1 Introduction
The search for disease protein biomarkers by MALDI MS needs the development of serum sample preparation techniques and the use of statistical analysis methods for their identification and validation.
A simple methodological approach able to evaluate the differences in MALDI-TOF MS serum protein expression profiles among liver and inflammatory bowel diseases was developed.
The developed procedure uses the interaction of proteins with different functionalized beads (SAX, C18, IDA-Cu(II)) added directly to the serum samples. Selective solid-phase bulk extraction, purification and concentration of proteins were simultaneously performed and the suspension of beads-bound proteins was directly analysed by MALDI-TOF MS. Feasibility studies for the application of functionalized carrier materials for direct MALDI-TOF MS serum protein profiling were already performed by other research groups [46-48], but to our knowledge none of them applied it for biomarkers discovery. In this thesis the first application in clinical proteomics of this methodological approach combined to chemometric analysis of the obtained mass spectra is reported.
The use of beads in bulk procedure instead of derivatized surfaces (such as SELDI chips) for the solid phase extraction increases the interaction area between analytes and functionalized groups allowing to extract more proteins with a faster kinetic due to polydispersion of the microsized beads reducing diffusion problems when the solid phase is a surface with a consequent steric hindrance problem.
The elution step was performed by the application of the matrix on the suspension of beads-bound proteins previously spotted directly on the MALDI-target plate, thus preventing the potential loss of proteins/peptides typical of the extraction during the elution step. The whole workflow is shown in figure 2.1.
Figure 2.1: workflow of the developed MALDI-TOF MS protein profiling approach.
2.2 Experimental
2.2.1 Materials
Silica C18/Corasil beads (Bondapak® 37-50µm) were purchased from Waters and strong anion-exchange (SAX, 40-50µm) beads were from Varian (Palo Alto, CA). All the chemicals and solvent were purchased from Sigma Aldrich (St. Louis, MO, USA) and used without further purification.
2.2.2 Patients
Blood samples were provided by the Gastroenterology Unit at S.Orsola University Hospital of Bologna (Italy) after obtaining informed consent from the patient.
A total of 63 subjects, including 22 healthy donors volunteers (H; 9 M and 13 F), 15 Crohn’s disease (CD; 9 M and 6 F), and 26 ulcerative colitis patients (UC; 13 M and 13 F), were admitted to the preliminary step of the study of the inflammatory bowel diseases while a total 129 subjects were included in the follow-up study (50 H; 20 M
and 30 F; 30 CD; 21 M and 9 F, 40 UC; 20 M and 20 F, 9 non-specific inflammatory controls (IC) such as irritable bowel, celiac disease, arthritis, liver disease; 5 M and 4 F).
A total of 61 subjects, including 17 healthy donors (H; 9 M and 8 F), 19 hepatitis C (HCV; 6 M and 4 F) and hepatitis B (HBV; 6 M and 3 F), 13 cirrhosis of the liver without malignant or suspicious nodules (CIR; 8 M and 5 F) and 12 hepatocellular carcinoma diagnosed during chronic hepatopathy (HCC; 8 M and 4 F) patients were admitted to the study of liver diseases.
All the subjects were ranging in age from 20-65 years. The diagnosis of the IBD was achieved by clinical symptoms, clinical chemistry data and conventional endoscope procedures and patients with either active and inactive disease were included. The clinical diagnosis of the disease was assessed according to the CDAI (Crohn’s disease activity index) and to the Truelove & Witt classification.
The diagnosis of liver diseases was achieved by clinical symptoms, blood analysis and ultrasound examination.
From each subject five millilitres of blood sample were collected and centrifuged at 4000 rpm for 10 min. The obtained serum samples were distributed into aliquots and stored frozen in plastic vials at -80°C until use.
2.2.3 Sample preparation
All the serum samples were subjected to solid phase extractions. In the study of IBD three different SPE were used: reverse phase (silica C18), anion exchange (SAX) and immobilized metal ion affinity-Cu(II) (IMAC-Cu(II)). In the liver diseases study only IMAC-Cu(II) extraction was carried out. The SPE was performed directly in 500 µL assay tube using 5 mg of derivatized beads. Each sample was analysed in duplicate.
Reverse phase extraction
Silica C18 beads were washed two times with 150 µL acetonitrile (ACN), mixed for 2 minutes and centrifuged at 13.400 rpm for 1 min. The surnatant was removed and the residue was equilibrated twice using 150 µL 0.1% trifluoroacetic acid (TFA), then 40 µL of serum sample was added.
After 10 min of room temperature incubation two washing steps with 150 µL 0.1%TFA for the removal of unbound proteins were performed and a 10 µL
Anionic exchange extraction
Strong anion exchange beads were washed two times with 150 µL methanol (MeOH), mixed for 2 minutes and centrifuged at 13.400 rpm for 1 min. The surnatant was removed and the residue was equilibrated twice using 150 µL 10 mM ammonium bicarbonate buffer (pH 7.7) then 40 µL of serum sample was added. After 10 min of room temperature incubation two washing steps with 150 µL 10 mM ammonium bicarbonate buffer (pH 7.7) for the removal of unbound proteins were performed and a 10 µL suspension of beads-bound proteins residue in the washing solution was obtained.
Metal ion affinity - Cu(II) extraction
For immobilized metal ion affinity chromatography (IMAC), Cu(II) was loaded on derivatized cellulose particles. Both the procedure for derivatization of cellulose with iminodiacetic acid (IDA) and the saturation with Cu(II) ions were previously described by Feuerstein et al [49].
The beads were washed two times with 150 µL 50 mM sodium acetate buffer pH 4.0, mixed for 2 minutes and centrifuged at 13.400 rpm for 1 min. The surnatant was removed and the residue was equilibrated twice using 150 µl phosphate buffered saline buffer (PBS) pH 7.4.
At the same time 40 µl of serum sample was treated with 30 µl 8 M urea containing 1% 3-[(3-cholamidopropyl) dimethylammonio]-1-propanesulfonate (CHAPS) in PBS by mixing for 2 min. Afterwards 100 µl 1 M urea containing 0.125% CHAPS was added, the mixture was diluted to 850 µl with PBS and vortexed at 4 °C for 10 min. Four hundred microlitres of the diluted serum sample were added after the equilibration step and the whole suspension mixture was incubated on a platform shaker at 1500 rpm for 2 h at 30 °C. To remove unbound proteins two washing steps with 150 µl equilibration buffer, followed by a quick washing step with 200 µl deionized water were performed. A 10 µL suspension of beads-bound proteins residue in deionized water was obtained.
2.2.5 Mass spectrometry
One microlitre of each suspension of beads-bound proteins was directly applied onto a standard 100-spot stainless steel MALDI-target plate, mixed with 1 µL of sinapinic acid matrix (30 mg/mL, 50% ACN/0.1% TFA) and analysed. It is important to add the matrix solution before the sample is air-dried.
Proteins bound to the derivatized beads were analysed by matrix-assisted laser desorption/ionization time-of-flight (MALDI-TOF) using an Applied Biosystems Voyager-DE PRO mass spectrometer equipped with a 337-nm nitrogen laser. Analysis were performed in linear positive-ion mode, using delayed extraction. The acceleration voltage was 25 kV, guide wire was 0.15 of the accelerating voltage, grid voltage was 93%, and the delay time was 200 ns. Four spectra for each sample were collected manually in the m/z range 2000-10000 averaging 120 laser shots. External mass calibration was performed using the calibration mixture 2 of the Sequazyme peptide mass standard kit (Applied Biosystems, Darmstadt, Germany), containing bovine insuline (3 pmol/µL), ACTH (1.5 pmol/µL) and angiotensin I (2 pmol/µL).
Intra-assay repeatability and inter-assay reproducibility studies were performed using healthy donor serum samples. For the repeatability study, solid phase extractions were performed in duplicate and four MALDI spectra were acquired for each replicate. The reproducibility of the procedure was assessed by analysing the same samples in different days.
The raw spectra were processed with the Voyager Data Explorer software (version 4.0.0.0, Applied Biosystems).
2.2.5 Data pre-processing
Before statistical analysis data pre-processing steps were needed. Beside the external calibration a re-alignment process was done. A healthy donor serum sample, considered as quality control, was internally calibrated by deposition on MALDI-target plate of 1 µL of the suspension of beads-bound proteins with 1 µL of calibration mixture diluted 1:6 in matrix solution for serum samples extracted by SAX and 1:2 for serum samples extracted by IDA-Cu(II) and C18. Four peaks present in all the spectra obtained from the same SPE were considered as references peaks and used for a re-alignment process (m/z = 4213.15, 5341.26, 7772.62, 9296.50 for SAX; m/z = 3955.76, 4644.01, 6631.03, 8929.64 for C18; m/z = 4283.2, 6432.21, 7764. 67, 8932.41 for IDA-Cu(II)).
No peak detection step was performed on the mass spectra. Data were exported from Voyager Data Explorer software as ASCII text files and m/z values were reduced from more than 16000 to 1600 data points by average every 5 m/z values.
For each sample 8 spectra were collected (4 spectra for sample, each sample in duplicate), 4 were selected according to signal/noise ratio and averaged in order to obtain a single representative spectra for each subject.
2.2.6 Statistical analysis
After pre-processing of MALDI spectra a data matrix for each extraction procedure was obtained. The three final data matrices contain as many rows as samples and as many columns as m/z values obtained after data pre-processing (1600).
The three data sets were imported in the chemometrical software package V-PARVUS [22] and the multivariate analysis was performed.
Normalization of the data by row profile and column centering was applied to correct the drift sensitivity [50].
Linear Discriminant Analysis (LDA) [51] was used as classification method after applying SELECT [52], a features selection technique for the reduction of the original number of variable that permits to retain only the useful variables (m/z).
2.3 Results and discussion
The main goals of profiling studies are the evaluation of protein patterns that distinguish between classes such as diseased/non-diseased, the classification of samples and the identification of the protein biomarkers involved in these patterns [53]. For this comparative analysis of protein profiles spectra reproducible MALDI protein profiling strategies are pivotal, but has been recently demonstrated that also the data pre-processing step and the statistical analysis are critical points that must be improved [54].
In figure 2.2 it’s possible to notice the differences among the typical MALDI MS protein profiles obtained by the three serum proteins extraction principles.
In order to evaluate the variability of the MALDI-TOF MS spectra obtained an intra-assay repeatability and inter-intra-assay reproducibility study were performed. Figure 2.3 shows how among a given extraction principle the protein profiles showed a stable pattern of peaks with similar intensity ratio between them, thus allowing the use of this analytical method for MALDI MS protein profiling.
Figure 2.2: example of MALDI-TOF mass spectra obtained after sample preparation using
C18, IDA-Cu(II) and SAX solid-phase bulk extractions.
Figure 2.3: reproducibility of serum protein profiles obtained by C18, IDA-Cu(II) and SAX
solid-phase bulk extraction combined with MALDI-TOF MS analysis. As described in the Results and Discussion section, each serum sample was extracted in duplicate with every bulk-SPE, spotted twice on the MALDI-target plate and two spectra were acquired for each spot (eight spectra from four spots). The figure shows for each serum sample the four spectra with the higher signal/noise ratio.
A well designed data pre-processing and multivariate analysis step must be performed for the recognition of the proteins evaluated as significant in the classification, otherwise from the same data set different results can be obtained. For example in many recent comparative studies concerning the same tumor/non-tumor protein patterns [55-61] a prediction ability >90% was always obtained, but there was no agreement about the proteins involved in the discrimination.
After baseline subtraction the re-alignment of the peaks was done, since during the acquisition of the data a mass error up to 200 ppm was sometimes obtained despite the external calibration step. A pattern of peptides was evaluated as stable between the spectra obtained from the same extraction principle and for this reason used for the re-alignment. Usually a number of about 16000 m/z values (variables) in the selected m/z range (2000-10000) was obtained for each raw mass spectrum. To each m/z value is associated one intensity value.
In our approach we reduced the variables number to 1600 by averaging every 5 m/z values, since the TOF analyser resolution doesn’t allow the discrimination between peaks closer than this value. Using this procedure the data dimension was extremely reduced.
With the aim to decrease the variability due to sample preparation steps and the crystallization of the protein-bound beads with the matrix every sample was analysed in duplicate. Each sample was spotted twice on the MALDI-target plate and two spectra were acquired. A total of eight spectra were obtained. The spectra with the higher signal/noise ratio for each spot were taken into account and the average (arithmetic mean of the intensities for each m/z value) among the obtained four spectra was calculated to reduce the number of data without loss of information. In this way a representative spectrum for each serum sample was obtained facilitating the subsequent multivariate analysis.
LDA was applied to the obtained data set. LDA is a classification method that searches for directions (discriminant functions) with maximum separation among categories. The first discriminant function is the direction of maximum ratio between inter-class and intra-class variances.
In these works classification and prediction abilities were computed for every class (H, CD, UC and IC for the IBDs study and H, HCC, HCV, CIR for the study of liver diseases). When the prediction ability is almost equal to the classification ability validates the classification rule built on the training set. To evaluate the prediction rate the cross-validation procedure was performed with five cancellation groups
(CV): the classification rule was computed five times, each time with the objects of four CV. The classification ability was calculated as the percentage of training set objects correctly classified while the prediction ability was measured on the objects of the left-out group. The number of CV, five, is considered to provide a more realistic, not too optimistic, evaluation of the prediction rate, as usually happens using the leave-one-out validation procedure [62].
Since the high number of variables in the MALDI spectra (more than 16000 m/z values) prevents the use of LDA a variables reduction is needed.
This can be done applying the Principal Component Analysis (PCA) and using the scores as input for LDA [63].In these studies the variables selection is proposed as an alternative to the use of the significant principal components because it presents some advantages such as the easy identification of a pattern of m/z values with high discriminant power.
Features selection is an important aim of chemometrics: its goal is to discard variables without discriminant information and to maintain only those variables which really improve classification ability. SELECT is a feature selection technique based on the stepwise decorrelation of the variables and it is implemented in the V-PARVUS; it generates a set of decorrelated variables ordered according to their Fisher weights. SELECT searches, at each step, for the variable with the largest classification weight. This variable is selected and decorrelated from the other variables; then the algorithm is repeated until a fixed number of variables is selected. In these works different protein patterns with different numbers of retained variables (10, 15, 20, 25, 30) corresponding to m/z values were used as input for the following LDA.
2.3.1 Inflammatory bowel diseases
The study of inflammatory bowel diseases was performed in two steps. The first step, a preliminary study where only 63 subjects were included, was necessary for the evaluation of the extraction procedure able to obtain the serum protein profiles with the best classification ability. In the second step the work was carried out with the previously selected extraction procedure by analysing serum samples from 129 subjects.
2.3.1.1 PRELIMINARY STUDY
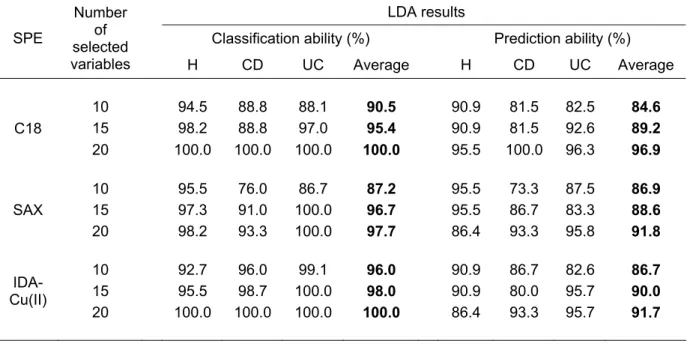
In table 2.1 are reported the variables selected for the three data matrices while table 2.2 shows the LDA results for each data set. It’s possible to observe that LDA results improve by using the pattern of 20 variables. In general all the extraction methods gave similar results, but overall we preferred C18 principle both for the prediction ability achieved and for the easy and fast extraction procedure. In particular using this procedure the 100% of samples were correctly classified and the 96.9% of average prediction ability with 5 CV was achieved. The prediction ability was 95.5% for healthy subjects, 100% for Crohn’s disease patients and 96.3% for ulcerative colitis patients. A graphical display of C18, SAX and IDA-Cu(II) results, where the objects are projected on the first two canonical variables of LDA, is here reported (figure 2.4). Results show a perfect separation among the three categories (H, CD and UC), thus proving the capability of this methodological approach for the identification of discriminating protein profiles in the detection of IBDs.
SPE
Number of selected
variables Selected variables
10 2555, 3505, 3525, 3745, 3815, 3885, 4635, 4650, 5755, 7610 15 2555, 2755, 2975, 3505, 3525, 3745, 3815, 3885, 4635, 4650, 4735, 5755, 7610, 8605, 9155 C18 20 2555, 2615, 2755, 2975, 3505, 3525, 3600, 3745, 3815, 3885, 4635, 4650, 4735, 4740, 5755, 6610, 6850, 7610, 8605, 9155 10 2275, 3030, 3775, 3995, 4305, 5165, 5270, 5770, 5815, 6830 15 2275, 3030, 3125, 3775, 3950, 3995, 4305, 4740, 5165, 5270, 5770, 5815, 6830, 8210, 8760 SAX 20 2275, 3030, 3125, 3225, 3775, 3950, 3995, 4000, 4305, 4740, 5165, 5270, 5470, 5475, 5770, 5815, 6830, 8210, 8760, 8935 10 2420, 2795, 2935, 4155, 4180, 4215, 4785, 5925, 8960, 9305 15 2340, 2420, 2440, 2795, 2935, 3940, 4155, 4180, 4190, 4215, 4785, 5925, 6685, 8960, 9305 IDA-Cu(II) 20 2205, 2340, 2420, 2440, 2795, 2935, 3260, 3940, 4155, 4180, 4190, 4215, 4785, 4795, 5580, 5925, 6075, 6685, 8960, 9305
Table 2.1: variables (m/z values) selected by SELECT features selection technique.
LDA results
Classification ability (%) Prediction ability (%) SPE
Number of selected
variables H CD UC Average H CD UC Average 10 94.5 88.8 88.1 90.5 90.9 81.5 82.5 84.6 15 98.2 88.8 97.0 95.4 90.9 81.5 92.6 89.2 C18 20 100.0 100.0 100.0 100.0 95.5 100.0 96.3 96.9 10 95.5 76.0 86.7 87.2 95.5 73.3 87.5 86.9 15 97.3 91.0 100.0 96.7 95.5 86.7 83.3 88.6 SAX 20 98.2 93.3 100.0 97.7 86.4 93.3 95.8 91.8 10 92.7 96.0 99.1 96.0 90.9 86.7 82.6 86.7 15 95.5 98.7 100.0 98.0 90.9 80.0 95.7 90.0 IDA-Cu(II) 20 100.0 100.0 100.0 100.0 86.4 93.3 95.7 91.7
Figure 2.4: graphical display of LDA results obtained from MALDI-TOF MS serum protein
profiles of healthy donors and IBD patients. Objects are projected on the first two canonical variables.
2.3.1.2 C18 SOLID-PHASE BULK EXTRACTION
After the selection of C18 solid-phase bulk extraction the follow-up to the study was performed including more serum samples for every category (n° 50 healthy subjects (H), n° 30 Crohn’s disease (CD) and n° 40 ulcerative colitis (UC) and an optimum classification and prediction ability was achieved (97.0% and 87.5% respectively, data shown in table 2.3; figure 2.5). For this more representative set of data 30 variables were selected.
Table 2.3: classification and prediction ability values obtained by the analysis of 120 serum
samples from H donors, CD and UC patients
Figure 2.5: graphical display on the first two canonical variables of the results of LDA of 120
serum spectra from healthy subjects and patients affected from IBD (Crohn’s disease and ulcerative Colitis, both in the active and inactive phases) treated with C18 solid phase.
The patients included in the study were both in active and inactive disease phases, hence the obtained results are particularly promising for further studies. Indeed performing LDA including only healthy donors and CD and UC patients in the active disease phases (data reported in table 2.4 and figure 2.5) results even better were obtained. This can be explained by the higher number of differences among the protein expression profiles in the active phase.
LDA results
Classification ability (%) Prediction ability (%) Number
of selected
variables H CD UC Average H CD UC Average 30 97.6 96.7 98.5 97.0 86.0 86.7 90.0 87.5
Table 2.4: classification and prediction ability values obtained by the analysis of 91 serum
samples from H donors and CD and UC patients in the active phases of the disease.
Figure 2.6: graphical display of LDA results obtained from MALDI-TOF MS serum protein
profiles of healthy donors (H) and IBD patients in the active phase of disease (Crohn’s disease active (CDact) and ulcerative colitis active (UCact)). The objects are projected on the first and second canonical variables.
Afterwards a little number of non-specific inflammatory controls (IC: irritable bowel, celiac disease, arthritis, liver diseases…), analysed in the same lack of time of H, CD and UC samples, has been introduced in the classification model and the classification and prediction ability were calculated (table 2.5).
Figures 2.7A and B show the LDA results on different canonical variable planes and a perfect discrimination of the inflammatory controls from the other categories can be observed. However the inclusion of the inflammatory controls decreases the prediction ability of all the other groups. This can be due to the little number of samples in this category compared to the number of samples in the other ones: one
LDA results
Classification ability (%) Prediction ability (%) Number
of selected
variables H CDact UCact Average H CDact UCact Average 25 100.0 100.0 100.0 100.0 92.0 94.7 77.7 89.0
more category is added but it’s not strongly represented. For this reason more inflammatory control serum samples need to be analysed in order to better validate the classification model.
LDA results
Classification ability (%) Prediction ability (%) Number
of selected
variables H CD UC IC Average HV CIR HCC H Average
30 94.0 92.7 83 100 90.7 76.0 66.7 67.5 100 72.9
Table 2.5: classification and prediction ability values obtained by the analysis of 129
samples from H, CD, UC and IC serum samples
Figure 2.7: graphical display of LDA results obtained from 129 MALDI-TOF MS serum
protein profiles of healthy donors (H), IBD patients (Crohn’s disease (CD) and ulcerative colitis (UC)) and inflammatory controls (IC). In figure A the objects are projected on the first and third canonical variables, while in figure B on the second and third canonical variables.
An in-depth analysis of the final results was carried out to calculate the sensitivity (true positive), the specificity (true negative) and the accuracy of the method (table 2.6). The comparison of the classification results of IBD samples and controls (H and IC) allowed to obtain a sensitivity and a specificity of 87.1% and 76.0% respectively, thus meaning that the protein expression profiles in IBD and controls samples are very different. Otherwise a lower sensitivity and specificity have been obtained comparing CD and UC samples (both of them about 67%) that can be explained by the higher similarity among the respective protein patterns. Finally the classification results of both active and inactive samples from CD and UC samples
were compared among them: a high accuracy was obtained for CD samples while only a 60% accuracy was calculated for UC. The method seems to be more sensitive and specific for Crohn’s disease than for ulcerative colitis.
Sensitivity Specificity
C18
(true pos) (true neg) Accuracy
IBD vs H 61 / 70 87.1% 38 / 50 76.0% 99 / 120 82.5%
IBD vs all control 61 / 70 87.1% 47 / 59 79.7% 108 / 129 83.7%
CD vs UC 20 / 30 66.7% 27 / 40 67.5% 47 / 70 67.1%
Active CD vs inactive CD 17 / 19 89.5% 8 / 11 72.7% 25 / 30 83.3%
Active UC vs inactive UC 12 / 22 54.6% 12 / 18 66.7% 24 / 40 60.0%
Table 2.6: sensitivity (true positive), specificity (true negative) and accuracy results.
2.3.2 Liver diseases
The developed method has been applied to the analysis of serum samples from healthy donors and patients affected from different liver diseases. The serum proteins were extracted only by IDA-Cu(II) bulk-solid phase extraction due its capability to extract phosphorylated proteins, and the MALDI spectra acquired. Figure 2.8 shows a MALDI spectrum from one sample of each group analysed.
Protein phosphorylation is a dynamic and reversible event essential to the proper functioning of physiological processes, including cell proliferation and programmed cell death. Since protein phosphorylation is a regulatory event, it follows that the protein kinases that catalyze phosphorylation, should themselves be subject to regulation. The improper regulation of protein kinases has been implicated in many human pathologies, including cancer.
Figure 2.8: example of MALDI-TOF mass spectra obtained after sample preparation using
IDA-Cu(II) solid-phase bulk extractions on serum from healthy donors (A) and patients affected by hepatitis C (B), cirrhosis (C) and hepatocellular carcinoma.
Two classification models have been calculated for the discrimination among hepatitis, cirrhosis and hepatocellular carcinoma patients (A), and for the discrimination among healthy donors, hepatitis, cirrhosis and hepatocellular carcinoma patients (B).
In table 2.7 and 2.8 the LDA results of the two classification models are reported. Figure 2.9A shows the perfect classification among the different diseases, with a classification and prediction ability of 97.3% and 88.6% respectively. This model has been calculated after selection of 10 relevant variables.
LDA results
Classification ability (%) Prediction ability (%) Number
of selected
variables HV CIR HCC Average HV CIR HCC Average 10 93.7 100 100 97.3 78.9 92.3 100 88.6
Table 2.7: classification and prediction ability results of LDA for the classification model A:
In the classification model B (15 variables selected) the healthy donors category has been included, thus decreasing both the classification and prediction ability to 95.1% and 80.6%. This can be explained by the low number of serum samples analysed and to the greater differences among healthy and diseased serum protein profiles than the one existing among the different diseases (data shown in figure 2.9B).
LDA results
Classification ability (%) Prediction ability (%) Number
of selected
variables HV CIR HCC H Average HV CIR HCC H Average 15 91.6 96.9 91.7 100 95.1 78.9 69.2 75.0 94.4 80.6
Table 2.8: classification and prediction ability results of LDA for the classification model B:
healthy donors (H) and hepatitis (HV), cirrhosis (CIR) and hepatocellular carcinoma (HCC) patients.
Figure 2.9:graphical display of LDA results obtained from MALDI-TOF MS serum protein profiles of hepatitis, cirrhosis and hepatocellular carcinoma patients (A), and healthy donors, hepatitis, cirrhosis and hepatocellular carcinoma patients (B). Objects are projected on the first two canonical variables.
2.3.3 Protein profiles specificity
A very common problem in protein profiling studies is the evaluation of the specificity of the obtained protein profiles, indeed the studies are often performed without the inclusion of sample to be used as a control (physiological state or other type of diseases). For this reason some of the data from both the studies have been
combined in a single dataset and analysed by LDA. In particular, since the two works have been performed in different lack of time, the MALDI-TOF MS spectra of hepatitis, cirrhosis and hepatocellular carcinoma were combined with a new set of MALDI-TOF MS spectra of ulcerative colitis serum samples analysed in the same period. The results (figure 2.10) demonstrate a good discrimination among ulcerative colitis and the different liver diseases, with an average classification and prediction ability of 92.5% and 75.8% respectively.
Figure 2.10: graphical display of LDA results obtained from MALDI-TOF MS serum protein profiles of hepatitis (HV), cirrhosis (CIR), hepatocellular carcinoma patients (HCC) and ulcerative colitis (UC). Objects are projected on the first two canonical variables.
2.4 Conclusions
The bulk solid-phase extraction was proved to be an useful methodological approach for the sample preparation and clean-up prior to MALDI-TOF MS analysis. This approach allows to obtain an enrichment of serum protein/peptides due to the high interaction surface between analytes and functionalized groups and a high recovery due to the elution step performed directly on the MALDI-target plate.
The application of LDA to the analysis of MALDI-TOF MS serum proteins profiles from IBD and liver diseases patients allows the classification of serum samples. In particular among healthy subjects and Crohn’s disease and ulcerative colitis patients the serum protein profiles obtained using the reverse phase extraction gave the best
prediction ability results (96.9%) and for this reason this technique has been the first choice for the prosecution of the IBDs serum protein profiling studies. After the analysis of 129 samples from H, CD, UC and inflammatory controls using C18 a 90.7% of classification ability and a 72.9% prediction ability were obtained. Furthermore the use of SELECT features selection technique for the selection of the variables with high discriminant power permitted the identification of a pattern of 25-30 m/z values involved in the differentiation and classification of serum samples. The recognition of this m/z values may give useful information in order to identify protein biomarkers involved in the disease.
The application of the method to serum biomarker discovery of viral hepatitis, cirrhosis and hepatocellular carcinoma using IDA-Cu(II) as extraction procedure allowed to identify a pattern of 15 discriminating peptides an to classify the samples with a 80.6% of correct prediction ability.
Finally, a cross-study was performed for the evaluation of the obtained profiles and the MALDI spectra from serum of healthy donors, ulcerative colitis, hepatocellular carcinoma, viral hepatitis and cirrhosis patients were combined in a single data set, obtaining a 75.8% of prediction ability.
The obtained results are very promising for the use of this analytical method as a simple tool for diagnostic and biomarker discovery in liver and inflammatory bowel diseases.

![Figure 1.6: Different mass analysers configurations. Image obtained by Aebersold and Mann 2003 [17]](https://thumb-eu.123doks.com/thumbv2/123dokorg/8229783.128675/16.892.147.800.340.624/figure-different-analysers-configurations-image-obtained-aebersold-mann.webp)